Wednesday February 7: Five things the markets are talking about
Risk-averse sentiment seems to have cooled for the time being, as a number of the major indexes rebounded in the overnight session.
Note: From a volatility standpoint, the forex market space appears tranquil when compared to other asset classes like equities or bonds.
The rebound in equity prices has spread to Europe, but capital markets remain on edge as Asian bourses pared their advance while U.S.futures retreated.
Elsewhere, U.S. Treasurys have rebounded after yesterday’s slump, along with gold and crude prices. The dollar has edged a tad lower as the FX market showed limited reaction to the sharp drop in equities earlier this week.
In Germany, the CDU/CSU, SPD political parties are said to have agreed on a grand coalition treaty.
Up next: Monetary policy decisions are due this week in New Zealand (Today 03:00 pm EDT) and tomorrow in the U.K (07:00 am EDT).
1. Some stocks record small gains
In Japan, equities pared early gains to end a tad higher overnight in a volatile trading session, as investors remained wary of further losses as U.S futures slipped from their highs. The Nikkei 225 share average ended +0.2% higher, while the broader TOPIX gained +0.4%.
Down-under, Aussie shares rebounded after Tuesday’s biggest one-day drubbing in roughly 24-months. Broad-based buying helped the S&P/ASX 200 index end up +0.8%. The benchmark slumped -3.2% in the previous session. In South Korea, the KOSPI index dropped more than -2%.
In Hong Kong, equities reversed their earlier gains and closed at a five-week low overnight, led lower by material and real estate firms. At close of trade, the Hang Seng index was down -0.89%, while the Hang Seng China Enterprise (CEI) index fell -2%.
In China, stocks slumped as developers and consumers fall. At the close, the Shanghai Composite index was down -1.81%, while the blue-chip Shanghai Shenzhen CSI 300 index was down -2.38%.
In Europe, regional bourses have rebounded from Monday’s sharp sell off, mirroring Wall Streets moves. However, U.S. stock futures (-0.8%) are pointing lower once again as volatility continues.
Indices: STOXX 600 +0.8% at 375.9, FTSE +0.6% at 7187, DAX +0.7% at 12474, CAC 40 +0.6% at 5191, IBEX 35 +0.6% at 9869, FTSE MIB +0.8% at 22518, SMI +1.0% at 8926, S&P 500 Futures -0.8
2. Oil steadies, as lower inventories offset by higher U.S. output, gold higher
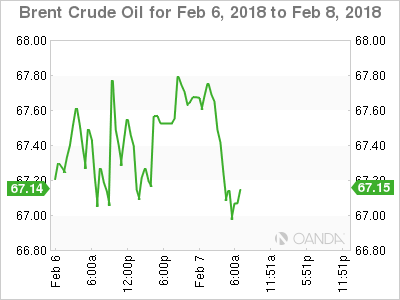
Oil prices are holding steady, as the boost from a report showing a drop in U.S. crude inventories last week was offset by evidence of soaring U.S. output.
Brent crude futures are down -11c to +$66.75 a barrel, while U.S. WTI crude futures have eased -12c to +$63.27 a barrel.
Data yesterday showed that crude inventories fell by -1.1m barrels in the week to Feb. 2 to +418.4m barrels, helping support the commodity.
However, rising U.S. oil production continues to hang over the market. EIA data shows that U.S. output has risen by +1m bpd in the last year to about +10m bpd.
Investors will take their cue from today's EIA crude stock report (10:30 am EDT).
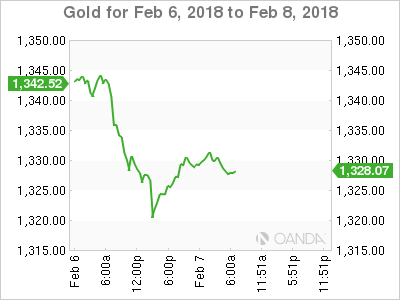
Ahead of the U.S. open, gold prices have rallied from their three-week low on bargain hunting. Spot gold is up +0.5% to +$1,331.23 per ounce. Prices fell over -1% yesterday to hit its lowest since Jan. 11 at +$1,319.96.
3. Sovereign yields fall
In the Euro session, southern European government bond yields have fallen sharply and have extended their recent outperformance on news of a coalition agreement in Germany viewed as positive for Euro integration.
Germany’s Chancellor Merkel’s conservatives and the Social Democrats (SPD) have agreed “in principle” on a coalition deal. This will take Europe’s economic powerhouse a step closer to a new government. Germany’s 10-year Bund yield has climbed +1 bps to +0.70%.
Italian, Spanish and Portuguese 10-year government bond yields are -5 to -8 bps lower, and spreads over benchmark German Bunds have tightened.
Elsewhere, the yield on 10-year U.S Treasuries has dipped -4 bps to +2.76%, while in the U.K, the 10-year Gilt yield has advanced less than +1 bps to +1.523%.
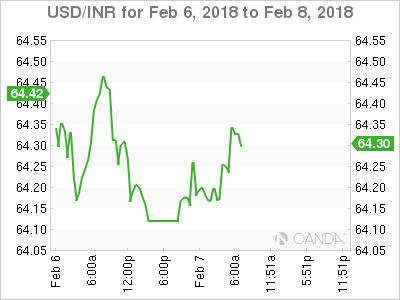
Overnight, in India the Reserve Bank of India (RBI) statement noted that the decision to keep policy steady (+6%) was not unanimous (5-1) with a dissenter calling for +25 bps hike. It maintained its neutral monetary policy stance and reiterated to keep headline inflation close to +4% target on a durable basis.
4. Dollar has ‘little traction’
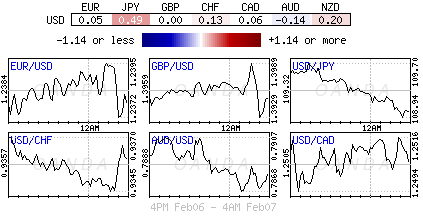
From a volatility standpoint, the forex market space appears tranquil when compared to other asset classes like equities or bonds. The U.S. dollar continues to be confined to its recent ranges against G10 currency pairs.
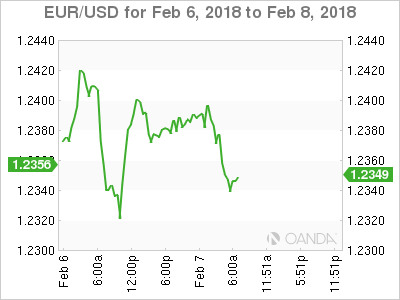
The EUR/USD (€1.2346) is a tad lower despite market reports of a grand coalition agreement in Germany. The pair continued to find headwinds above the psychological €1.24 level.
GBP/USD (£1.3884) continues to face headwinds as various press outlets noted that the E.U. is prepared to harden its stance during the transition phase of negotiations.
USD/JPY (¥109.07) remains the liveliest of currency pairs, as risk-on and risk-off continues to find capital market leverage.
Note: The Nikkei 225 index did see its initial +2% gain disappear in the final hour of trading.
5. German industrial output slips
Data from Europe this morning reveled that Germany’s industrial output slipped at the end of 2017.
Industrial production in December fell -0.6% m/m, led by construction output. Market consensus was looking for a -0.5% decline.
Germany’s economics ministry said manufacturers’ order books signal vigorous production in the coming months. The trend is “clearly pointing up” after reporting a +3.8% monthly gain in manufacturing orders in December on Tuesday.
