Friday May 11: Five things the markets are talking about
Yesterday’s US inflation data, which came in lower than expected at +0.2% vs. +0.3% m/m, has possibly removed some pressure from the Fed to step up the pace of monetary tightening. In the overnight session, the ‘mighty’ dollar has steadied after dropping the most since March on Thursday.
Global stocks have taken comfort in the fact that G7 central banks may not hike as fast as previously feared. Overnight in Europe, equities have erased some of their earlier advance, although regional bourses are heading for they seventh consecutive week of increases.
Elsewhere, US 10-year Treasury yields are holding below the psychological + 3% as US President Donald Trump’s plan to meet North Korea’s Kim Jong Un has aided sentiment somewhat.
In commodities, crude oil prices are steady, heading for a second-week of gains after the US pulled out of the Iran nuclear deal earlier this week.
On Tap: Canadian employment numbers are due at 08:30 am EDT. Market is anticipating +18k new hire and an unemployment rate to stay steady at +5.8%.
1. Stocks mixed results
In Japan, the Nikkei share average rose to a three-month high overnight, supported by tepid US inflation data and easing concerns over the pace of Fed hikes. The Nikkei closed the day up +1.16% and has gained +1.3% this week, while the broader TOPIX rallied +0.98%.
Down-under, Aussie stocks eased overnight and joined China as the only Asia-Pacific markets that were lower. At -0.04% the S&P/ASX 200 still racked up a sixth-straight weekly gain, the strongest run in two-years at +0.9%. In South Korea, the KOSPI gained +0.55%.
In Hong Kong, stocks rallied overnight after data showed China’s industrial demand remains resilient even as trade tensions ratchet up with the US. The Hang Seng index rose +0.9%, while the China Enterprises Index gained +0.4%.
In China, stocks fell on Friday, but posted their best weekly performance in almost three-months, as interest towards Chinese blue chips continues to build. The CSI 300 fell -0.5%, while the Shanghai Composite Index lost -0.4%.
In Europe, regional bourses have opened mixed after several were closed for Ascension Day yesterday. Weaker commodity prices are keeping material stocks under pressure, while the healthcare sector is outperforming.
US stocks are set to open in the ‘black’ (+0.1%).
Indices: STOXX 50 -0.3% at 3,557, FTSE 100 flat at 7,700, DAX -0.3% at 12,977,CAC 40 -0.4% at 5,524; IBEX-35 +0.1% at 10,258, FTSE MIB -0.1% at 24,015, SMI -0.2% at 8,970, S&P 500 Futures +0.1%

2. Oil atop multi-year highs as Iran sanctions tighten supply outlook
Oil prices are trading within striking distance of their four-year highs on Friday as the prospect of new US sanctions on Iran tightened the outlook for Middle East supply.
Benchmark Brent crude oil is unchanged at +$77.47 a barrel. Yesterday, Brent hit +$78, its highest since November 2014. US light crude is up +10c at +$71.46, having touched a 3-1/2 year high of $71.89 this week.
Currently, the global oil market is considered finely balanced, with top exporter Saudi Arabia and No.1 producer Russia having led efforts to curb oil supply to support global prices.
However, the US plans to reintroduce sanctions against Iran, which pumps about +4% of the world’s oil, after abandoning a deal reached in late 2015 that limited Tehran’s nuclear ambitions.
The market is anticipating that Iranian crude oil exports to start falling in the next few months and is expecting that Brent crude prices to trade atop of the +$80 handle.
Ahead of the US open, gold prices have eased a tad in range-bound trading as the dollar firmed slightly, with the market mostly brushing off a potential broadening of conflict in the Middle East. Spot gold is down -0.1% at +$1,319.61 per ounce. The precious metal is still on track to register a first weekly rise in a month. US gold futures, for June delivery, are -0.2% lower at +$1,320.20 per ounce.

3. Global sovereign yields slip
Investors are buying Euro bonds ahead of the US open, taking advantage of a rise in yields on the back of Italian political concerns, though Italian 10-year yields are still set for their biggest weekly rise in four-months.
Note: Increasingly likely that Northern League and Five Star will form an anti-euro, anti-austerity full on populist coalition in Italy. The League is reported as saying that leaving the EU/EUR was not one of the priorities and this is giving the market some confidence to buy the dip.
Elsewhere this week, central bankers north and south appear to have become even more cautious as concerns over inflation and international trade cloud the global economic picture. The Bank of England (BoE) yesterday held rates against recent expectations and Reserve Bank of New Zealand (RBNZ) said the official cash rate would remain at +1.75% for the foreseeable future.
The yield on US 10-Year notes has declined -1 bps to +2.95%, the lowest in more than a week. In Germany, the 10-Year Bund yield fell -1 bps to +0.54%, while in the UK the 10-Year Gilt yield fell less than -1 bps to +1.43%.

4. Loonie Looking For Further Gains
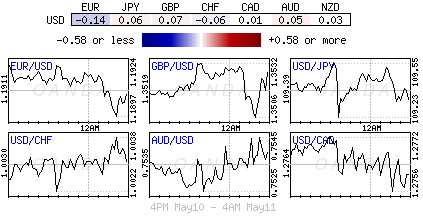
It was a quiet FX market overnight, with the US dollar consolidating its recent gains just shy of their multi-year highs after yesterday’s softer than expected inflation data.
USD/CAD is trading at its Euro session low at C$1.2746 ahead of this morning’s Canadian jobs report (+18k expected and an unemployment rate of +5.8%). This morning’s data is likely to shed light on whether the Bank of Canada (BoC) will raise interest rates on May 30 or at its subsequent meeting on July 11.
Note: Since the beginning of the year, the loonie has lost -1.5% against the US dollar and retreated the least against the ‘mighty’ buck since mid-April, when the dollar started to rise.
Despite trading briefly atop of its yearly lows this week (C$1.2997), many considered the CAD to still be undervalued compared with the US dollar. With oil prices unlikely to retreat rapidly due to tensions heating up in the Middle East and expectations remain that an agreement on a Nafta deal will ultimately be reached is certainly strong support for the CAD in the medium term.
EUR/USD is steady atop of €1.1920, despite the Italian political scene to likely see the Northern League and Five Star party form an anti-euro, anti-austerity coalition in Italy. Will the new Italian government make good on their populists promises or will the realities of power water them down?

5. Aussie housing-investor credit slumped in March
Data down-under overnight showed that Aussie housing-finance approvals fell -2.2% in March from February, with the value of lending to housing investors down -9%.
Other housing data earlier this month already showed that Australia’s housing market is soft with sales at auction falling sharply and prices in retreat in places like Sydney.
Tighter credit standards, and some negative press for banks and their practices are being blamed for the shutting off of the credit taps.