Friday April 27: Five things the markets are talking about
Overnight, global equities have nudged a tad higher, supported by a plethora of strong earnings results in the tech sector mostly.
The market has also been keeping an eye on the historic meeting between North Korea’s Kim Jong-un and South Korea’s Moon Jae-in. Thus far, holding talks over Kim’s nuclear weapons program has helped to ease some regional geopolitical tensions.
The ‘big’ dollar remains better bid, despite US treasury yields retreating below the psychological +3% yield level.
Elsewhere, the EUR is on the back foot after regional growth data from France and Spain eased, while the yen was little changed after the Bank of Japan (BoJ) maintained its stimulus, as expected.
In the UK, the pound has taken a ‘swan dive’ after data this morning revealed that their economy grew at the slowest pace in five years in Q1.
Commodities have retreated, led lower mostly by oil.
On tap: In the US, the market will be focusing on Q1 GDP data (08:30 am EDT).
1. Stocks remain better bid
In Japan, stocks rallied to three-month highs overnight as chip-related firms rallied after brisk earnings forecasts. The Nikkei share average ended up +0.7%. For the week, the Nikkei gained +1.4% and posted a fifth consecutive gain. The broader TOPIX advanced +0.3%.
Note: Markets will be closed on Monday in Japan for a national holiday.
Down-under, Aussie shares closed near a six-week high on Friday, led by health care stocks. The S&P/ASX 200 index rose +0.7% and racked up a weekly gain of around +1.4%. In South Korea, the KOSPI was underpinned by optimism as leaders of North and South Korea held their first summit in over a decade, rising +0.8%.
In Hong Kong, shares ended higher overnight, led by IT and energy stocks. The Hang Seng index ended up +0.9%, while the China Enterprises Index rallied +1%. For the week, the Hang Seng fell -0.5%, while HSCE rose +0.1%.
In China, stocks ended higher, led by healthcare. The blue-chip CSI300 index ended flat, while the Shanghai Composite Index edged up +0.2%. For the week, CSI300 slipped -0.1%, while SSEC gained +0.3%.
In Europe, the FTSE 100 is rallying (+0.45%) as sterling tumbles (-0.7%) after data shows a sharp UK economic slowdown (see below) and now casts doubt over prospects for a BoE May rate hike.
US stocks are set to open in the ‘red’ (-0.2%).
Indices: STOXX 600 +0.1% at 383.9, FTSE 100 +0.4 at 7451, DAX +0.7% at 12586, CAC 40 +0.1% at 5460, IBEX-35 +0.1% at 9905, FTSE MIB -0.6% at 23885, SMI +0.1% at 8839, S&P 500 Futures -0.3%

2. Oil prices ease, but concerns persist over Iran supplies, gold unchanged
Ahead of the US open, oil prices have eased a tad, but Brent crude remains supported on dips amid concerns that Iran may face renewed sanctions.
Brent crude futures are down -27c, or -0.4%, at +$74.47 a barrel, after rising +1% yesterday. US West Texas Intermediate (WTI) crude has fallen -19c, or -0.3%, to +$68 a barrel. The contract gained +0.2% on Thursday.
Note: Brent is heading for a third week of gains, up by +0.5%, while WTI is set to drop -0.4% for the week.
Dealers expect that the US will, in May, re-impose sanctions against Iran, who is a major oil producer and member of the OPEC. President Trump indicated this week that he would decide by May 12 whether to restore US sanctions on Iran.
Also supporting prices is global demand and the declining output in Venezuela, OPEC’s biggest producer in S. America.
For the crude ‘bears’, further gains have been capped by rising US production as shale drillers ramp up activity in sync with higher oil prices.
Gold prices continue to trade atop their five-week low ahead of the US open and is set for a decline of more than -1% this week, weighed down by a strong dollar, high US Treasury yields and easing geo-political concerns. Spot gold is unchanged at +$1,316.58 per ounce, not far from a low of +$1,315.06 an ounce hit in yesterday’s session. It will be the yellow metals biggest weekly decline in four. US gold futures are unchanged at +$1,317.50 per ounce.

3. Sovereign yields fall
Sovereign yields are under pressure again.
The ECB’S caution, combined with eurozone inflation that’s slow to adjust to Draghi’s target, is keeping investors’ in the hunt for yield and carry in eurozone government bonds.
While in the UK, dealers are now pricing only a +20% chance that the BoE will raise interest rates at the next meeting in May, after this morning’s disappointing Q1 GDP data. The market had been pricing in a +50% chance last week.
In Japan overnight, the Bank of Japan (BoJ) kept its overnight rate steady as expected. In their statement, the BoJ omitted its prior reference related to reaching +2% inflation target around 2019/20 and remained committed to achieving the +2% inflation target at the earliest time possible.
The yield on 10-year Treasuries has dipped -2 bps to +2.97%, while in Germany; the 10-year Bund yield declined -3 bps to -0.57%, the lowest in more than a week. In the UK, the 10-year Gilt yield has plummeted -6 bps to +1.444%, the lowest in a month.

4. Dollar in demand
The USD is trying to close out this week on firm footing against G7 currency pairs despite the US 10-year yield curve moving back below the psychological +3% level. All this week, the greenback found support on the back of rate differentials, especially as the ‘normalization process’ getting dialled back in both Europe and Japan.
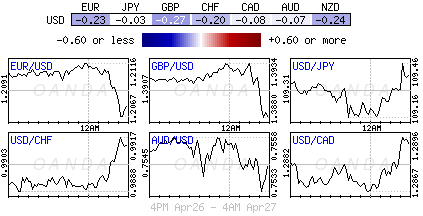
The GBP (£1.3803, -0.93%) has plummeted after UK Q1 GDP registered a big miss, deeming that the slowdown was broader than expected and not only weather related. The probability of a BoE May rate hike has fallen to +20%. A month ago it was considered a done deal.
According to many techies, the EUR/USD (€1.2085) in on the verge of a technical breakout to the downside, which would wipe all of its 2018 gains. Will this morning’s US GDP data be the impetus?
USD/JPY (¥109.28) remains steady despite the BoJ dropping its phase of achieving the inflation target in 2019/20. Kuroda downplayed the removal of the text, noting, “It did not erase the timeframe due to concerns about having to delay it again.”

5. UK economy grows at its slowest pace in five-years
Data this morning showed that the UK economy grew at its slowest pace in more than five years in Q1, dampening the case for an interest rate increase from the BoE next month.
The ONS that GDP expanded +0.1% in Q1 when compared with the previous three-months – an annualized rate of +0.4%.
This marked a visible slowdown from Q4, 2017, when the economy expanded +0.4%. The market was expecting a quarterly increase of +0.3%.
The ONS cited a contraction in construction as dragging on the UK’s economic growth, although added that the impact of the snowy weather during the quarter was limited.
Note: In February, the BoE signalled that further rises would likely be necessary to curb inflation, which accelerated sharply, spurred by the pound’s post-referendum collapse.