- English (UK)
- English (India)
- English (Canada)
- English (Australia)
- English (South Africa)
- English (Philippines)
- English (Nigeria)
- Deutsch
- Español (España)
- Español (México)
- Français
- Italiano
- Nederlands
- Polski
- Português (Portugal)
- Português (Brasil)
- Русский
- Türkçe
- العربية
- Ελληνικά
- Svenska
- Suomi
- עברית
- 日本語
- 한국어
- 简体中文
- 繁體中文
- Bahasa Indonesia
- Bahasa Melayu
- ไทย
- Tiếng Việt
- हिंदी

Johnson & Johnson (JNJ)
View the Johnson & Johnson stock price live, this page displays NYSE JNJ stock exchange data. View the JNJ premarket stock price ahead of the market session or assess the after hours quote. Monitor the latest movements within the Johnson & Johnson real time stock price chart below. You can find more details by visiting the additional pages to view historical data, charts, latest news, analysis or visit the forum to view opinions on the JNJ quote. (ISIN: US4781601046)
What Is the Current Stock Price of Johnson & Johnson?
The Johnson & Johnson stock price is 254.66.
Who Founded Johnson & Johnson?
Johnson & Johnson was founded in 1886 by three brothers: Robert Wood Johnson, James Wood Johnson, and Edward Mead Johnson. The company began as a manufacturer of surgical dressings and medical supplies.
Where is Johnson & Johnson HQ?
While this company has operations around the globe, the current JNJ headquarters is located in New Brunswick, New Jersey (U.S.).
When Did Johnson & Johnson Stock Go Public?
Johnson & Johnson went public in 1944 and has been listed on the New York Stock Exchange since then.
When Was the Last Time Johnson & Johnson Stock Split?
Johnson & Johnson's most recent stock split occurred on June 12, 2001. This was a 2-for-1 stock split.
What Stock Exchange Does Johnson & Johnson Trade On?
Johnson & Johnson is listed and trades on the NYSE stock exchange.
What Is the Stock Symbol for Johnson & Johnson?
The stock symbol for Johnson & Johnson is "JNJ."
Is JNJ the Same as $JNJ?
$JNJ is a common way to refer to the Johnson & Johnson ticker symbol in social media, forums, and online discussions. The dollar sign is a shorthand convention used to indicate that it is a stock ticker symbol.
What Are Johnson & Johnson's Main Business Segments?
Following the 2023 spinoff of its consumer health business (Kenvue), Johnson & Johnson now operates through two main segments: Pharmaceutical (innovative medicines) and MedTech (medical devices and technologies).
What Are Johnson & Johnson's Key Products?
Johnson & Johnson's key pharmaceutical products include treatments for immunology (Stelara, Tremfya), oncology (Darzalex, Erleada), neuroscience (Spravato), infectious diseases, and cardiovascular conditions. Its MedTech portfolio includes surgical devices, orthopedics, vision care, and other medical technologies.
What Is Johnson & Johnson's Dividend History?
Johnson & Johnson is known for its exceptional dividend history. The company has increased its dividend for 62 consecutive years (as of 2024), making it a "Dividend King." This consistent dividend growth record is one of the longest among all publicly traded companies.
What Major Corporate Change Did Johnson & Johnson Recently Complete?
In May 2023, Johnson & Johnson completed the separation of its Consumer Health business, which became an independent publicly traded company called Kenvue Inc. Kenvue now owns brands like Tylenol, Listerine, Band-Aid, Neutrogena, and Johnson's Baby products, while Johnson & Johnson retained its pharmaceutical and medical device businesses.
Is Johnson & Johnson a Good Stock to Buy?
Determining whether Johnson & Johnson, or any stock, is a good buy requires comprehensive analysis. To evaluate its potential, users can sign up to InvestingPro, where they can assess stock price fair value and other essential metrics.
NYSE
Symbol | Exchange | Currency | |||
|---|---|---|---|---|---|
| JNJ | · | NYSE | · | USD | |
| JNJ | · | Xetra | · | EUR | |
| JNJ | · | Switzerland | · | CHF | |
| JNJUSD | · | Switzerland | · | USD | |
| 1JNJ | · | Milan | · | EUR | |
| JNJ | · | Vienna | · | EUR | |
| DJNJ2m | · | Buenos Aires | · | ARS | |
| DJNJ3m | · | Buenos Aires | · | ARS | |
| JNJm | · | Buenos Aires | · | ARS | |
| JNJB34 | · | B3 | · | BRL | |
| JNJ | · | Toronto | · | CAD | |
| JNJ | · | Mexico | · | MXN | |
| JNJCO | · | Colombia | · | COP | |
| JNJUS | · | Lima | · | USD | |
| JNJ | · | Ukraine | · | UAH | |
| JNJ | · | Frankfurt | · | EUR | |
| JNJ | · | TradeGate | · | EUR | |
| JNJ_KZ | · | KASE | · | USD | |
| JNJ | · | CBOE Canada | · | CAD |
Currency in USD
Fair Value
An estimate of a stock's true price based on valuation models like discounted cash flow, peer valuation multiples, and dividend discount models.
Day's Range
247.87
255.11
52 wk Range
151.52
255.11
Unusual trading volume
1/3
Fair Value
An estimate of a stock's true price based on valuation models like discounted cash flow, peer valuation multiples, and dividend discount models.
Day's Range
247.87255.11
52 wk Range
151.52255.11
Key Statistics
Edit
Prev. Close
Open
Volume
Average Vol. (3m)
1-Year Change
Book Value / Share
Fair Value
Fair Value Upside
Market Cap
Shares Outstanding
Revenue
Net Income
EPS
EPS Growth Forecast
Next Earnings Date
(2.10%)
Dividends Payment Streak
P/E Ratio
Return on Assets
Return on Equity
Gross Profit Margin
Price/Book
EBITDA
EV/EBITDA
Beta
JNJ Scorecard
Company’s Health
Assesses a company's financial position by analyzing its market value, financial ratios, industry benchmarks, and competitors.
UnlockFair Value
An estimate of a stock's true price based on valuation models like discounted cash flow, peer valuation multiples, and dividend discount models.
Unlock PriceTechnical Analysis
Strong Buy
Price Target
257.32
Upside
+1.04%
Members' Sentiments
Bearish
Bullish
ProTips
Tips that distill complex financial data into concise, actionable investment insights.
Stock generally trades with low price volatility
Technical Analysis
Summary
Strong Sell
Sell
Neutral
Buy
Strong Buy
Strong Buy
Technical Indicators
Strong Buy
Moving Averages
Strong Buy
Analyst Ratings
15 Buy
7 Hold
1 Sell
Ratings:
23 analysts
Overall Consensus
Buy
Analysts 12-Month Price Target:
Average 257.32
(+1.04% Upside)
Johnson & Johnson SWOT Analysis
Analyst Perspectives | Average price target of $165, with ratings ranging from Equal Weight to Outperform, reflecting mixed views on J&J's growth potential and market position |
Strategic Acquisitions | Delve into J&J's recent ITCI acquisition, strengthening its neuroscience portfolio and potentially offsetting challenges from Stelara's patent expiration |
MedTech Challenges | Explore the headwinds facing J&J's MedTech segment, including underperformance in Orthopedics and Electrophysiology, and strategies for improvement |
Oncology Powerhouse | Johnson & Johnson's oncology portfolio set to triple sales by 2030, with potential to exceed $50 billion annually, driven by innovative treatments |
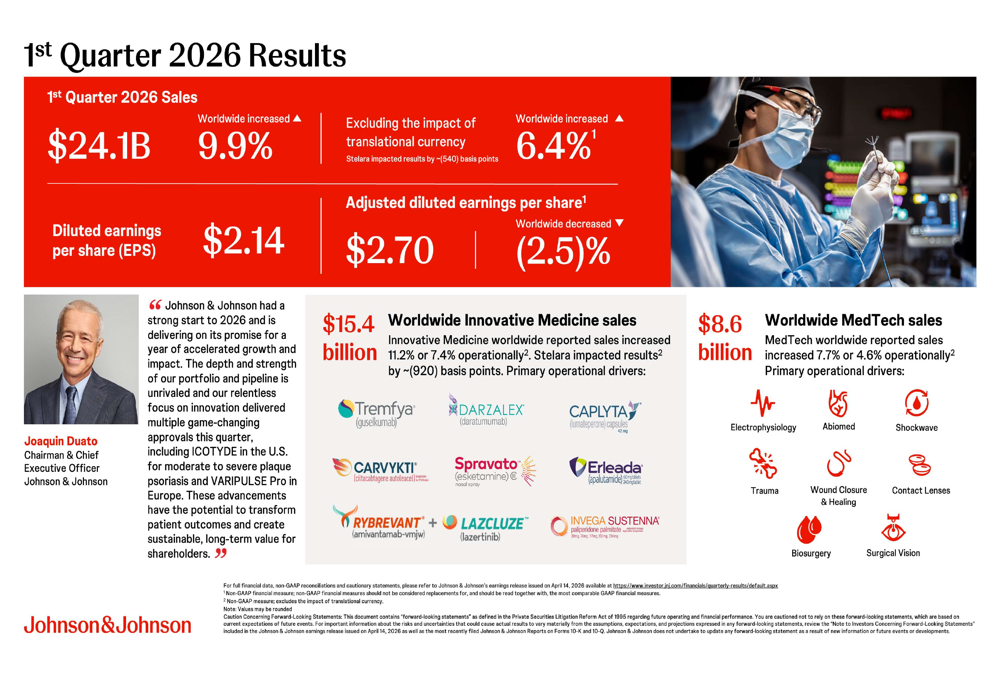
Johnson & Johnson Earnings Call Summary for Q1/2026
- Q1 2026 revenue hit $24.1B (up 6.4% YoY), beating estimates of $23.61B; adjusted EPS of $2.70 topped forecast of $2.68 by 0.75%
- Stelara sales plunged 61.7% due to biosimilar competition, creating major headwind; excluding Stelara, company posted double-digit growth
- Full-year guidance raised on strength in oncology/immunology portfolios and expected momentum from new product launches in MedTech
- Stock declined 0.5% in premarket to $236.78 despite earnings beat, reflecting investor concerns over biosimilar pressures on key products
- U.S. sales grew 8.3% vs international 3.9%; net earnings reached $5.2B as company navigates tariffs and regulatory challenges
Last Updated: 04/14/2026, 09:56 AM
Read Full TranscriptJ&J investor slides for Q1/2026
Last Update: Apr 14, 2026
See full investor slides
Earnings
Latest Release
Apr 14, 2026
EPS / Forecast
2.70 / 2.68
Revenue / Forecast
24.1B / 23.61B
Compare JNJ to Peers and Sector
Metrics to compare | JNJ | Sector Sector - Average of metrics from a broad group of related Healthcare sector companies | Relationship RelationshipJNJPeersSector | |
|---|---|---|---|---|
P/E Ratio | 29.1x | 25.1x | −0.4x | |
PEG Ratio | −7.48 | 0.07 | 0.00 | |
Price / Book | 7.5x | 4.0x | 2.6x | |
Price / LTM Sales | 6.4x | 4.0x | 3.0x | |
Upside (Analyst Target) | 2.8% | 0.0% | 56.9% | |
Fair Value Upside | Unlock | 10.8% | 9.3% | Unlock |
Johnson & Johnson, together with its subsidiaries, engages in the research and development, manufacture, and sale of a range of products in the healthcare field worldwide. It operates in two segments, Innovative Medicine and MedTech. The Innovative Medicine segment offers products for various therapeutic areas, such as oncology, immunology, neuroscience, pulmonary hypertension, infectious diseases, and cardiovascular and metabolism distributed through retailers, wholesalers, distributors, hospitals, and healthcare professionals for prescription use. The MedTech segment provides a portfolio of products used in the surgery, orthopedic, cardiovascular, and vision fields distributed through wholesalers, hospitals and retailers, and used in the professional fields by physicians, nurses, hospitals, eye care professionals and clinics. This segment also offers products and enabling technologies that support joint reconstruction, trauma, spine, sports related injuries, and others, as well as open, laparoscopic, and robotic surgical procedures; instrumentation, energy devices, stapling systems, wound closure, biosurgery products, and digital and robotic technologies; breast aesthetics and reconstruction; contact lenses under the ACUVUE brand; intraocular lenses for cataract surgery, and other products used in cataract and refractive procedures under the TECNIS brand. The company was founded in 1886 and is based in New Brunswick, New Jersey.
Ownership
Ownership Overview
Top Holders
People Also Watch
FAQ
What Is the J&J (JNJ) Stock Price Today?
The J&J stock price today is 254.66 USD.
What Stock Exchange Does J&J Trade On?
J&J is listed and trades on the New York Stock Exchange.
What Is the Stock Symbol for J&J?
The stock symbol for J&J is "JNJ."
Does J&J Pay Dividends? What’s The Current Dividend Yield?
The J&J dividend yield is 2.1%.
What Is the J&J Market Cap?
As of today, J&J market cap is 613.50B USD.
What Is J&J's Earnings Per Share (TTM)?
The J&J EPS (TTM) is 8.64.
When Is the Next J&J Earnings Date?
J&J will release its next earnings report on Jul 15, 2026.
From a Technical Analysis Perspective, Is JNJ a Buy or Sell?
Based on moving averages and other technical indicators, the daily buy/sell signal is Strong Buy.
How Many Times Has J&J Stock Split?
J&J has split 6 times.
How Many Employees Does J&J Have?
J&J has 138200 employees.
What is the current trading status of J&J (JNJ)?
As of Jun 27, 2026, J&J (JNJ) is trading at a price of 254.66 USD, with a previous close of 244.88 USD. The stock has fluctuated within a day range of 247.87 USD to 255.11 USD, while its 52-week range spans from 151.52 USD to 255.11 USD.
What Is J&J (JNJ) Price Target According to Analysts?
The average 12-month price target for J&J is 257.32 USD, with a high estimate of 285 USD and a low estimate of 190 USD. 15 analysts recommend buying the stock, while 1 suggest selling, leading to an overall rating of Buy. The stock has an +1.04% Upside potential.
What Is the JNJ Premarket Price?
JNJ's last pre-market stock price is 247.94 USD. The pre-market share volume is 20,720.00, and the stock has decreased by 3.06, or 1.25%.
What Is the JNJ After Hours Price?
JNJ's last after hours stock price is 254.29 USD, the stock has decreased by -0.37, or -0.15%.
Industry Spotlight
Risk Disclosure: Trading in financial instruments and/or cryptocurrencies involves high risks including the risk of losing some, or all, of your investment amount, and may not be suitable for all investors. Prices of cryptocurrencies are extremely volatile and may be affected by external factors such as financial, regulatory or political events. Trading on margin increases the financial risks.
Before deciding to trade in financial instrument or cryptocurrencies you should be fully informed of the risks and costs associated with trading the financial markets, carefully consider your investment objectives, level of experience, and risk appetite, and seek professional advice where needed.
Fusion Media would like to remind you that the data contained in this website is not necessarily real-time nor accurate. The data and prices on the website are not necessarily provided by any market or exchange, but may be provided by market makers, and so prices may not be accurate and may differ from the actual price at any given market, meaning prices are indicative and not appropriate for trading purposes. Fusion Media and any provider of the data contained in this website will not accept liability for any loss or damage as a result of your trading, or your reliance on the information contained within this website.
It is prohibited to use, store, reproduce, display, modify, transmit or distribute the data contained in this website without the explicit prior written permission of Fusion Media and/or the data provider. All intellectual property rights are reserved by the providers and/or the exchange providing the data contained in this website.
Fusion Media may be compensated by the advertisers that appear on the website, based on your interaction with the advertisements or advertisers.
© 2007-2026 - Fusion Media Limited. All Rights Reserved.