- English (UK)
- English (India)
- English (Canada)
- English (Australia)
- English (South Africa)
- English (Philippines)
- English (Nigeria)
- Deutsch
- Español (España)
- Español (México)
- Français
- Italiano
- Nederlands
- Polski
- Português (Portugal)
- Português (Brasil)
- Русский
- Türkçe
- العربية
- Ελληνικά
- Svenska
- Suomi
- עברית
- 日本語
- 한국어
- 简体中文
- 繁體中文
- Bahasa Indonesia
- Bahasa Melayu
- ไทย
- Tiếng Việt
- हिंदी

Rocket Lab Corp (RKLB)
Rocket Lab Corp stock price live, this page displays NASDAQ RKLB stock exchange data. View the RKLB premarket stock price ahead of the market session or assess the after hours quote. Monitor the latest movements within the Rocket Lab Corp real time stock price chart below.
What Is the Rocket Lab Corp Stock Price Today?
The Rocket Lab Corp stock price today is 95.120.
What Is the Stock Symbol for Rocket Lab Corp?
The stock ticker symbol for Rocket Lab Corp is RKLB.
Is RKLB the Same as $RKLB?
$RKLB is a common way to refer to the Rocket Lab Corp ticker symbol in social media, forums, and online discussions. The dollar sign is a shorthand convention used to indicate that it is a stock ticker symbol
What Stock Exchange Does Rocket Lab Corp Trade On?
Rocket Lab Corp is listed and trades on the NASDAQ stock exchange.
Is Rocket Lab Corp a Good Stock to Buy?
Determining whether Rocket Lab Corp—or any stock—is a good buy requires comprehensive analysis. To evaluate its potential, users can sign up to InvestingPro, where they can assess the current Rocket Lab Corp share price compared with the fair value and other essential metrics.
You can find more details by visiting the additional pages to view historical data, charts, latest news, analysis or visit the forum to view opinions on the RKLB quote. (ISIN: US7731211089)
Currency in USD
Fair Value
An estimate of a stock's true price based on valuation models like discounted cash flow, peer valuation multiples, and dividend discount models.
Day's Range
94.885
101.730
52 wk Range
31.780
151.000
RKLB is not included in our AI-picked strategies. See which stocks are.
Fair Value
An estimate of a stock's true price based on valuation models like discounted cash flow, peer valuation multiples, and dividend discount models.
Day's Range
94.885101.730
52 wk Range
31.780151.000
Key Statistics
Edit
Prev. Close
Open
Volume
Average Vol. (3m)
1-Year Change
Book Value / Share
Fair Value
Fair Value Upside
Market Cap
Shares Outstanding
Revenue
Net Income
EPS
EPS Growth Forecast
Next Earnings Date
N/A
(N/A)
Dividends Payment Streak
P/E Ratio
Return on Assets
Return on Equity
Gross Profit Margin
Price/Book
EBITDA
EV/EBITDA
Beta
RKLB Scorecard
Company’s Health
Assesses a company's financial position by analyzing its market value, financial ratios, industry benchmarks, and competitors.
UnlockFair Value
An estimate of a stock's true price based on valuation models like discounted cash flow, peer valuation multiples, and dividend discount models.
Unlock PriceTechnical Analysis
Strong Sell
Price Target
106.919
Upside
+12.40%
Members' Sentiments
Bearish
Bullish
ProTips
Tips that distill complex financial data into concise, actionable investment insights.
Analysts anticipate sales growth in the current year
- Form 4 Rocket Lab Corp For: 18 June
- Investing.com
- Form 4 Rocket Lab Corp For: 18 June
- Investing.com
- Rocket Lab SVP Kampani sells $9.5m in shares
- Investing.com
- 1
Technical Analysis
Summary
Strong Sell
Sell
Neutral
Buy
Strong Buy
Strong Sell
Technical Indicators
Strong Sell
Moving Averages
Strong Sell
Analyst Ratings
15 Buy
4 Hold
0 Sell
Ratings:
19 analysts
Overall Consensus
Buy
Analysts 12-Month Price Target:
Average 106.919
(+12.40% Upside)
Rocket Lab Corp SWOT Analysis
Defense Credentials | Space Development Agency contracts validate technical capabilities, providing stable revenue streams while strengthening competitive positioning against established aerospace contractors |
Price Target Spectrum | Analyst targets range from $75 to $120, reflecting divergent views on execution risks versus growth potential in commercial and national security markets |
Neutron's Promise | Medium-lift launch vehicle development marks pivotal expansion beyond Electron, targeting market segments dominated by SpaceX's Falcon 9 |
Valuation Crossroads | Rocket Lab navigates analyst debate over whether ambitious growth trajectory and vertical integration strategy justify current market valuation |
Rocket Lab Corp Earnings Call Summary for Q1/2026
- Rocket Lab reported record Q1 2026 revenue of $200.3M, up 63.5% YoY, with non-GAAP gross margins of 43% exceeding expectations.
- Total backlog surged 108% YoY to $2.2B; Space Systems segment led with $136.7M revenue, Launch Services contributed $63.7M.
- GAAP EPS loss improved to $0.07 per share from $0.09 loss in Q4 2025; GAAP gross margin reached 38.2%, above guidance.
- Q2 2026 guidance projects revenue of $225M-$240M with GAAP margins of 33%-35% and non-GAAP margins of 38%-40%.
- CEO emphasized diversified business model strength; analysts revised earnings upward amid supply chain and competitive landscape concerns.
Last Updated: 05/07/2026, 11:58 PM
Read Full TranscriptRocket Lab investor slides for Q1/2026
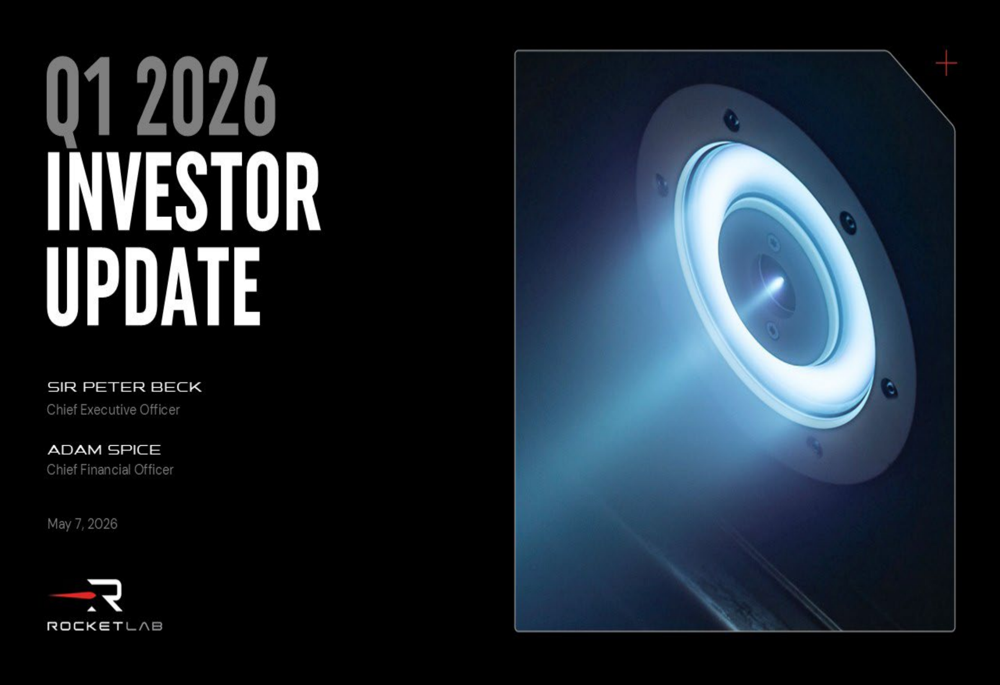
Last Update: May 08, 2026
See full investor slides
Earnings
Latest Release
May 07, 2026
EPS / Forecast
-0.07 / -0.04
Revenue / Forecast
200.35M / 174.84M
Compare RKLB to Peers and Sector
Metrics to compare | RKLB | Sector Sector - Average of metrics from a broad group of related Industrials sector companies | Relationship RelationshipRKLBPeersSector | |
|---|---|---|---|---|
P/E Ratio | −301.5x | −7.5x | 12.2x | |
PEG Ratio | −14.74 | 0.12 | 0.03 | |
Price / Book | 24.3x | 2.8x | 1.4x | |
Price / LTM Sales | 81.0x | 10.5x | 1.2x | |
Upside (Analyst Target) | 10.4% | 34.8% | 24.3% | |
Fair Value Upside | Unlock | −1.2% | 8.2% | Unlock |
Rocket Lab Corporation, a space company, provides launch services and space systems solutions in the United States, Canada, Japan, and internationally. The company operates through launch services and space systems segments. The company provides launch services, spacecraft design services, spacecraft components, spacecraft manufacturing, optical systems, and other spacecraft and on-orbit management solutions and constellation management services, as well as designs and manufactures small and medium-class rockets and develops flight and ground software. It also designs, manufactures, and sells Electron, an orbital small launch vehicle for small spacecraft launch services, as well as develops Neutron launch vehicles for large constellation deployments, interplanetary missions, and potentially for human spaceflight. In addition, the company designs and manufactures a range of components and subsystems for its launch vehicles and spacecraft. It serves commercial, aerospace prime contractors, and government customers. Rocket Lab Corporation was formerly known as Rocket Lab USA, Inc. and changed its name to Rocket Lab Corporation in August 2021. The company was founded in 2006 and is headquartered in Long Beach, California.
Ownership
Ownership Overview
Top Holders
People Also Watch
FAQ
What Is the Rocket Lab (RKLB) Stock Price Today?
The Rocket Lab stock price today is 95.120 USD.
What Stock Exchange Does Rocket Lab Trade On?
Rocket Lab is listed and trades on the Nasdaq Stock Exchange.
What Is the Stock Symbol for Rocket Lab?
The stock symbol for Rocket Lab is "RKLB."
What Is the Rocket Lab Market Cap?
As of today, Rocket Lab market cap is 58.050B USD.
What Is Rocket Lab's Earnings Per Share (TTM)?
The Rocket Lab EPS (TTM) is -0.329.
When Is the Next Rocket Lab Earnings Date?
Rocket Lab will release its next earnings report on Aug 06, 2026.
From a Technical Analysis Perspective, Is RKLB a Buy or Sell?
Based on moving averages and other technical indicators, the daily buy/sell signal is Strong Sell.
How Many Times Has Rocket Lab Stock Split?
Rocket Lab has split 0 times.
How Many Employees Does Rocket Lab Have?
Rocket Lab has 2600 employees.
What is the current trading status of Rocket Lab (RKLB)?
As of Jun 24, 2026, Rocket Lab (RKLB) is trading at a price of 95.120 USD, with a previous close of 100.290 USD. The stock has fluctuated within a day range of 94.885 USD to 101.730 USD, while its 52-week range spans from 31.780 USD to 151.000 USD.
What Is Rocket Lab (RKLB) Price Target According to Analysts?
The average 12-month price target for Rocket Lab is 106.919 USD, with a high estimate of 150 USD and a low estimate of 60 USD. 15 analysts recommend buying the stock, while 0 suggest selling, leading to an overall rating of Buy. The stock has an +12.40% Upside potential.
What Is the RKLB Premarket Price?
RKLB's last pre-market stock price is 95.940 USD. The pre-market share volume is 1,430,000.000, and the stock has decreased by -4.350, or -4.340%.
What Is the RKLB After Hours Price?
RKLB's last after hours stock price is 95.670 USD, the stock has decreased by 0.550, or 0.580%.
Industry Spotlight
Risk Disclosure: Trading in financial instruments and/or cryptocurrencies involves high risks including the risk of losing some, or all, of your investment amount, and may not be suitable for all investors. Prices of cryptocurrencies are extremely volatile and may be affected by external factors such as financial, regulatory or political events. Trading on margin increases the financial risks.
Before deciding to trade in financial instrument or cryptocurrencies you should be fully informed of the risks and costs associated with trading the financial markets, carefully consider your investment objectives, level of experience, and risk appetite, and seek professional advice where needed.
Fusion Media would like to remind you that the data contained in this website is not necessarily real-time nor accurate. The data and prices on the website are not necessarily provided by any market or exchange, but may be provided by market makers, and so prices may not be accurate and may differ from the actual price at any given market, meaning prices are indicative and not appropriate for trading purposes. Fusion Media and any provider of the data contained in this website will not accept liability for any loss or damage as a result of your trading, or your reliance on the information contained within this website.
It is prohibited to use, store, reproduce, display, modify, transmit or distribute the data contained in this website without the explicit prior written permission of Fusion Media and/or the data provider. All intellectual property rights are reserved by the providers and/or the exchange providing the data contained in this website.
Fusion Media may be compensated by the advertisers that appear on the website, based on your interaction with the advertisements or advertisers.
© 2007-2026 - Fusion Media Limited. All Rights Reserved.