by Pinchas Cohen
Key Events
- North Korean intercontinental ballistic missile (ICBM) test ignored by Asian equities and safe havens
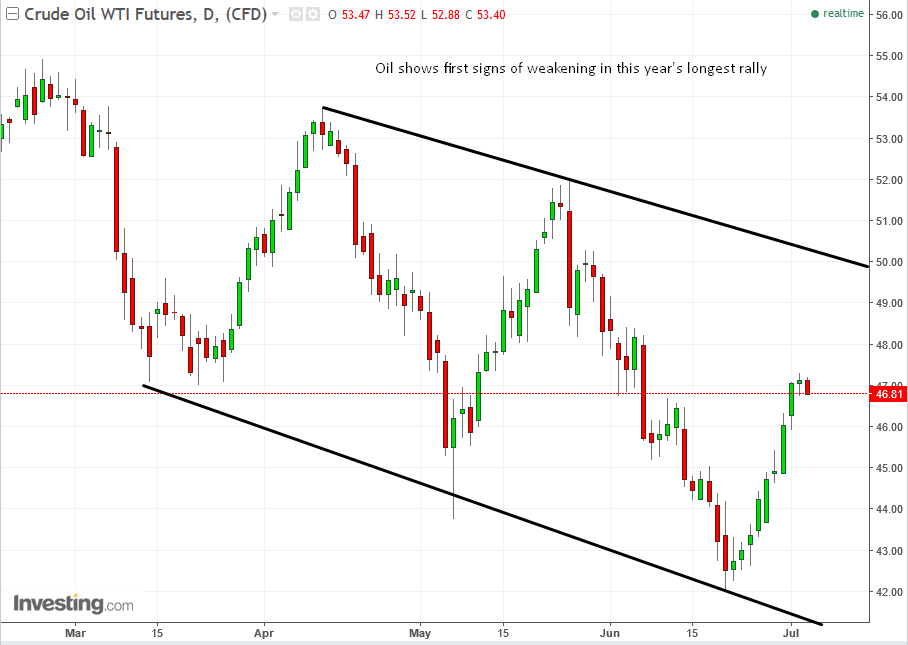
- Oil shows signs of ending correction, after strongest 9-day rally of the year
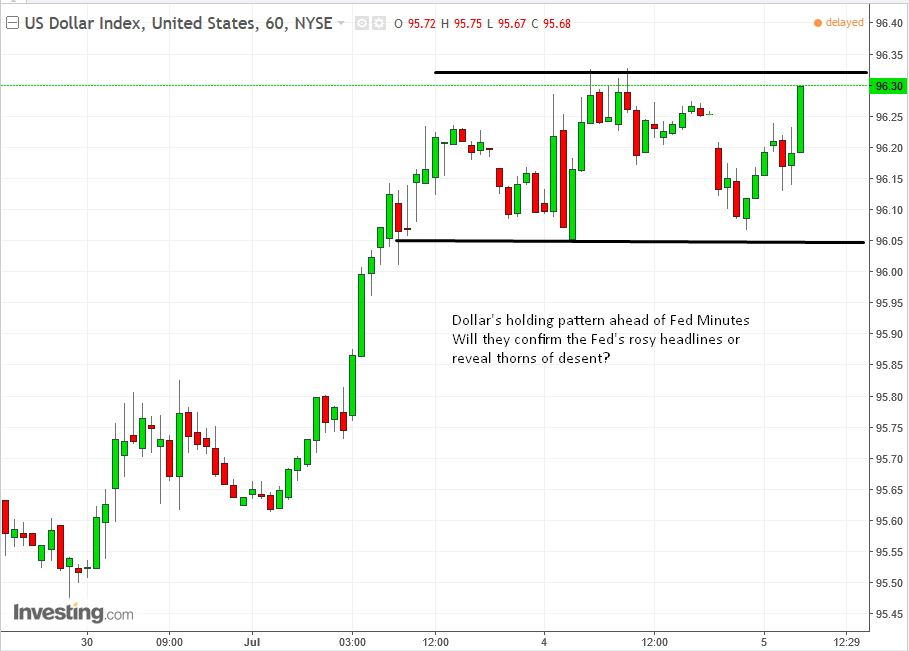
- Fed Sceptics await FOMC Minutes for deeper truth

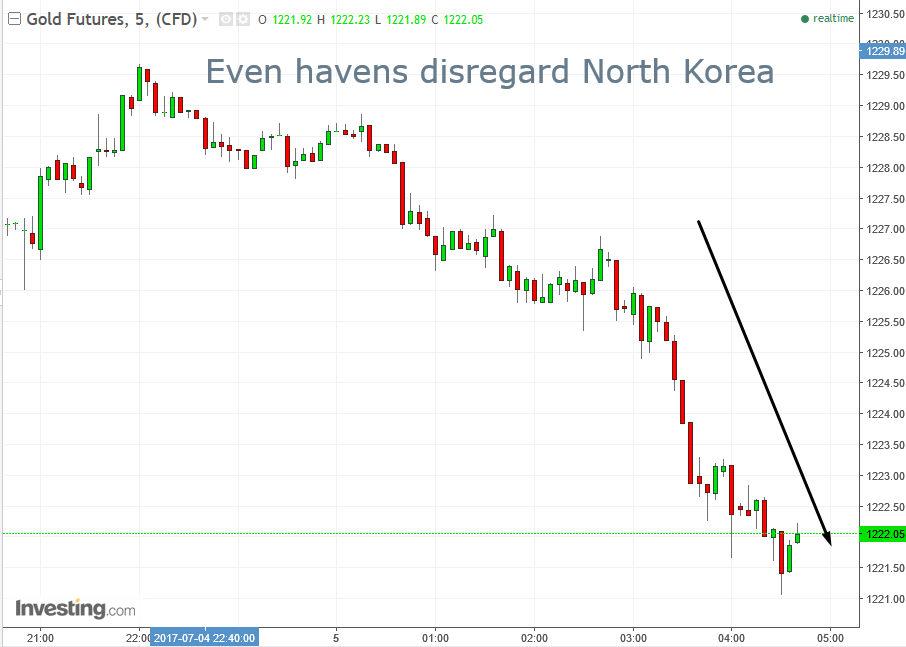
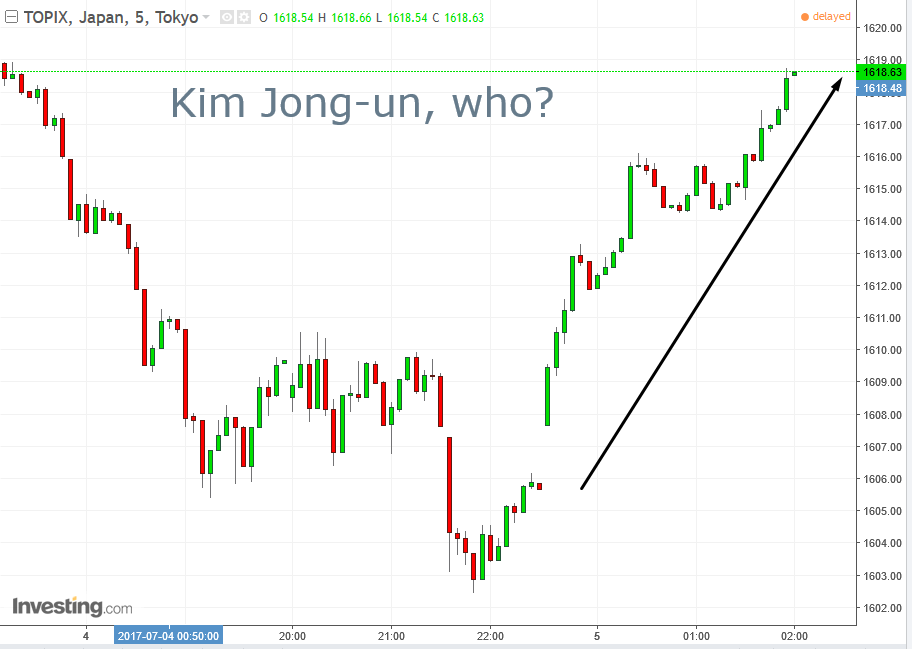
Even as investors sought the yen and gold for their safe haven status following North Korea's missile launch yesterday, Asian stocks rallied, led by automaker and tech sector gains.
Global Affairs
North Korea’s ICBM test, specifically on the US's Independence Day, was seen as an act of aggression and has led to the scheduling of an emergency session in the upcoming G-20 meeting.
The fact that shares in Japan were traded in a business as usual fashion—with its proximity to North Korea—while ignoring political risk, is another in a long series of recent examples of equity traders disregarding political risk.
Ironically, while the currency of a country exposed to risk would usually be sold off, the yen was temporarily rising because of its safe haven status, along with gold. However, both assets resumed their declines as risk appetite returned to markets.
While US equity investors were buying into the Fed’s reflationary outlook—a catalyst fueling all-time market highs—the recent momentum back into financials continues. The sector has assumed leadership on the prospect of a growing economy and its higher interest rates. Nevertheless, bond investors have been far more skeptical of the Fed's optimism. The FOMC minutes may reveal the realistic complexities of previous and additional interest rate hikes ahead of one of its primary gauges, Friday’s Nonfarm Payroll release.

Oil is in retreat, after nine straight days of gains. It should be noted that even during its longest consecutive advance of the year, there were days in which oil slid on an intraday basis but still closed higher.
Having said that, yesterday’s trading formed a doji, which often occurs before a reversal, as the trend slows. Indeed, the rally also had one of those, but still climbed sharply for another two days.
We've posted repeatedly over the past month regarding a plunge in oil, correlating our forecast with observations of a projected correction, and stipulated that at a minimum, the correction should test the moving averages.
Yesterday’s doji closed on the 50 dma (green), which also happened to be the support of the first trough of the year, which occured in March. A support which has been crossed is expected to turn into resistance, as traders remember the significance of that price level.
Additionally, a correction generally retraces 50-percent of the prior price movement. Between $52 and $42 there's a $10 difference. The correction from $42 to $47 is $5, exactly half of the prior price movement. Using this logic, the corrective objective has been met.
However, UBS analysts are expecting a 20-percent rally in the commodity by the end of the year based on overly negative sentiment and supply not being able to keep up with demand. They are also relying on the OPEC and NOPEC pledge to do “whatever it takes” to rein in production. This is odd considering OPEC shot down the Russian proposal to add another 3-month option to the existing deal. Still, the IEA monthly report states that demand overcame supply in the second quarter, and that should increase in the second half of 2017.
Up Ahead
- Economists expect the Nonfarm Payroll report will show US employers added 175,000 workers in June, as wages increased proportionately to an market favorable to employees.
- President Donald Trump is expected to meet Russian President Vladimir Putin and Chinese President Xi Jinping at the G-20 summit.
Market Moves
Stocks

- Japan’s TOPIX advanced 0.6 percent, erasing an earlier loss. Subaru (T:9632) rallied 3.7 percent and Toyota (T:7203) jumped 1.6 percent.
- South Korea’s KOSPI rose 0.3 percent, with Samsung Electronics (KS:005930) rising 1.2 percent.
- S&P 500 Futures were flat. The gauge rose 0.2 percent Monday in a shortened session before the July 4 holiday.
- Stoxx Europe 600 slipped 0.3 percent, retreating for a second day after surging 1.1 percent on Monday.
- The MSCI Asia Pacific index climbed 0.4 percent as of 8:18 a.m. in London, with tech shares contributing the most gains.
- Australia’s S&P/ASX 200 Index fell 0.4 percent after soaring 1.8 percent Tuesday, its most since November 10.
- Hong Kong’s Hang Seng climbed 0.3 percent as Geely Automobile Holdings (HK:0175) rebounded 2 percent. The Hang Seng China Enterprise Index (CEI) rose 0.6 percent.
- China's Shanghai Composite rose 0.8 percent.
Currencies

- The Dollar Index rose 0.15 percent to 96.25, retesting yesterday’s high.
- The British pound was steady at $1.2921.
- The euro added 0.2 percent to $1.1366.
- The yen was little changed at 113.26 per dollar, after climbing as much as 0.4 earlier in the day.
- The Korean won was flat.
- The Australian dollar was at 76.19 US cents, up 0.2 percent, after tumbling 0.7 percent Tuesday in the wake of the Reserve Bank of Australia’s decision to maintain a neutral policy stance.
Commodities
- Gold advanced 0.2 percent to $1,225.59 an ounce, paring an earlier gain of 0.5 percent.
- WTI crude increased 0.1 percent to $47.13 a barrel. Oil has rallied more than 10 percent after falling into a bear market last month.
Bonds
- The yield on 10-year Treasuries fell two basis points to 2.33 percent. The rate rose five basis points Monday, after surging 16 basis points last week. The market was closed Tuesday.
- Australian 10-year yields rose one basis point to 2.63 percent, after dropping five basis points in the previous session.
- UK benchmark yields advanced two basis points to 1.27 percent. French and German yields were flat.
