SPX, Dow fall for a second day
NASDAQ and Russell 2000 end seven days of straight gains
Sudden firing of Secretary of State Rex Tillerson signals resumption of tariff hardline
China's factory output and investment growth boost European miners
US rising oil supply pressures price
Allianz Global says Bitcoin's bubble will pop
Google to ban crypto ads
US retail sales and wholesale price data are out on Wednesday, and may shed more light on the health of the US economy ahead of the Fed's policy review next week.
Factory output Wednesday and inflation data Thursday are focal points in the euro area.
Also this week, Germany’s Angela Merkel officially starts her fourth term, and EU27 government officials discuss the European Union’s Brexit position.
New Zealand GDP data is out Thursday.
Russians will go to the polls on Sunday for a presidential election that Vladimir Putin is widely expected to win. Meanwhile, the UK is expected to set out retaliatory measures against Russia over a nerve agent attack within its territory.
The STOXX Europe 600 Index gained 0.1 percent as of 8:28 a.m. London time.
The UK’s FTSE 100 climbed 0.2 percent.
Germany’s DAX rose 0.2 percent.
S&P 500 Futures increased 0.3 percent.
The MSCI Asia Pacific Index fell 0.5 percent.
The Dollar Index gained 0.07 percent before heading lower.
The euro dipped 0.2 percent to $1.2369.
The British pound decreased 0.1 percent to $1.3946.
The Japanese yen fell 0.1 percent to 106.66 per dollar.
The yield on the US 10-year decreased one basis point to 2.84 percent, the lowest in almost two weeks.
Germany’s 10-year yield decreased one basis point to 0.62 percent, the lowest in seven weeks.
Britain’s 10-year yield declined two basis points to 1.487 percent.
Japan’s 10-year yield fell less than one basis point to 0.05 percent
Key Events
US stocks fell yesterday, extending a decline for the S&P 500 and Dow Jones Industrial Average to a second day.
Despite inflation data confirming the likelihood of a slower path to higher interest rates than recently feared, political headwinds pulled the rug from under the feet of investors, and fears of rapidly increasing US oil supplies pulled down the energy sector. US President Donald Trump fired another senior official—Secretary of State Rex Tillerson— while fresh plans for broader trade tariff measures signaled Trump's determination to keep marching down the path toward a trade war.
The S&P 500 fell 0.64 percent, for a total loss over the 2-day period of 0.75 percent. Technology (-1.15%) led the declines, dragged down by a 5.9 plunge in Qualcomm (NASDAQ:QCOM) shares following Trump's executive order to block Broadcom's (NASDAQ:AVGO) $117 billion hostile takeover of the the US-based chip maker.
The second worst performing sector was Financials (-1.08%), after news broke that CPI rose 0.2 percent, in line with estimates though it was the weakest result in years, according to Bloomberg. The sluggish reading eased worries of faster interest rate tightening, which last month triggered a stock selloff. For banks, however, lower rates—which drive profits via rates on loans—signal a reduced profit outlook ahead.
The third sector to pull down the the SPX was Energy (-0.7%), after API reported that US crude stockpiles increased by 1.16 million barrels.
The only three sectors in the green were Real Estate (+0.32%), followed by Utilities (+0.22 percent) and Health Care (+0.12%).
The Dow dropped 0.67 percent, bringing its two day slide to 1.28 percent.
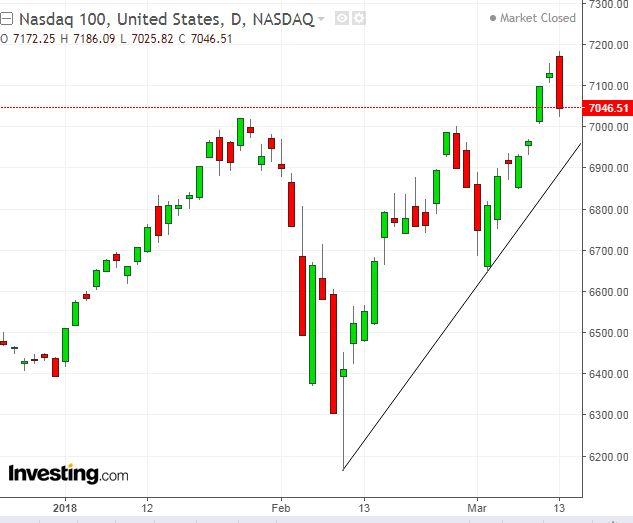
The NASDAQ Composite tumbled by almost one percent and the NASDAQ 100 slipped 1.15 percent on the White House's squelching of Broadcom's Qualcomm bid. It was the first setback for the tech indices after a 7-day winning streak for both; the pair even posted fresh record highs before each closed lower albeit both managed to remain above their January and February peaks. As well, technicals formed bearish Dark Cloud Covers, something that occurs when prices open higher than the previous rising candle but close beneath it.
Previous peaks which had been overcome presumably provided support. After their former resistance was penetrated on Thursday, traders shorting the indices were stopped out, on the presumed repeat of the two previous selloffs from these levels. Bears scurried to cover shorts by buying back stocks, to return them to the broker.
This naturally further increases demand. The higher it goes, the more traders want to hop on for the ride, pushing prices even higher. On the other hand, two relatively flat peaks, followed by a higher peak, may develop into a H&S top. One test is whether prices will remain above the uptrend line since February 9, when stocks bottomed after the first selloff, provoked by fears of higher interest rates and Treasury yields surging to a 4-year high.
The Russell 2000 lost 0.5 percent. It outperformed its peers thanks to the fact that the small, domestic firms listed on the index are not reliant on exports for profit growth. The current equity selloff has been sparked by fears of a looming trade war, after Trump announced his intentions to impose harsh tariffs on steel and aluminum imports on March 1. The more a company relies on exports, the worse it has performed as trade war jitters mount.
Last year, for example, Caterpillar (NYSE:CAT) sold more than half of its products overseas. Perhaps this is why the stock lost up to 15 percent of its value by February 5, despite January corporate results that smashed expectations, and was nearly 9 percent down by yesterday's close.
Tillerson's dismissal not only added to the instability sparked by the high turnover among senior White House administrative staffers, it also took place at a time that is more significant than it may at first seem. Coming immediately after Trump blocked Broadcom's bid and just as his administration gears up for a trade war, what at first seemed to be an out-of-the-blue replacement of such a senior position can hardly be viewed as a coincidence.
This is reinforced by the fact that Gary Cohn, Trump's chief economic advisor, stepped down last week because of the same issue. The new Secretary of State will be CIA director Mike Pompeo, who shares the president's hawkish views.
Global Financial Affairs
Today, Asian benchmarks slumped across the board, with Japan's TOPIX, China's mainland Shanghai Composite, Hong Kong's Hang Seng Index, Australia's S&P/ASX 200 and South Korea's KOSPI all affected by soaring trade war fears.
Ironically, after factory output and investment unexpectedly accelerated in China—the largest commodities consumer globally—the STOXX Europe 600 ticked higher, with raw material producers outperforming.
However, China's clamp-down on financial risks along with escalating signs of a trade war are likely to overshadow any economic improvement, for the time being. Perhaps the Fed, led by a new Chair, can reinvigorate a sense of stability for investors when its monetary policy is reviewed next week.
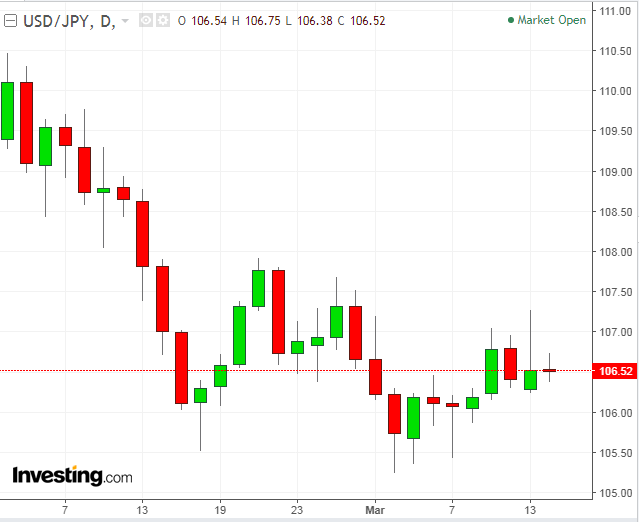
The dollar is unable to maintain gains against the yen, even as political pressure increases in Japan.
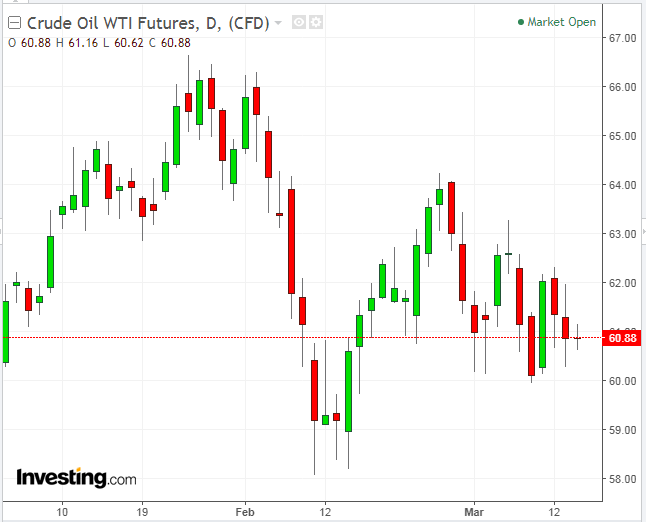
WTI has struggled to recoup losses from last month’s broader market slump, after topping $66 a barrel in January. While a brighter economic outlook has underpinned demand expectations, expanding American production remains a challenge for OPEC and its allies. The cartel is trying to prop up prices via output curbs.
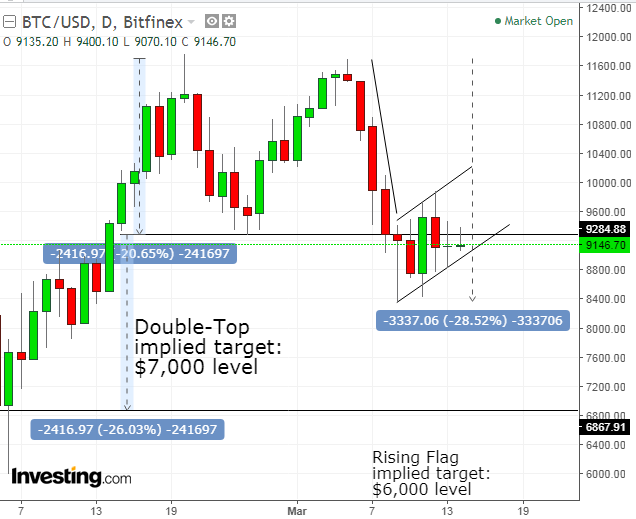
Analysts from Allianz Global said Bitcoin is worthless and its bubble will soon pop. Meanwhile, Google announced that it plans to ban all cryptocurrency-related ads, following in the footsteps of Facebook). Technically, BTC is poised to complete two bearish patterns: a Double-Top and a Falling Flag.
Up Ahead
Market Moves
Stocks
Currencies
Bonds
Commodities


