Gold, silver prices hit record highs as US-Iran tensions drive haven demand
by Pinchas Cohen
The Week That Was
US Stock Market: The Bullish Case
- Earnings Support Rallies
Underlying this policy and liquidity driven markets, Fundamentals are apparently driving this rally. All-time highs in earnings in line with S&P 500. First quarter earnings came in much stronger than expected. Heading into the second quarter, expectations weren’t as high. Forecasts had expected 8-percent growth—80-percent of the 20-percent that has been reported so far have beaten expectations— but earnings are tracking nearly 10-percent. However, that is partly due to the base effect of the energy sector recovering last year. On the other hand, if the energy sector is removed, Q2 results are mid-single digits and more modest than the first quarter.
However, that is partly due to the base effect of energy recovering from last year. When removing energy, however, Q2 results are softer, in the mid-single digits and more modest than the first quarter.
For the technology sector, even though a lot of the upside has been driven by mega caps, the sector as a whole is enjoying a wide breadth of strength. Even on an equal weighted basis—in which small companies are given equal weighting with large companies—it is growing more than 20-percent
US Stock Market: The Bearish Case
- Largest US Outflows Since 2009
- Global Markets Have Lower Multiples
While the S&P 500 index closed at a second, consecutive weekly record, within a third consecutive gain, capital outflows have been increasing. The SPDR 500 Trust (NYSE:SPY), the biggest exchange traded fund tracking the US equity benchmark, shrank by $3.8 billion in July, on pace for its fourth consecutive monthly outflow, and the longest streak since the start of our current bull rally, which began in 2009.
SPY isn’t the only fund that's thinning. US mutual funds and ETFs in the week ending July 12, have lost $2.1 billion. Contrast that with $5.1 billion that went into global funds. The US market is at its most underweight since 2008.
As stated above, strong earnings growth kept price-to-earnings multiples below the March peak, even as prices soared. While this in itself may be considered bullish, as earnings support the prices, US multiples are much higher than European multiples. German and French shares trade at trailing P/E as low as 18.9; Japanese shares are as low as 19.2; and emerging-market equities tracked by MSCI Inc. trade at 16.1. Finally, the MSCI World Index ex-US trades at 19.7. Compare all of them with the S&P 500’s expensive 21.6 P/E.
US Market: Technical Perspective
The leadership among this string of records is tech. Both the NASDAQ Composite and the NASDAQ Tech formed confirmed hanging men. A hanging man occurs when a stock or index dips but manages to close near its open, at the top of the range.That particular recovery is considered bullish, and resembles a hammer pattern, which follows a decline. However, a following session with a lower close seals the bearish sentiment, a correction after a rally.
The background psychology is that traders who were rewarded by going long find themselves in losing positions with the lower close. They exit their positions, pushing the price further down. When prices begin to slip after a meaningful rally—The NASDAQ Composite advanced 5 percent and the NASDAQ Tech 100 advanced 7.35 percent, since July 6—investors get nervous and begin unloading their shares.
This starts a snowball effect into a selloff. The hammer’s location on the NASDAQ 100 Technology is telling. It formed as the rally was nearing its June 9 all-time high.
European Strength And The End To ECB QE
The key takeaway from ECB President Draghi’s remarks last week: while the eurozone’s economy has vastly improved, the ECB is not yet ready to end QE.
Let’s take a step back for context. Three weeks ago, Draghi spoke of the eurozone’s economic strength, path to inflation and how, as the recovery progresses, extreme monetary stimulus may be unnecessary. This hawkish message caused a mini taper tantrum – a spike in bond yields and the euro. His goal this past week was therefore not to rattle the markets again and add some nuance to his previous statements.
With regards to growth, while he’s proud of the economic recovery, he acknowledges its due to, and therefore still dependent upon, easing monetary policy. Additionally, no matter how robust the growth may be, it has yet to lead inflation up – the buttress to a growing economy. Therefore, the ECB will keep its monetary policy loose for the time being, until the economy can show that it is able to ride without QE 'training-wheels' and is strong enough to go uphill on rising rates.
Emerging Markets At 25-Percent Discount
China’s real GDP growth recorded a 6.9 percent growth for the second quarter YoY. This read demonstrated both an economic durability, as well as beating expectations. Retail sale, industrial production and investments demonstrated the same – all steady and coming in above expectations. China has been demonstrating resilience, despite increasing regulations, which scared investment away. That's a very bullish statement for the world's second largest economy.
Plus, it isn’t good news just for China; it's the key driver for emerging markets growth. This economic strength, even while emerging markets’ valuations are at a 25-percent discount relative to US equities, with a 16.1 per MSCI compared to the 21.6 of the US.
Oil has been rallying on falling stockpiles but fell 2.5 percent, below $46, after a report of rising OPEC oil output. While the US oil rig count fell by 1 rig to 764, bullish for oil, OPEC’s July oil supply was set to rise by 145,000 barrels per day MoM, which is bearish.
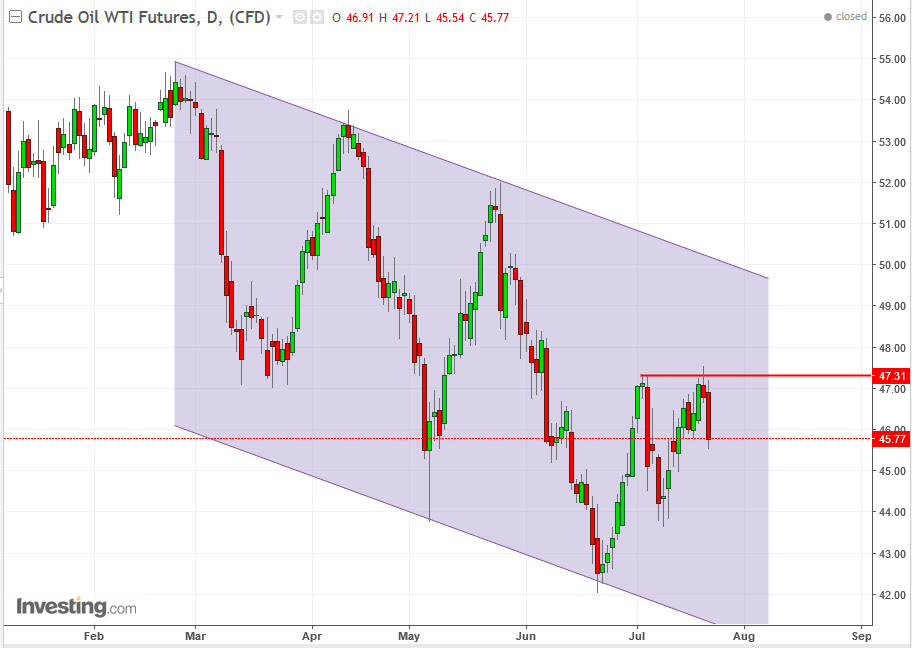
Technically, it fell hard by the resistance of the previous, July peak at the same price level.
Gold advanced, crossing over its 50 dma, for the first time since June 15, as the dollar fell 0.20 percent Friday, closing a weekly loss of 0.33 percent - after Draghi mentioned the unmentionable: he will actually discuss monetary policy tightening in September.
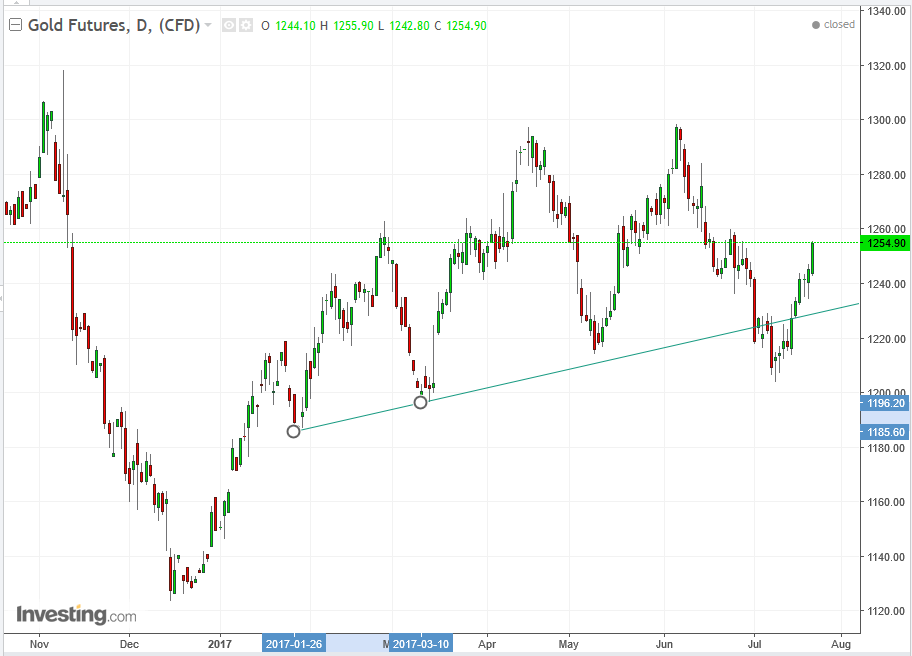
Technically, gold is catapulting upon the double-top failure, turning it into a bullish consolidation pattern, with an aim back toward $1,300 levels.
The Week Ahead
All times are EDT
- US Investors focus on the Fed’s interests rate decision and first estimate of GDP growth for Q2.
- Japan unemployment, inflation and retail sales
- Australia inflation
- UK, France and Spain GDP figures for Q2
- Saudi Arabia aims to limit exports to US, in order to curtail stockpiles.
SUNDAY
20:30: Japan - Manufacturing PMI (July, flash): forecast to fall to 51.9 from 52.4, after ten straight months of expansion. Markets to watch: Nikkei and TOPIX, USD/JPY and JPY crosses
Japan’s biggest manufacturer, Toyota (T:6201) and (NYSE:TM), completed a double-bottom – on high volume - on July 12. Volume has dried up on the return move, supporting the case for a new uptrend. Allow for the potential of a complete return move and for the MACD and RSI to temper their oversold read.
The USDJPY has been trading within a symmetrical triangle, presumed to be a continuation pattern, as both supply and demand are equally passionate within the main downtrend. This is on top of its failed H&S bottom, on the Fed’s slower inflation path and Trump’s further step back from his economic agenda – both themes which have caused the dollar to bottom, but turned upside down. A failed reversal becomes a continuous consolidation. That jibes with the symmetrical triangle’s psychology
MONDAY
3:00 – 4:00: French, German, Eurozone - Manufacturing and Services PMIs (July, flash): these have seen steady overall growth over the past few months, but are forecast to see a slightly more mixed picture this time around.
3:00: France – Manufacturing PMI, expected to slightly decline from 56.9 to 56.7, while being in an uptrend since 2013’s low 40’s – while ranging from early 2014 till mid-2016.
3:00: France – Services PMI, expected to slightly decline from 56.9 to 56.7, while being in an uptrend since 2013’s low 40’s – while ranging from mid-2015 till mid-2016.
3:30: Germany – Manufacturing PMI, expected to slightly decline from 59.6 to 59.2, while being in an uptrend since 2009’s low 30’s, and nearing its low 60’s 2010 peak.
3:30 - Germany – Services PMI, expected to rise from 54.0 to 54.3; the gauge has been ranging since 2011, as services is not Germany’s strong suit. Keep this in mind with regards to banks seeking a European hub outside of a post-Brexit UK, in the race between Frankfurt and Paris to become their new home for EU financials.
Markets to watch: STOXX 600, Euro Stoxx 50, DAX, CAC 40, EUR crosses
The euro has broken out of a 2-year bottom base week before last, and solidified this breakout last week. Its next resistance July 23 2012’s 1.20140 low.
9:45: US - Manufacturing PMI (July, flash): expected to rise to 52.3 from 52. Markets to watch: Dow Jones, S&P 500, NASDAQ, USD crosses
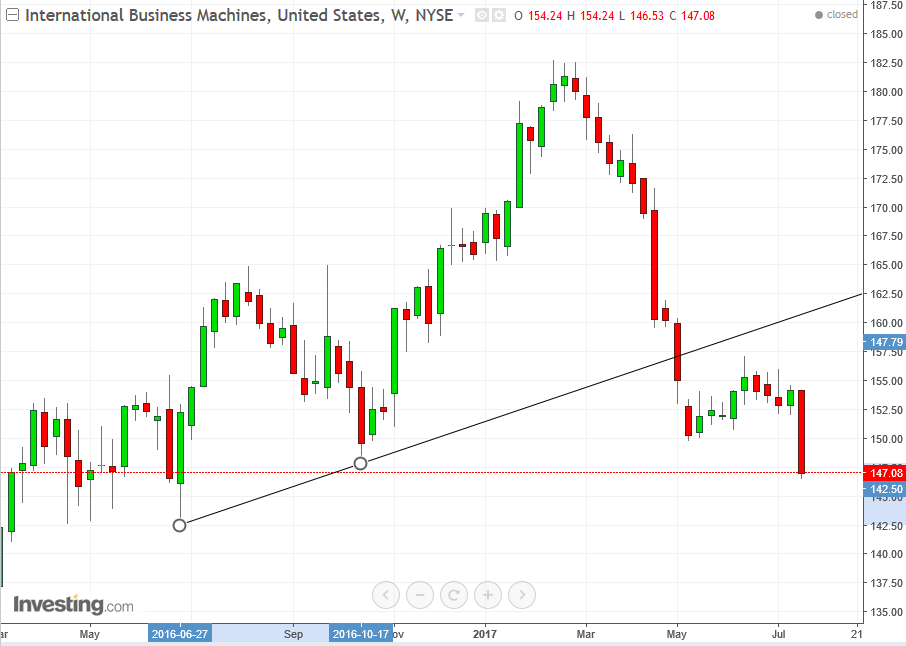
The stock of America’s biggest manufacturer IBM (NYSE:IBM) dropped after 21 consecutive revenue declines, ending a return move to its broken uptrend line since June.
10:00: US - Existing Home Sales (June): forecast to rise to an annual rate of 5.64 million from 5.62 million. Markets to watch: US indices, USD crosses
EARNINGS
Alphabet (NASDAQ:GOOGL) is scheduled to report earnings after the market close, for the fiscal quarter ending June 2017. Consensus EPS for the internet giant is $8.2, vs $7 YoY on Revenue of $20.83B for the quarter.
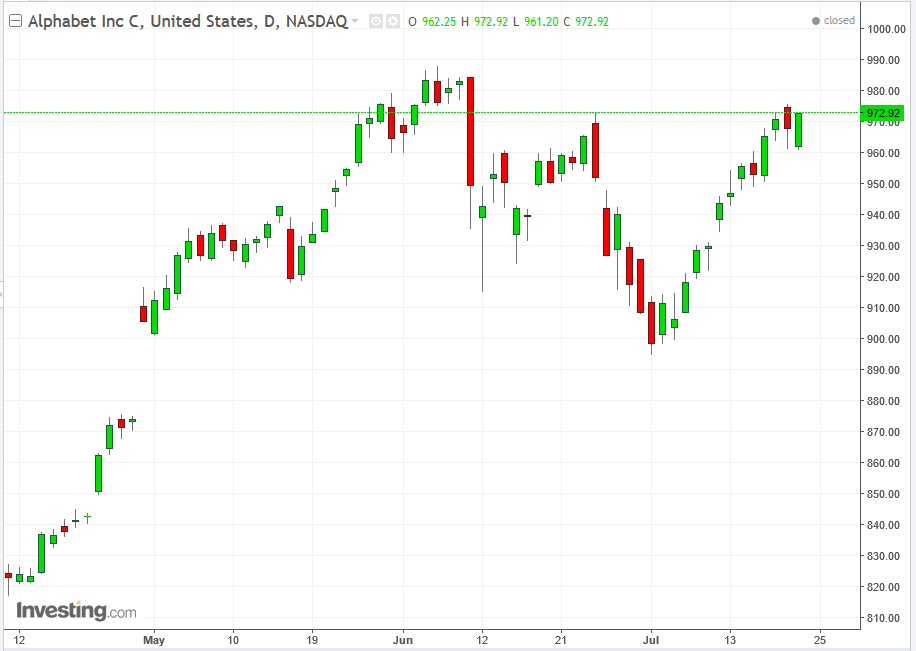
On Thursday, the stock got stuck under the resistance of the June 26 peak. On Friday it climbed back toward the high of the day, but failed to surpass it. This invites a risk-reward attractive ratio for a short. Unless earnings won’t blow the stock past their June 6 peak, it would provide a top implication.
Tuesday
4:00: Germany - IFO Business Climate (July): index expected to rise to 115.6 from 115.1. Markets to watch: Stoxx 600, Stoxx 50, Dax, EUR crosses
10:00: US - Conference Board Consumer Confidence (July): previous reading 118.9. Markets to watch: S&P 500, Dow Jones, NASDAQ, USD crosses, especially against the yen
21:30: Australia - CPI (Q2): YoY rate forecast to decline from 2.1% to 2%, while QoQ holds steady at 0.5%. Market to watch: AUD/USD and additional AUD crosses
EARNINGS
Caterpillar (NYSE:CAT) is expected to report earnings before market open, for the fiscal quarter ending June 2017. Consensus forecasts for the construction and mining equipment manufacturer's Q2 2017 is for EPS of $1.26, versus $1.09 YoY on $10.95B in Revenue for the quarter.
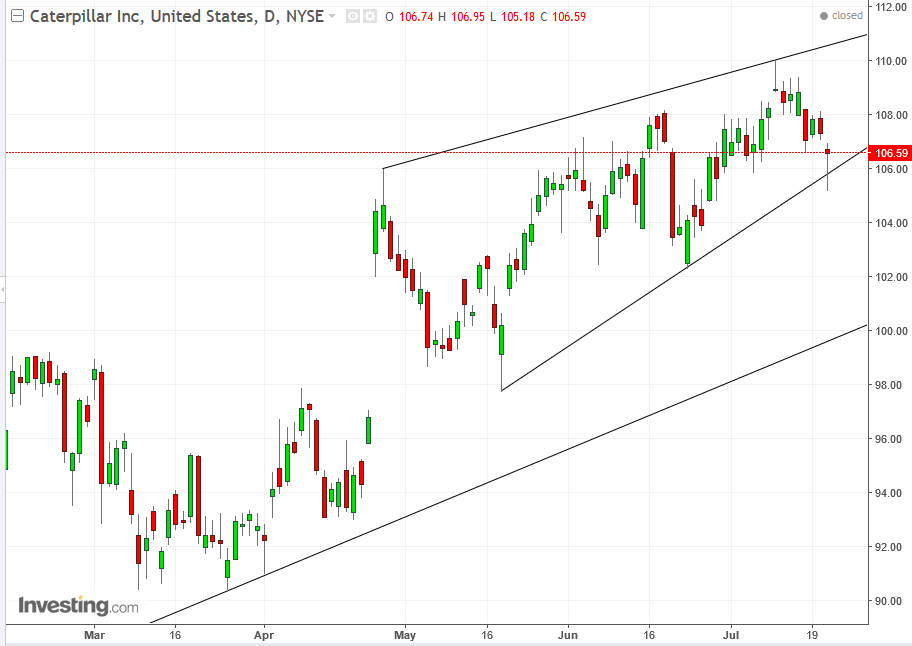
While Caterpillar stock has been trading within an uptrend since January 20, 2016, it has been trading within a bearish rising wedge since April 2015. The price has been congested within an upward bias, getting more congested as it rises. Now, the supply-demand balance is stuck within the $110 July 12 shooting star and Friday’s $105 hammer low. Prices are expected to return to the uptrend, currently at $100.
General Motors (NYSE:GM) is scheduled to report Q2 '17 earnings before market open, for the fiscal quarter ending June 2017. Consensus EPS forecast for the auto manufacturer for the quarter is $1.72, versus $1.86 YoY on $40.25B in Revenue for the quarter.
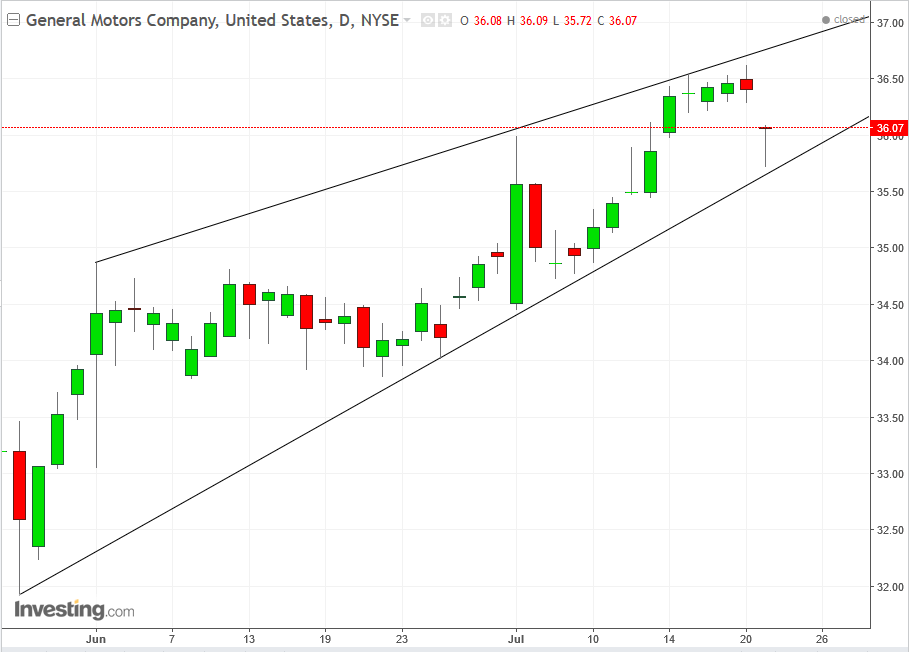
Like Caterpillar, GM has been trading within a bearish rising wedge since May 25, and like CAT, on Friday it formed a hammer on the bottom of the narrowing wedge.
JetBlue Airways (NASDAQ:JBLU) is scheduled to report Q2 earnings before market open, for the fiscal quarter ending June 2017. Consensus EPS forecasts $0.55 versus $0.53 YoY on Revenue of $1.81B for the quarter.
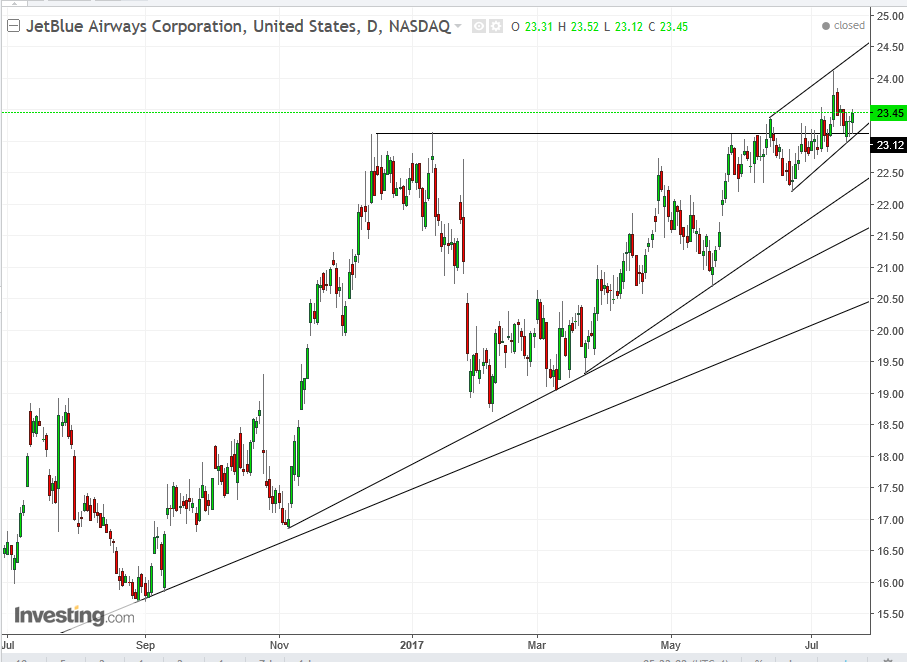
JetBlue has been trading in an uptrend since June 27. On July 13 it decisively crossed over the January $23.15, where it was stuck for nearly a month, signaling a resumption of the uptrend.
McDonald’s (NYSE:MCD) is scheduled to report Q2 earnings before market open, for the fiscal quarter ending June 2017. Consensus EPS forecast for fast food restaurant owner and franchiser for the quarter is $1.63, versus $1.45 YoY on $5.97B in Revenue for the quarter.
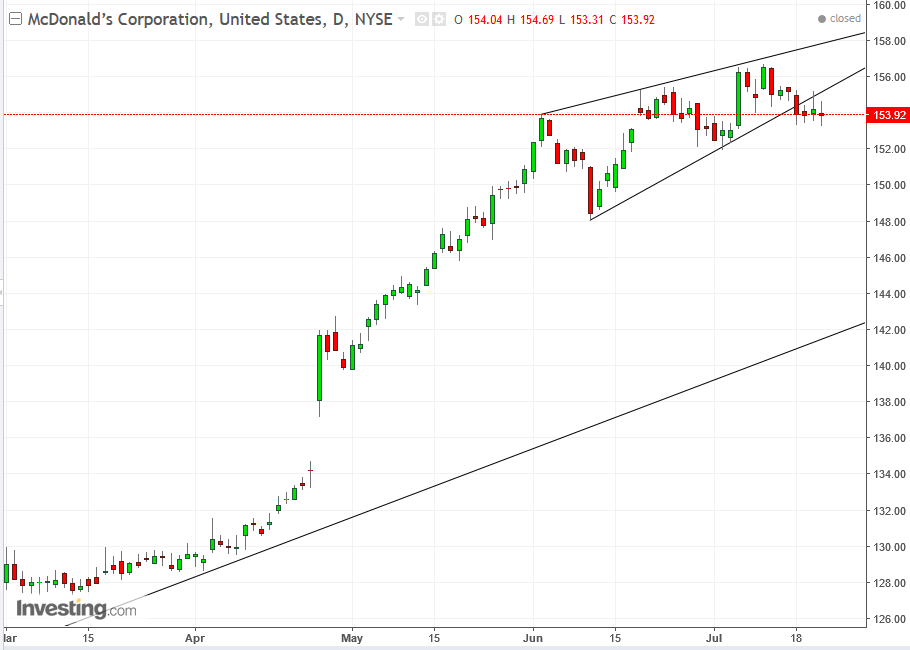
The stock fell out of its rising wedge on June 18, suggesting a correction toward its November 4 uptrend line, currently at $143.
Mobileye (NYSE:MBLY) is scheduled to report Q2 2017 earnings before the market opens. Consensus expectations are calling for EPS of $0.18 vs $0.11 YoY on $122.82M in Revenue for the quarter.
Wednesday
4:30; UK - GDP growth (Q2, preliminary): growth expected to be 1.8% YoY and 0.4% QoQ, with the latter an improvement over the 0.2% of Q1. Markets to watch: FTSE 100, GBP/USD and other GBP crosses
9:45: US - Markit Services PMI (July, flash): expected to fall to 53.1 from 54.2. Markets to watch: S&P 500, Dow Jones, NASDAQ, USD crosses, especially against the yen.
10:00: US - New Home Sales (June): expected to fall to an annual rate of 580K from 610K. Markets to watch: S&P 500, Dow Jones, NASDAQ, USD crosses
10:30: US - EIA crude inventories (w/e 21 July): expected to see a 1 million barrel drop, after a fall of 4.7 million a week earlier. Markets to watch: Brent, WTI
2:00PM: Fed Rate Decision: no change in policy expected, but the statement may provide more clues about the path of tightening later in the year. Markets to watch: S&P 500, Dow Jones, NASDAQ, USD crosses, especially against the yen and euro
EARNINGS
Boeing (NYSE:BA) is scheduled to report Q2 earnings before market open, for the fiscal quarter ending June 2017. Consensus EPS forecast for the aeronautics behemoth for the quarter is $2.32 on $22.97B in Revenue.
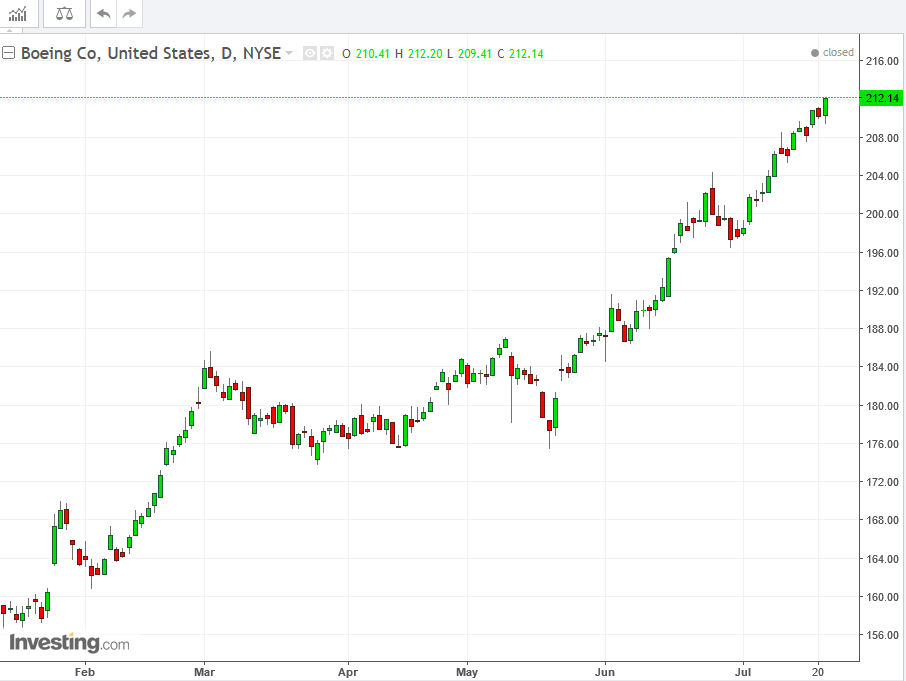
The stock is heading straight up, on a string of all-time highs.
Coca-Cola (NYSE:KO) is expected to report Q2 earnings before market open, for the fiscal quarter ending June 2017. Consensus EPS forecast for the global beverage manufacturer for this quarter is $0.57 versus $0.6 YoY on $9.75B in Revenue for the quarter.
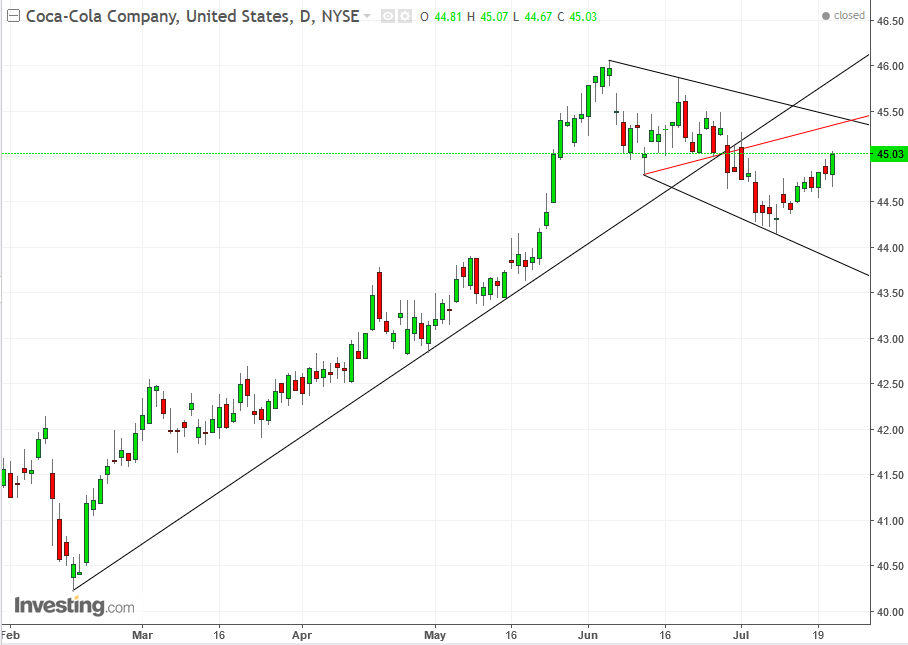
The stock fell out of its February uptrend line on June 29. After nearing $44 on July 11 it had started a return move, which appears to be toward the top of a new falling channel.
Ford Motor Company (NYSE:F) is scheduled to report Q2 earnings before the market open, for the fiscal quarter ending June 2017. Consensus EPS for the American auto manufacturer is forecast to be $0.45 versus $0.52 YoY on $37.95B in Revenue for the quarter.
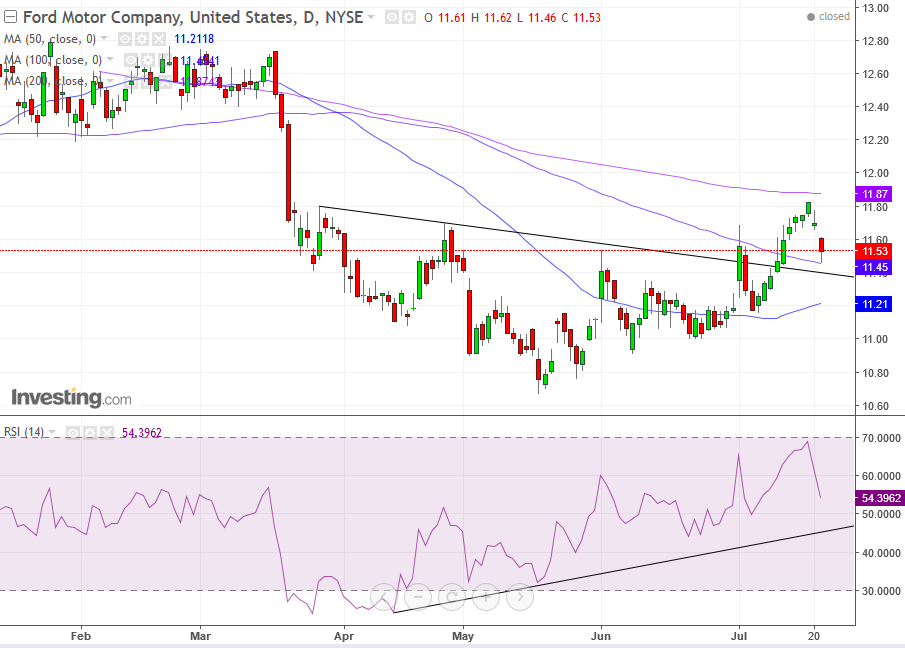
After down-trending since July 2017, the stock seems to have completed a Rounding Bottom. It is difficult to determine an absolute reversal line, as it is a rounded pattern. However, the price crossing over the 50 dma and 100 dma, on a rising RSI supports the case for a breakout. The price found resistance with the 200 dma and has corrected down, where it found support with the 100 dma.
Hershey Company (NYSE:HSY) is scheduled to report Q2 earnings before the market open. Consensus forecasts for the chocolate and candy manufacturer is $0.91 EPS versus $0.85 YoY on #1.65B in Revenue for the quarter.
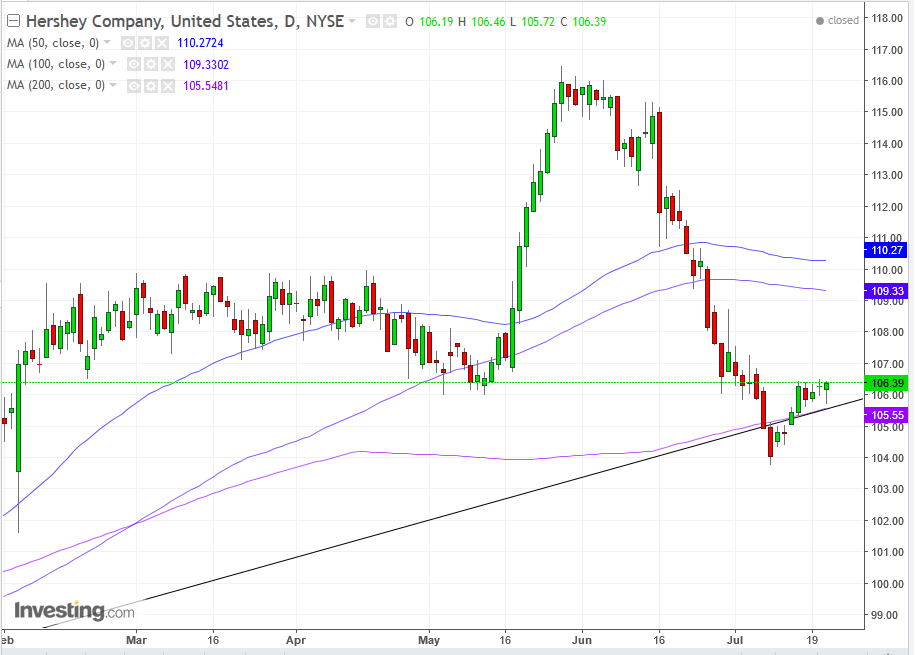
While the stock has been trending up since late January, its May peak failed to overcome the July 2016 peak. On top of that, the price fell below its uptrend line and the 50 dma on July 11. While it managed to climb back up above the trendline and 50 dma, it is still below the 100 and 200 dma. It has also failed to climb above its July 17 peak for 5 sessions. The chart looks bearish.
PayPal Holdings (NASDAQ:PYPL) is scheduled to report Q2 earnings after market close. Consensus expectations for the digital and mobile payment platform is forecast to be EPS of $0.32 versus $0.3 YoY on $3.10B Revenue for the quarter.
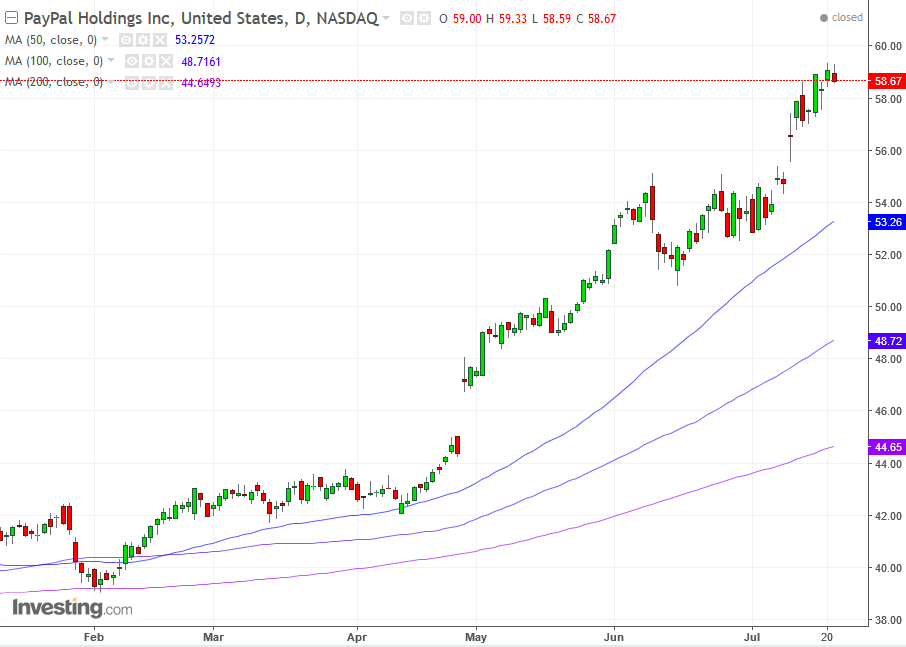
The stock is at the top of its congestion since July 13. This suggests that while investors are holding on to the stock, they’re afraid to take it higher, at least not before they see the numbers. All things being equal, the price is against its resistance and has a downward bias toward $56.
Whole Foods Market (NASDAQ:WFM) is scheduled to report Q3 2017 earnings after the market close. The consensus expectation for the natural and organic supermarket chain is for EPS of $0.34 versus $0.37 YoY on $3.72B in Revenue for the quarter.
On June 16 the price gapped up 9.25%, after Amazon (NASDAQ:AMZN) acquired Whole Foods for $42 per share in an all-cash deal valued at $13.7b, including its debt. That’s a statement of faith in the subsector and in a bricks-and-mortar retailer by one of the biggest e-tailers and companies on the planet.
Thursday
2:00: Germany - GfK Consumer Confidence (August): expected to hold at 10.6. Markets to watch: Stoxx 600, Stoxx 50, Dax, EUR crosses
8:30: US - Durable Goods Orders, Chicago Fed index (June), Initial Jobless Claims (w/e 22 July): durable goods orders expected to rise 0.4% MoM from a 1.1% fall, while excluding transport forecast to fall 0.1% from a 0.1% increase. Chicago Fed index forecast to rise to 0.13 from -0.26, and jobless claims forecast to be 246K from 233K a week earlier. Markets to watch: S&P 500, Dow Jones, NASDAQ, USD crosses, especially against yen and euro
19:30: Japan: CPI, Unemployment Rate (June): CPI expected to be 0.3% YoY and 0% MoM, from 0.4% and 0% respectively, while unemployment falls to 3%. Markets to watch: Nikkei, JPY crosses
EARNINGS
Amazon (NASDAQ:AMZN) is scheduled to report Q2 2017 earnings after the market close. Consensus expectations for the the retail/e-tail giant is for EPS of $1.38, versus $1.78 YoY on $37.20B in Revenue for the quarter.
The stock has been trading within an ascending triangle since June 6, which broke out on July 18. The upward bias of the pattern suggests that buyers are more eager than sellers, and the upward breakout confirms it. The stock completed a return move, dipped below the top of the pattern and closed well above it. This is a bullish sign.
Deutsche Bank (DE:DBKGn) (DB) is scheduled to report Q2 2017 earnings after market close. The EPS forecast is $0.38 versus $0.43 QoQ.
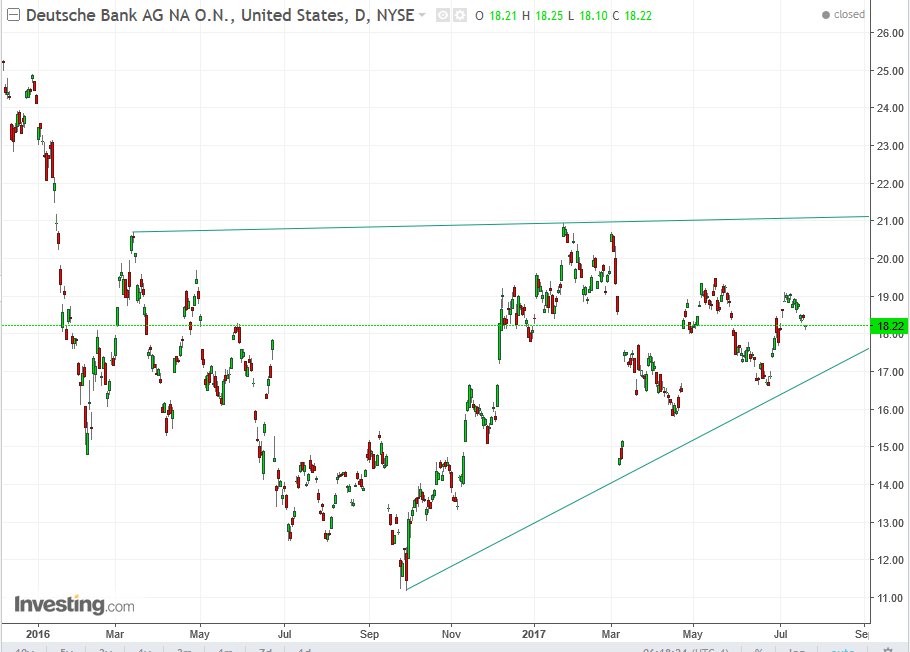
The stock bottomed above $11 at the end of September, after the DoD threatened it with an unprecedented $18B fine. Since then, the stock has been climbing. Should this uptrend resume, it may complete a massive bottom, upon an upside break of the $21 level, with a $10 move implication.
Germany's biggest manufacturer Volkswagen AG (DE:VOWG_p) also reports earnings on Thursday.
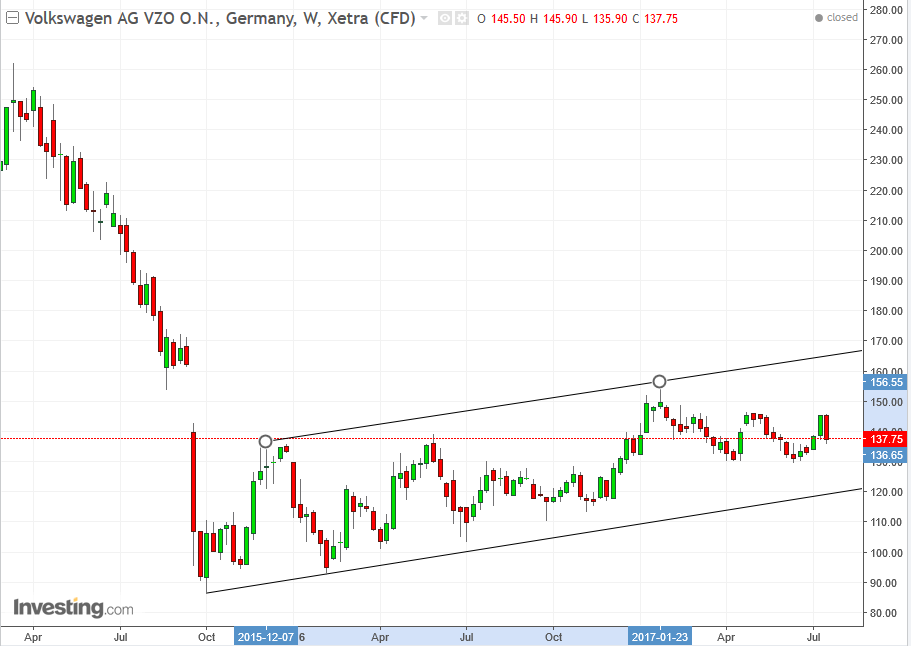
The stock has been trading within a rising channel since October 2015 and has been ranging all year. An upside breakout above €147.00 would imply a continued rising trend.
Friday
5:00: Eurozone - Business Confidence (July): expected to remain at 1.15. Market to watch: EUR crosses
8:00: Germany: - CPI (July, preliminary): forecast to be 9% YoY, in line with June. Market to watch: EUR crosses
8:30: US - GDP (Q2, preliminary): forecast to be 1.7% QoQ from 1.4%. Markets to watch: S&P 500, Dow Jones, NASDAQ, USD crosses
10:00: US - Michigan Confidence Index (July, final): expected to be 95 from 95.1. Markets to watch: S&P 500, Dow Jones, NASDAQ, USD crosses, especially against yen and euro
