by Pinchas Cohen
Key Events
- S&P 500 eyes 2,500; Dow Jones moves back over 22,000
- Even South Korea and Japanese traders turn risk-on
- The Stoxx Europe 600 Index gained for a fifth day
- The dollar revived after swooning for more than a week
- WTI crude jumped yesterday 3.4 percent, allowing for a better short
- Financials are the biggest gainers on Irma’s less-than-expected damage
- How long can the party continue when inflation doesn’t show up?
Global Affairs
Investors are pulling out all the stops. This morning, Asian stocks extended yesterday’s rally, after the S&P 500 Index jumped the most since April, to a record close, at 2488.11. The record high for the benchmark index, however, still belongs to its intraday position at 2490.87, made on August 8. The SPX is now eyeing the key psychological 2,500 level.
Similarly, the Dow Jones Industrial Average, which broke through its own key level of 22,000 on August 2, has now climbed back above that notable mark, though it didn't hit any fresh records yesterday.
Equities in South Korea, which shares a border with North Korea, as well as stocks in Australia climbed. In addition, shares in Japan—whose airspace was invaded by by Pyongyang's ballistic missile—added to yesterday’s biggest rally in three months.
European stocks are on their longest winning streak in five months, after the S&P 500 led global equities to a record high on Monday. The STOXX Europe 600 Index gained for a fifth day, its longest run since April, led by the technology sector, ahead of Apple’s (NASDAQ:AAPL) much anticipated iPhone 8 unveiling later today. Chip makers STMicroelectronics (PA:STM) and Infineon Technologies AG (DE:IFXGn) were among the biggest gainers.
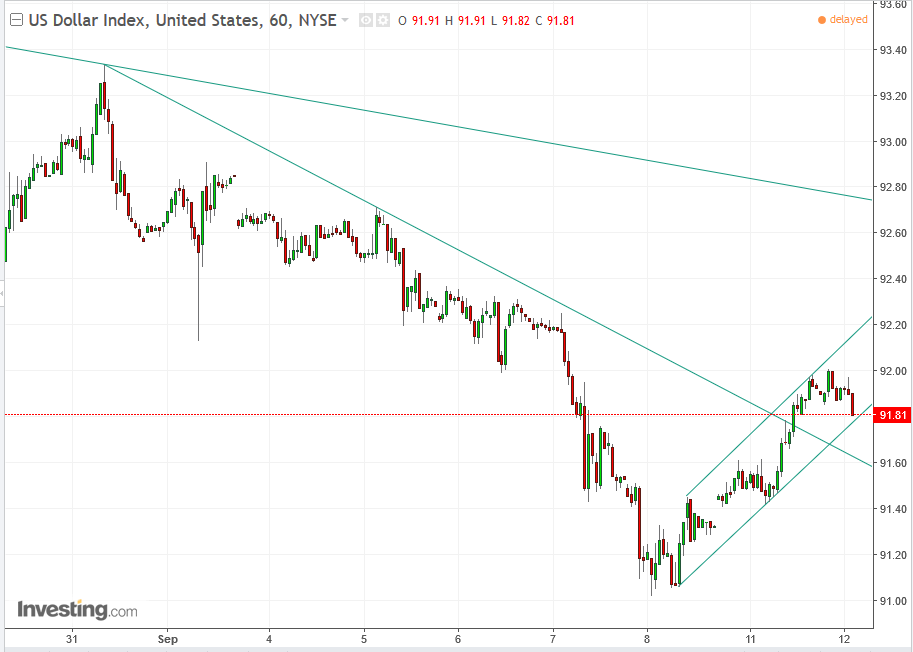
Not to be left out, the dollar gapped up 0.16 percent, extending its advance to a total of 0.63 percent, after Friday’s bullish hammer.
While in the longer-term the dollar is in a downtrend, as discussed here, in the short-term, it crossed above its recent hourly downtrend line since August 31, at 8:00. It's trading within a rising channel since September 8, 1:00, and is reaching the support of the bottom of the channel, providing an ideal buying opportunity, with the next reading of 92.00 and a potential to rise to the next downtrend line since August 16, 8:00, at 92.75, per the current angle.
Fundamentally, the dollar doesn’t have a strong case on concerns of disappointing inflation before key US data.
WTI crude is flat, after yesterday paring more than half of its 3.4 percent plunge on Friday, on relief of less than expected carnage from Irma.
Mirroring the widespread market relief, investors dropped their safe haven holdings including gold and the Japanese yen while the Swiss franc has been flat; speculators have been shorting them.

The 10-year Treasury yield extended yesterday’s 1.92 percent rise with another 0.62 percent advance, as the prices of Treasuries drop, allowing for a bigger difference between the price of the Treasury and its yield. This is its straight fourth advance, extending yesterday’s crossing above the downtrend line since August 15 and heading toward the longer downtrend line since July 7, at 2.200 at the current angle.
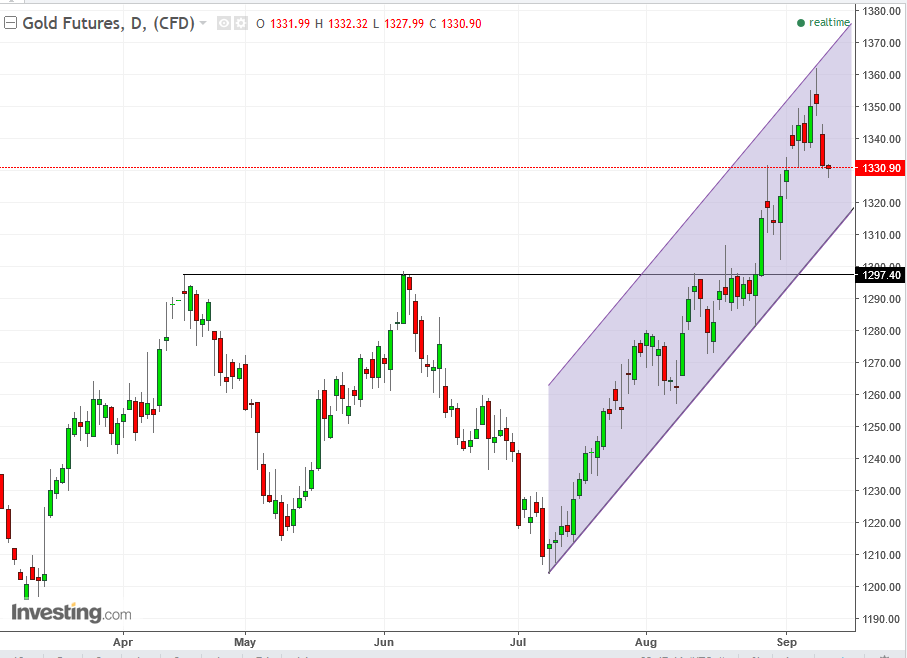
Gold extended yesterday’s 1.5 percent drop, including a gap-down, with a 0.25 percent slip on its third day of declines. The fall is considered a correction toward its uptrend line since July 10, providing a buying opportunity, after the commodity's $1,300 breakout.
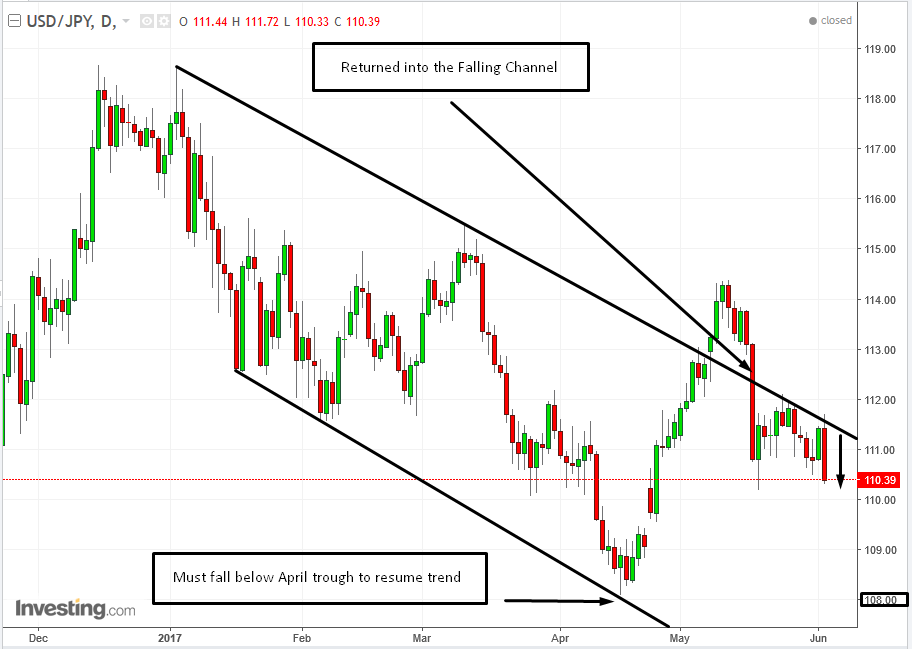
The yen extended yesterday’s near-full-percent slide by more than an additional full percent today, allowing the dollar to rebound from its April 17, 108.11 low versus the yen, sending it back into the pair’s consolidation channel since August 2.
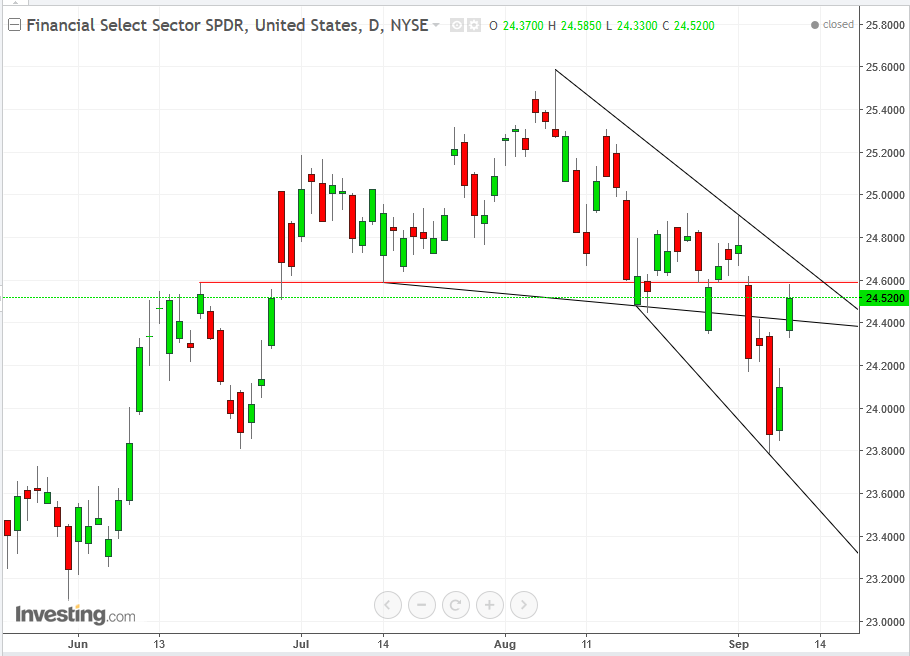
The robust risk-on sentiment, spurred by less-than-expected damage from Hurricane Irma, sent investors back into the financial sector, via the Financial Select Sector SPDR ETF (NYSE:XLF). Obvious financial sector beneficiaries of the weaker storm and lighter than anticipated fallout include insurance companies. As well, the outlook for banks has improved, both on falling Treasury yields (in which they’re invested) and an even slower path to higher interest rates, with loans their bread-and-butter.
After the financial sector led recent Wall Street slides, declining 3.6 percent between last Tuesday through Thursday, financials have been leading the rally this week, + 2.67 percent, including yesterday’s 1.15 gap-up. From a technical standpoint, however, this rally only provides traders with an even better shorting opportunity, as described here.
The weaker storm fallout allows for the continued narrative of a slowly improving US economy, albeit one whose inflation is meandering. Since the QE monetary policy instituted during December 2008 is unprecedented, and inflation since then has been the lowest since the early 60s, it’s anyone’s guess where this is going. There are those who say that the Federal Reserve Vice Chairman Stanley Fischer—a global central bank eminence who recently resigned from the Fed for “personal reasons”— actually is leaving because he no longer understands the global economy, after having been disappoint again and again with the lack of response by inflation to the Fed’s stimulus.
Current risk-on sentiment was also boosted by the UN Security Council's watered-down sanctions on North Korea, which dropped the initiation of an oil embargo and freeze of Kim Jong-Un’s assets.
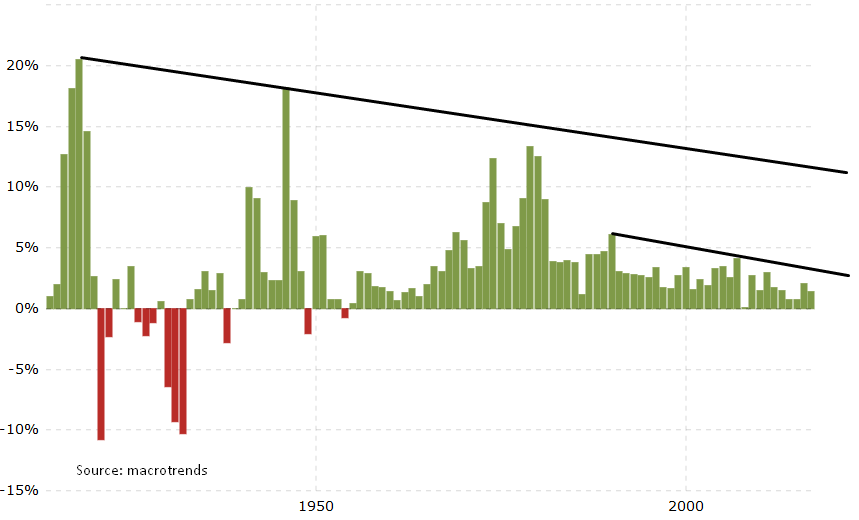
The above chart shows the annual rate of inflation in the US as measured by the Consumer Price Index back to 1914. Note the very disturbing declining trendline since 1990, within an ever-lengthening disturbing, declining downtrend line since 1918. It might do well for investors to keep this chart in mind when they become ecstatic about temporary growth within the US economy.
Ironically, while weak inflation hinders growth, it provides better investing opportunities in the short-term, as economic data gradually gets better while the weak inflation won't spur the Fed to raise rates. At the same time, historically low rates continue to prop up inflated prices.
The only remaining questions then: when will the party end, and will it be interrupted violently? Plus, how bad will the hangover be...scratch that, the overdose?
Up Ahead
10:00 PDT/13:00 EDT: Apple (NASDAQ:AAPL) unveils its new iPhones, the latest version of the Apple watch and other new products.
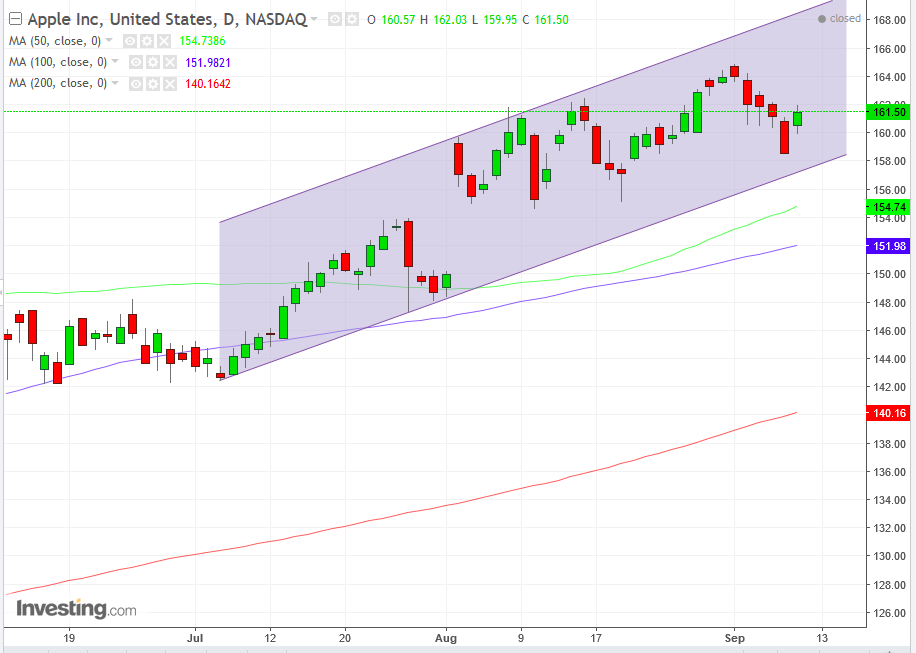
Apple's stock price confirmed its rising channel since July 6 with a 1.93 percent leap yesterday, as investors turned on risk. The major moving averages are in a bullish formation, with the more recent price average ahead of the longer ones. The next test for the price would be the September $164.94 all-time-high.
20:30: Australia – Westpac Consumer Confidence (September): previous reading 95.5.
Here is what we wrote about the S&P/ASX 200 in Sunday's Week Ahead feature:
“The ASX 200 has been trading within a rising channel since the start of 2016. It has been consolidating throughout 2017. Last Friday, it closed the lowest since late January, providing a long position an attractive risk-reward ratio, with a stop-loss beneath last week’s 5645.80 hammer’s low with a minimum target of 5740, the high of the last two weeks; a medium target of 5800.00, range-top since May; and a maximum target of 59.00, nearing the April-May resistance.”

Indeed, the Index's price leaped 1.3 percent, bouncing off the 50 dma (green), outperforming all US benchmarks. The 100 dma (purple) found support at the bottom of the rising channel and is set on crossing over the 200 dma (red).
Market Moves
Stocks
- Japan’s TOPIX advanced 0.9 percent at the close in Tokyo.
- Australia’s S&P/ASX 200 Index added 0.6 percent.
- South Korea’s KOSPI rose 0.3 percent.
- The Hang Seng Index in Hong Kong and China gauges, including the Shanghai Composite, fluctuated.
- S&P 500 Futures were flat in early European trading after the underlying gauge added 1.1 percent on Monday.
- The Euro Stoxx 50 futures contract rose 0.4 percent as of 7:31 in London (2:31 EDT).
- The MSCI Asia Pacific Index climbed 0.4 percent.
Currencies
- The Dollar Index fell 0.13 percent after gaining earlier. It's been mostly flat in Asia after first advancing 0.1 percent, after yesterday’s 0.62 percent uptick, its first move higher in more than a week.
- The yen was at 109.38 per dollar after sinking 1.4 percent on Monday, its steepest decline since January.
- The Aussie bought 80.24 U.S. cents.
- The euro was up 0.1 percent at $1.1968.
Bonds
- The yield on 10-year Treasuries held at 2.13 percent after rising eight basis points on Monday.
- The yield on Australian government notes with a similar maturity added more than three basis points to 2.64 percent.
- 10-Year German bund yields climbed about one basis point at 0.35 percent.
Commodities
- Gold was little changed at $1,326.57 an ounce after sinking 1.4 percent on Monday.
- West Texas Intermediate crude was steady at $48.07 following a 1.2 percent gain on Monday.
