by Pinchas Cohen
Key Events
Ever since US tax reform hit a bumpy patch in Congress, risk-off has been dominating markets as US investors reconsider whether the recent string of market records was actually justified.
This morning, global equities extended the decline, as fundamentals continue fueling the risk-off sentiment. Yesterday, the IEA cut their forecast for oil demand. The agency performed an about face by saying the global market will likely remain oversupplied, the opposite of their position over past months. As well, there appears to be a less acknowledged risk to global oil markets.
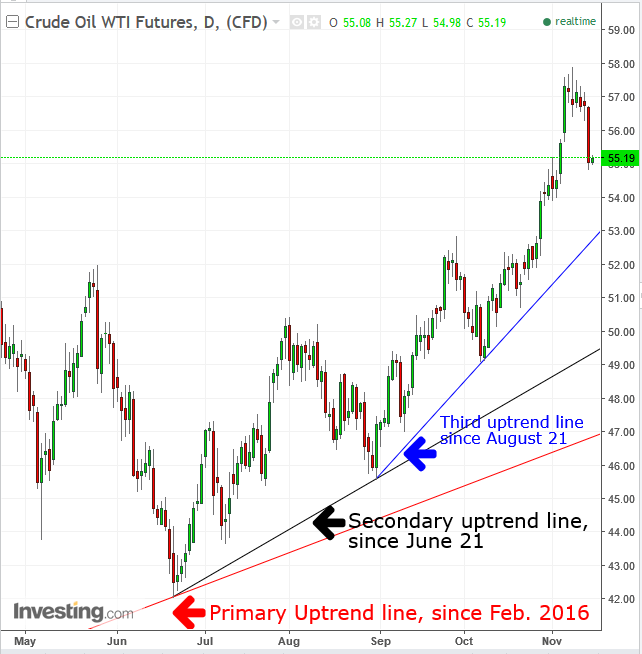
Crude oil plunged yesterday, falling $1.71, or 3%, the biggest percentage decline since the 3.25 percent slide (but only a $1.60 loss) on September 8. It was the biggest fall in absolute dollars since the $2.31 tumble of July 5.
Global Financial Affairs
An additional trigger for oil's plummet was yesterday's API Weekly Crude Oil Inventories report. It showed an increase of 6.51M barrels versus an expected drawdown of 2.2M. On signs of a commodities glut, mining, oil and metal stocks all fell in Japanese trade. They were the biggest losers this morning on the TOPIX, which retreated for a fifth day.
At the same time, the Nikkei 225 saw a sixth day of losses, as it retreated from its 25-year high. It was the longest losing streak in over a year for both Japanese indices, which yesterday led the S&P 500 to its third day of losses in four days.
In the US session yesterday, defensive sectors once again far outperformed growth stocks, with Utilities taking the lead, gaining 1.25 percent, followed by Consumer Staples, up 0.35 percent. The two sectors with the biggest losses were Energy, down 1.62 percent and Materials, off 0.91 percent.
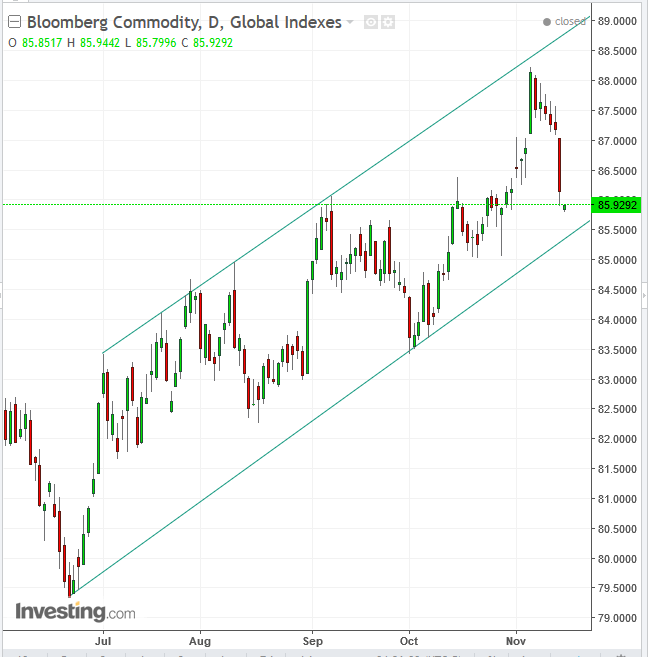
Though the Bloomberg Commodity Index continued its worst run since June, it's still considered to only be a correction, as it returns toward a rising trend line. Various ETF benchmarks including BlackRock Resources & Commodities Strategy Trust (NYSE:BCX) and United States Commodity Fund (NYSE:USCI) reveal a similar dynamic.
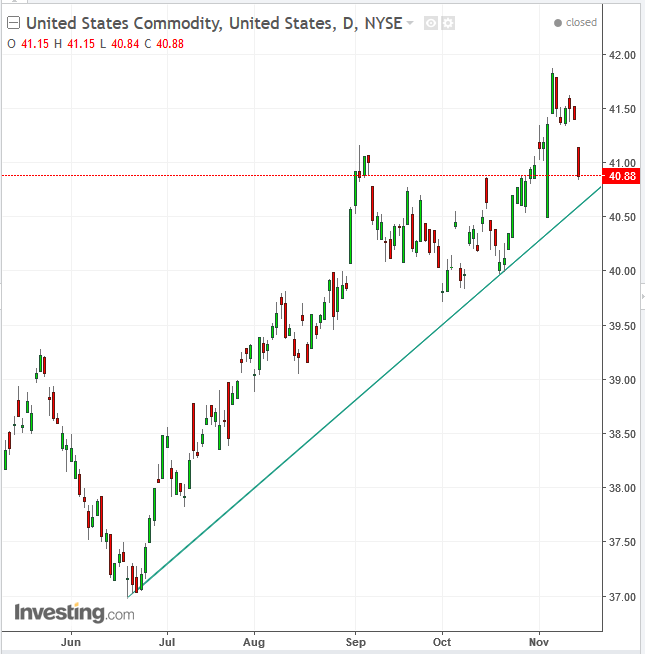
The US Commodity ETF chart above, for example, demonstrates that the decline is a correction toward a rising trendline, suggesting this commodity scare will be short-lived.
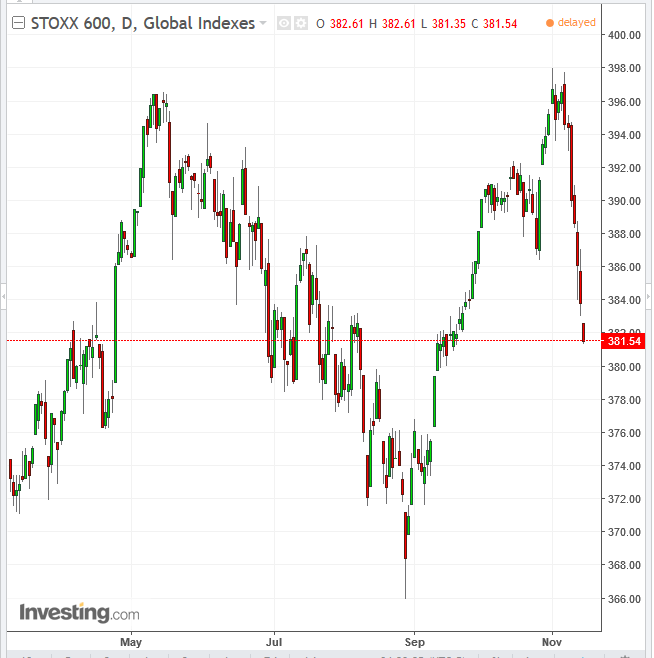
The Stoxx Europe 600 Index followed Japan’s lead this morning and fell for a seventh day. The European index is set to record its most sustained losses in a year, dropping closer to a neckline for a potential, massive double top, once the 366 level is breached. The implied target would be 334, or another 10 percent slide.
Investor focus today will be redirected to US consumer prices and retail sales, as they look for signals on the strength of the US economy, after the flattest Treasury yield curve in a decade stirred institutions to reconsider their outlook on growth. Some are already taking a stand.
Morgan Stanley advised clients to buckle down and keep portfolios overweight on stock allocation. Granting that valuations are historically high, the major investment bank believes “equities can still get richer” as the firm’s cycle indicators all continue to point to expansion. Perhaps this cross-market outlook is the effect to the cause stated above with regard to commodities—the fundamental culprit of the current risk-off, as opposed to potential tax cuts, whose benefit to markets has been a hotly debated issue.
Robust growth in Germany and Italy, both reports released yesterday, knocked the euro out of its coma, sending the common currency higher by 0.42 percent, a surge that started yesterday when it jumped 1.07 percent.
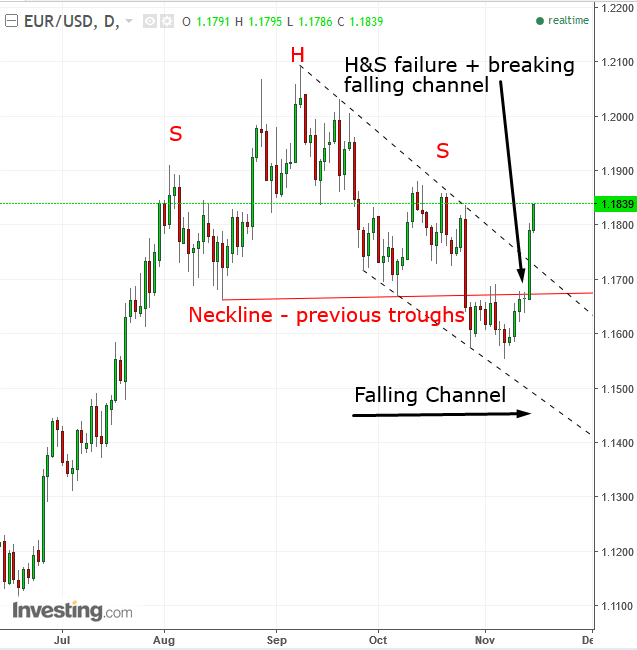
The sudden turnaround spurred bulls to push through two bearish lines-in-the-sand, a head & shoulders neckline that connects the two prior lows which is expected to suppress the price below, and a downtrend line since September 8, the head of the H&S. While an uptrend can't be called until two peaks and troughs post at higher prices, the failure of the H&S top, a classically reliable pattern, makes further advances more likely. Still, beware of a bear trap. With just 1 percent penetration, that's also a possibility.
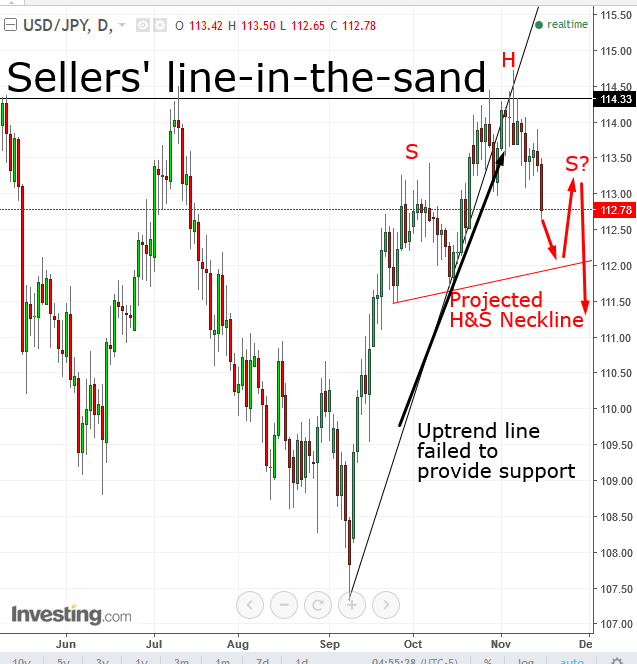
The dollar is seeing pressure from the yen as well. In addition to its safe haven status during periods of risk-off, as Japan’s economy has grown for a seventh straight quarter, the currency has received a boost from the country's longest expansion since 2001.
Up Ahead
- Bank of England officials address the bank’s future on Thursday, while European Central Bank chief Mario Draghi speaks on Friday.
- A string of Fed-member appearances may further illuminate the FOMC’s commitment to a December hike.
- U.S. CPI and retail sales data will be released Wednesday morning.
Market Moves
Stocks
- The TOPIX closed 2 percent lower in Tokyo to seal its longest streak of losses since September 2016. The Nikkei 225 was down 1.6 percent.
- Australia’s S&P/ASX 200 Index declined 0.6 percent and the KOSPI, in Seoul, fell 0.3 percent.
- Hong Kong’s Hang Seng Index slipped 1 percent; the Shanghai Composite Index was down 0.8 percent.
- The Stoxx Europe 600 Index dipped 0.5 percent as of 8:18 a.m. London time, hitting the lowest in eight weeks with its seventh consecutive decline.
- The MSCI All-Country World Equity Index declined 0.2 percent, reaching its lowest point in almost three weeks on its fifth consecutive decline.
- The U.K.’s FTSE 100 fell 0.3 percent, hitting the lowest in almost seven weeks with its fifth consecutive decline.
- Germany’s DAX dipped 0.6 percent, reaching the lowest in five weeks on its fifth consecutive decline.
- The MSCI Emerging Markets Index dipped 0.5 percent, hitting the lowest in almost three weeks with its fifth consecutive decline, its largest contraction in almost three weeks.
- S&P 500 Futures sank 0.4 percent to the lowest in almost three weeks, the biggest dip in 10 weeks.
Currencies
- The Dollar Index fell 0.38 percent, extending yesterday’s decline to a full percent, to the lowest in almost four weeks.
- The euro climbed 0.2 percent to $1.1823, reaching the strongest in almost four weeks on its sixth consecutive advance.
- The British pound gained 0.1 percent to $1.3176.
Bonds
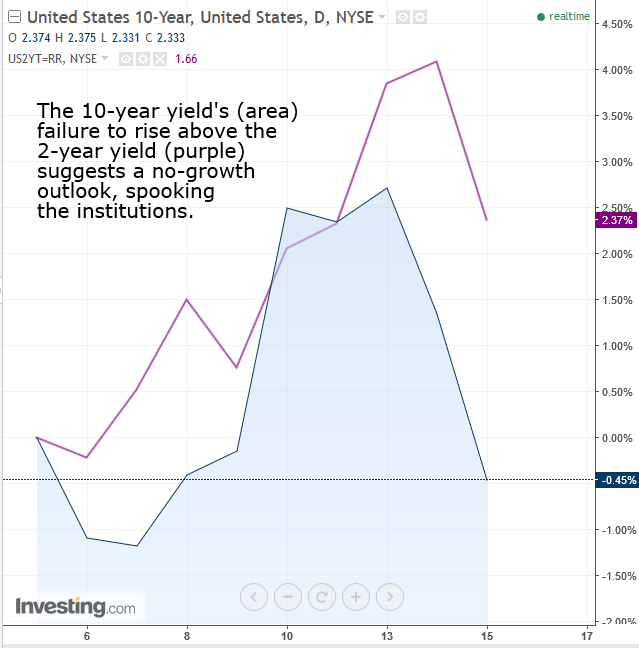
- The yield on 10-year Treasuries fell three basis points to 2.34 percent. The 10-year yield's failure to rise above the 2-year yield, which suggests a no-growth outlook, has spooked institutional investors.
- Germany’s 10-year yield fell two basis points to 0.38 percent, the biggest fall in more than a week.
- Britain’s 10-year yield declined three basis points to 1.29 percent, the largest drop in almost two weeks.
Commodities
- Gold gained 0.2 percent to $1,283.31 an ounce.
- West Texas Intermediate crude fell 1 percent to $55.14 a barrel, the lowest in almost two weeks.
