Wednesday January 10: Five things the markets are talking about
Global equities have taken a well-deserved pause overnight as investors access the recent surge in sovereign bond yields.
Higher global yields was always going to be one of the major trading themes for 2018, and in week-two of the new trading year, investors are having to adapt probably a tad more quicker to rates backing up. Some U.S analysts are already calling U.S yield curve moves a ‘bear’ market.
This morning’s Swedish Riksbank December minutes are being viewed as more ‘hawkish’ with Governor Ingves hoping to hike rates before the ECB. Even Norway’s CPI data is validating Norges view of bringing its first potential hike forward.
Last Friday’s ‘out of the ball park’ Canadian employment numbers have bond dealers repricing the possibility that Governor Poloz can afford to be more proactive on tightening. Current odds are at +83% for a +25bps hike on Jan.17.
Elsewhere, 10-year sovereign yields from the U.S, Germany, China, Japan and Korea are trading at multi-month and -year highs.
What to watch: U.S inflation data this Thursday and Friday – will price pressures remain mute for now?
1. Equities take a breather
One day after posting more record gains stateside, global equities seem to be taking a much-needed time out.
In Japan, the Nikkei share average took a breather overnight after sharp gains; with some index-heavy stocks losing ground after the index hit a 26-year high in the previous session. The Nikkei ended -0.3% lower, while the broader Topix was up +0.2%.
Down-under, the main benchmarks in New Zealand and Australia fell -0.6%, while in S. Korea the KOSPI fell -0.4% on a -3.1% drop for index heavyweight Samsung Electronics (KS:005930).
In Hong Kong, Hong Kong stocks extended their winning streak to a 12th day, again aided by strong inflows from mainland China. At the close of trade, the Hang Seng index was up +0.2%, while the Hang Seng China Enterprises index rose +0.27%.
In China, stocks gain for the ninth day as banks and consumer firms rally. At the close, the Shanghai Composite index was up +0.24%, while the blue-chip CSI300 index was up +0.45%.
Note: China’s producer prices rose at their slowest pace in a year in December, while the country’s consumer inflation accelerated less than expected to +1.8%last month from +1.7% in November.
In Europe, regional markets opened slightly lower, but have bounced from their lows with some mixed results. Oil prices continue to support energy stocks. Elsewhere, market attention is turning to upcoming inflation data from the U.S and corporate earnings stateside.
Futures on the S&P 500 Index have decreased -0.2%, the first retreat in more than a week.
Indices: Stoxx600 -0.1% at 399.6, FTSE +0.3% at 7752, DAX -0.5% at 13320, CAC 40 -0.1% at 5520, IBEX 35 +0.4% at 10468, FTSE MIB +0.4% at 23095, SMI -0.3% at 9587, S&P 500 Futures -0.2%

2. U.S oil hits highest in three years, gold prices mixed
Ahead of the U.S open oil prices have hit their highest since 2014 as OPEC-led production cuts and healthy demand helped to balance the market. But, there continues to be fears that the market is overheating.
Brent crude futures are at +$69.10 a barrel, +28c above Tuesday’s close. Brent touched +$69.29 in late Tuesday trading, the highest since May 2015. U.S West Texas Intermediate (WTI) crude futures are at +$63.42 a barrel, up +46c. Earlier prices rose to +$63.57, the highest since Dec., 2014.
Note: OPEC together with Russia and a group of other producers, last November extended an output-cutting deal to cover all of 2018. The cuts were aimed at reducing a global supply overhang.
Data yesterday from API further supported prices – it showed that U.S crude inventories fell by -11.2m barrels in the week to Jan. 5, to +416.6m barrels. This came as the U.S EIA raised its 2018 world oil demand growth forecast by +100k bpd from its previous estimate.
Note: Traders are expected to take direction from this morning’s official EIA weekly stocks data, which is due at 10:30 EDT.
Gold prices have done a u-turn on the news that China officials suggesting that U.S treasuries are less attractive and are recommending halting buying. Spot prices have rallied hard in the last hour to +$1,324.26 an ounce.
Note: Prices fell -0.6% on Tuesday, its biggest one-day loss in a month.

3. Fixed income to watch this week’s U.S price data
U.S government bonds have edged higher as the market prepares to see how an important theme for 2018 may start to play out – inflation.
Tuesday, U.S 10-year yields backed up +7 bps to +2.55%, a level last 10-months ago, and the Treasury curve steepened the most in three-weeks, as a plethora of sovereign bond supply from the U.S, the U.K, Japan and Germany come to the market this week coincided with a surprise cut in purchases of long-dated Japanese government bonds by the BoJ.
Fixed income dealers are looking ahead to tomorrow’s U.S PPI report and CPI Friday.
Note: With the U.S unemployment rate holding at +4.1% for the last three months of 2017 and Treasury Inflation-Protected Securities (TIPS) signaling faster inflation coming, the Fed has yet to find a way to bring inflation to the +2% level. With U.S policy makers having penciled-in three-rate increases for 2018, this week’s data could confirm that the Fed can stay on track.

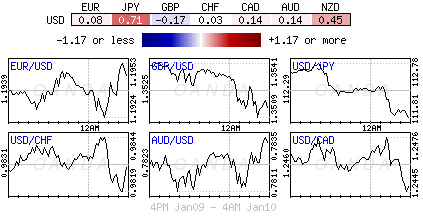
4. Dollar hurt by China official’s view that treasuries are less attractive
Ahead of the U.S open, some Chinese officials recommended slowing or halting U.S Treasury buying. This has had an immediate negative impact on the U.S dollar across the board (+0.52% €1.2000, +0.11 £1.3547, -0.75% ¥111.44)
In Asia, the yen climbed for a second day as traders unwound short positions in the wake of the BoJ’s paring back purchases of ultra-long dated bonds.
Mixed UK data forced the sterling initially lower in the Euro session. GBP/USD tested below £1.35 as wider trade deficit in Nov offset better Industrial Production data (see below).
With Scandinavian central banks becoming a tad more ‘hawkish’ the Scandi currency pairs have gotten more attention this morning. EUR/NOK fell to 2-month lows after higher-than-expected Norwegian CPI data for Dec. Pair tested €9.60 before stabilizing, while the EUR/SEK cross was lower by -0.3% as the Dec. Riksbank minutes were deemed a bit more ‘hawkish’ than expected.
Elsewhere, USD/ZAR ($12.4805) was higher by over +1% on reports that South Africa President Zuma relents on inquiry into South African state capture.

5. U.K manufacturing rose in November
Data this morning showed that U.K manufacturing grew again in November, posting its seventh monthly expansion in a row for the first time on record. This would suggest that U.K producers are continuing to benefit from the pound’s (£1.3494) weakness and strong global demand.
Note: U.K Manufacturing accounts for about a fifth of the country’s largely services-driven economy.
Factory output grew by +0.4% compared with October, slightly above market expectations of +0.3% expansion. The monthly figure for October was revised up to +0.3% from +0.1%.
Separately, the ONS said the U.K. goods trade deficit with the rest of the world widened slightly in November to -£12.2B from the revised October figure of -£11.7B.