- VIX goes wild, closing at 1-year high
- Stocks, bonds correlate
- Equities sold off at end of day, signaling more selling ahead
- NASDAQ Composite underperforms
- US oil production jump pushes WTI down
- A host of ECB speakers are on the schedule Thursday including Executive Board members Yves Mersch and Peter Praet.
- The UK’s monetary policy decision is due today as well. Mark Carney may flag more tightening this year if the economy remains on its current path; analysts also expect the BOE to upgrade its quarterly outlook.
- Philip Morris (NYSE:PM) reports earnings before market open, with an EPS forecast of $1.36 vs $1.10 YoY
- Twitter (NYSE:TWTR) releases its corporate results after market open, with an EPS forecast of $0.14 vs $0.16 YoY.
- The Stoxx Europe 600 Index decreased 0.1 percent as of 8:21 a.m. London time (3:21 EST).
- Futures on the S&P 500 Index jumped 0.4 percent.
- The MSCI Asia Pacific Index climbed 0.4 percent, the first advance in a week and the largest increase in more than two weeks.
- The UK’s FTSE 100 dipped 0.3 percent.
- The MSCI Emerging Markets Index fell 0.1 percent, hitting the lowest in more than five weeks with its sixth straight decline.
- The Dollar Index gained 0.18 percent to the highest in two weeks.
- The euro slid less than 0.05 percent to $1.226, the weakest in almost three weeks.
- The British pound dipped less than 0.05 percent to $1.3876, reaching the weakest in almost three weeks on its fifth consecutive decline.
- The Japanese yen sank 0.3 percent to 109.65 per dollar.
- South Africa’s rand rose less than 0.05 percent to 12.0668 per dollar.
- The MSCI Emerging Market Currency Index sank 0.6 percent to the lowest in almost three weeks on the largest decrease in almost nine months.
- The yield on 10-year Treasuries rose three basis points to 2.835 percent.
- Germany’s 10-year yield increased more than one basis point to 0.761 percent.
- West Texas Intermediate crude decreased 0.2 percent to $61.64 a barrel, hitting the lowest in almost five weeks with its fifth consecutive decline.
- Gold decreased 0.5 percent to $1,312.50 an ounce, the weakest in more than five weeks.
Key Events
US equities were pressured again yesterday after Tuesday’s miraculous recovery, which featured the S&P 500’s strongest rally in 15 months and the Dow's biggest rally in 2 years.
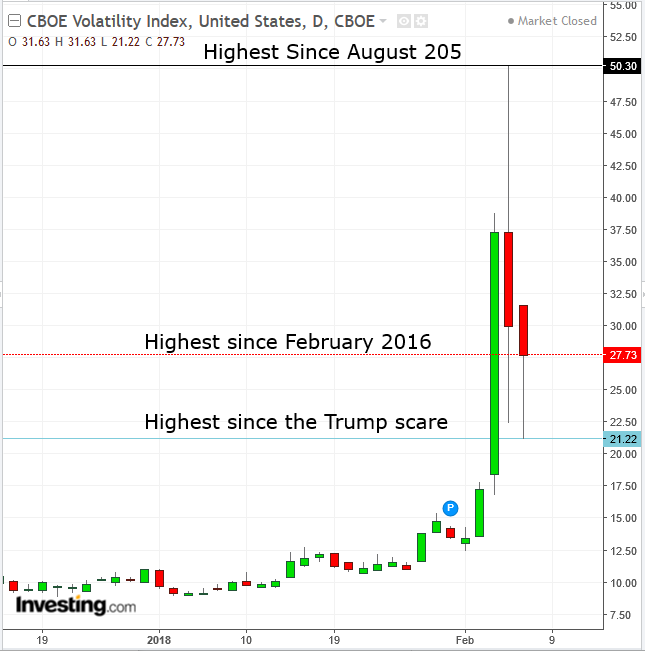
But that was then. During yesterday's session, volatility, as measured by the CBOE Volatility Index, more commonly referred to as the VIX, extended Tuesday's fall from a 2 ½ year-high, reaching an intraday low of 21.22, its highest level since November 9, when markets reacted to the initial shock of an unexpected Trump victory in US elections. However, volatility rebounded as the day progressed to close higher, at 27.73, its highest level since February 2016. The index remains about 40 percent above its average since 1990.
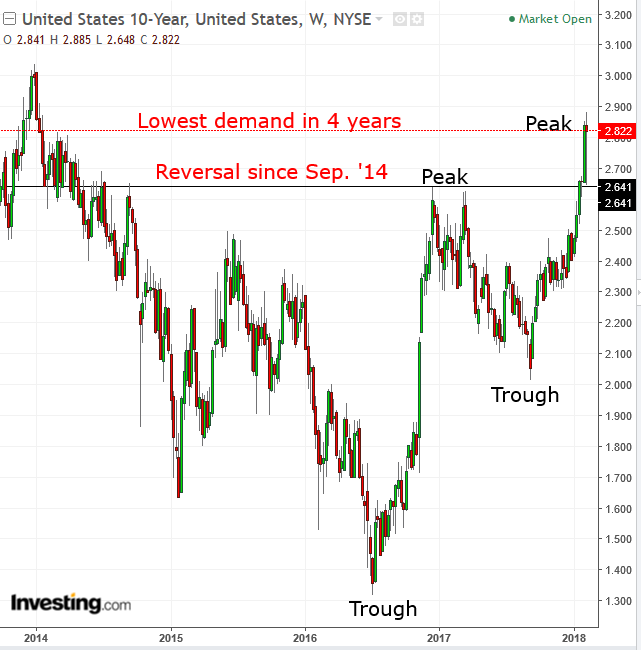
The turbulence was spurred by the auction of US 10-year Treasury notes which found little demand, provoking bond traders—still licking their wounds from last week’s reversal of the supply-demand balance that's been in place since late 2014—to increase supply, pushing the yield back above 2.8 percent.
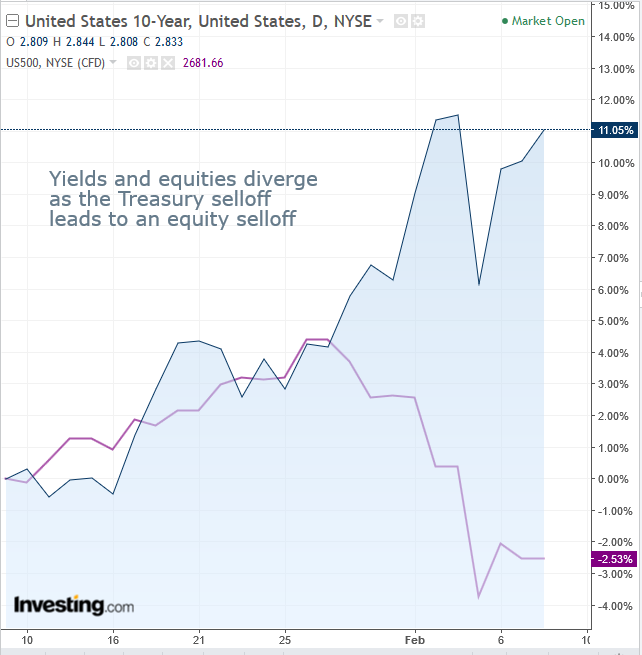
In turn, equity traders, still nervous from the worst selloff in 6 ½ years only two days earlier, joined bond traders and increased supply. The selloff, which began at 11:15 EST, was replaced by the two groups acting in harmony.
Prices ranged between 13:15 and 15:45. However, equity traders didn’t want to remain exposed overnight and, as the close neared, inundated exchanges with sell orders. Volume spiked, topping 9 billion shares for a fourth straight day, the highest in seven months.
The rush to sell before the close ended the harmonious range and tipped the balance over to supply, pushing it below its uptrend line, suggesting a negative outlook. This pattern is true for all major US indices, save the Russell 2000, the only major index yesterday that was able to eke out a 0.1 percent advance.
Global Financial Affairs
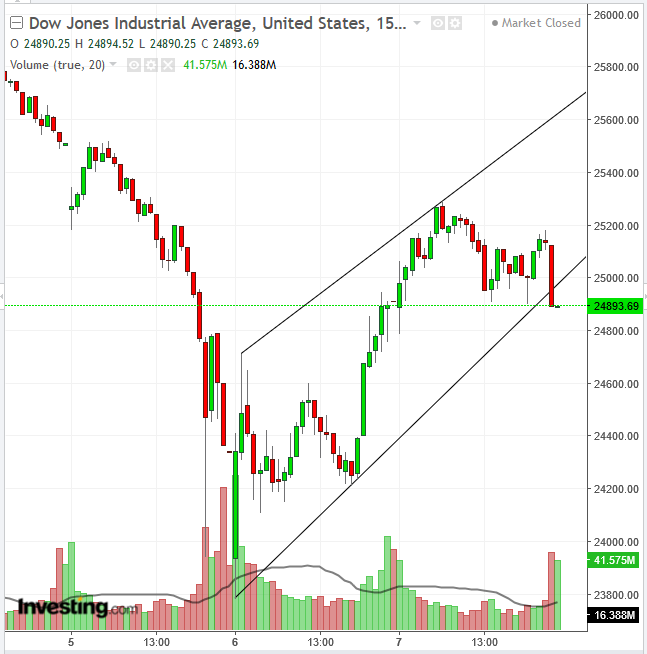
The Dow Jones Industrial Average fell a bit below a rising channel, but not far enough to render a rebound unlikely. However, the daily volatility increases risk, as it swung 500 points from peak to trough.
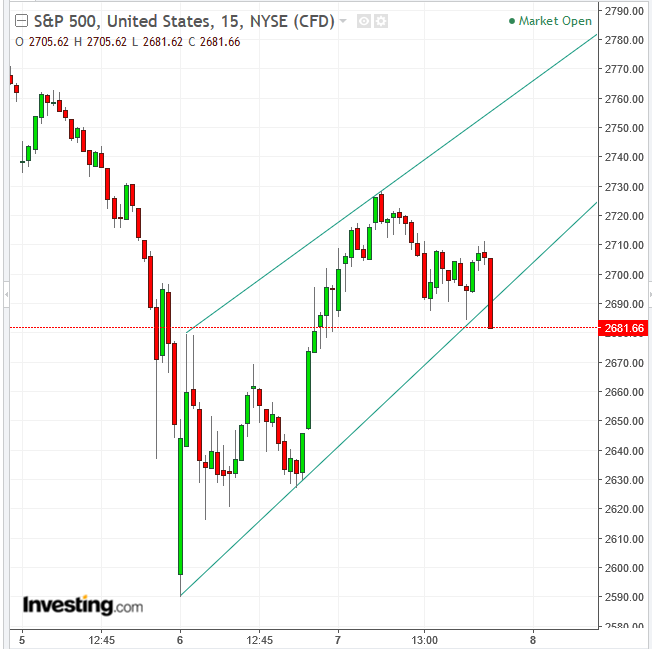
The S&P 500 dropped 0.50 percent, led by the Energy sector which fell 1.67 percent. Technology followed, down 1.28 percent. The only two sectors that eked out any gains were Industrials, which rose 0.18 percent, followed by Financials, which advanced 0.12 percent. The S&P 500 erased an uptick that reached 1.2 percent at its highest, to close lower by 0.5 percent. It was the biggest reversal for the index since 2015.
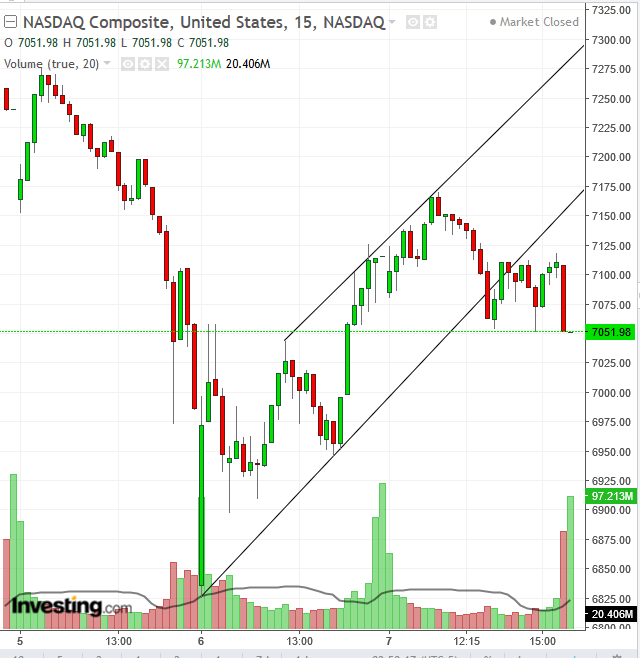
The NASDAQ Composite, which is heavily weighted towards information technology companies, fared even worse. The heavy selling of mega cap technology shares pushed the index down by 0.9 percent, forming a bearish Rising Wedge, in which the harmonious range following the initial selloff is considered a downside breakout.
After yesterday’s highly volatile 10-year Treasury yield activity, in which yields rose as high as 2.861 but fell as low as 2.758, only to close with much ado about nothing at 2.808, today yields have resumed their rise, sitting at 2.83, as of 04:20 EST. Exacerbating the aftershocks from the global equity selloff, the rising yield continues to confuse intermarket analysis, with European shares falling, Asian equities rising and US futures swinging from losses to gains.
The Stoxx Europe 600 Index Index opened lower this morning, with miners leading the retreat. Earlier, shares listed on Japan’s TOPIX closed higher after a turbulent session while China stocks listed on the Shanghai Composite slumped for a third day even as Hong Kong equities listed on the Hang Seng climbed. S&P 500 Futures were up after dropping earlier in Asian trading.
The yield surge sparked concern the Federal Reserve would accelerate its tightening schedule, slowing the economy and eroding corporate profit margins. Chicago Fed President Charles Evans signaled as much Wednesday, saying sustained inflation could force more hikes.
The reason the selloff wasn't worse is that investors have been trained to buy the dip. Many buyers are insisting that this time they're motivated not just by greed but by the continued solid fundamentals—synchronized growth and strong corporate earnings.
Still, we can’t help but wonder how much of this confidence is coming from investors who’ve grown used to a Fed whose looser monetary policy has been nursing markets along. What will happen to those same investors once the Fed shuts off much of that liquidity. How many investors will continue to buy?
At the same time, an extended selloff will slowly but surely exhaust liquidation, leaving sellers with no buyers at current price levels. That would force them to seek willing buyers, at any price, or put more broadly, at any cost.
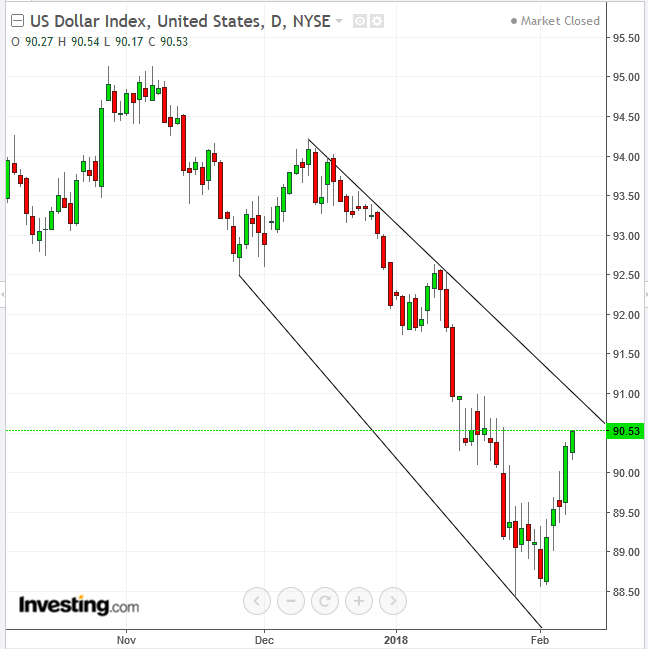
The dollar extended its rally into a 5th straight day. As of this writing it was trading at the height of the session, nearing the top of a falling channel.
Bloomberg’s Basic Materials Index fell for a fourth day, its biggest drop since November.
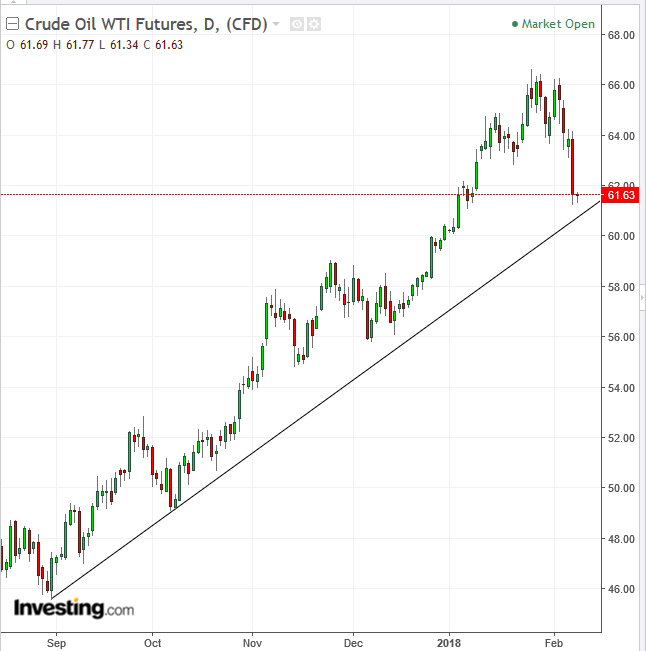
WTI crude fell the most in two months, nearing an uptrend line since September, after government inventories data showed a jump in production. Gold futures slid, and copper futures tumbled more than 3 percent.
The pound was flat ahead of a Bank of England rate decision.
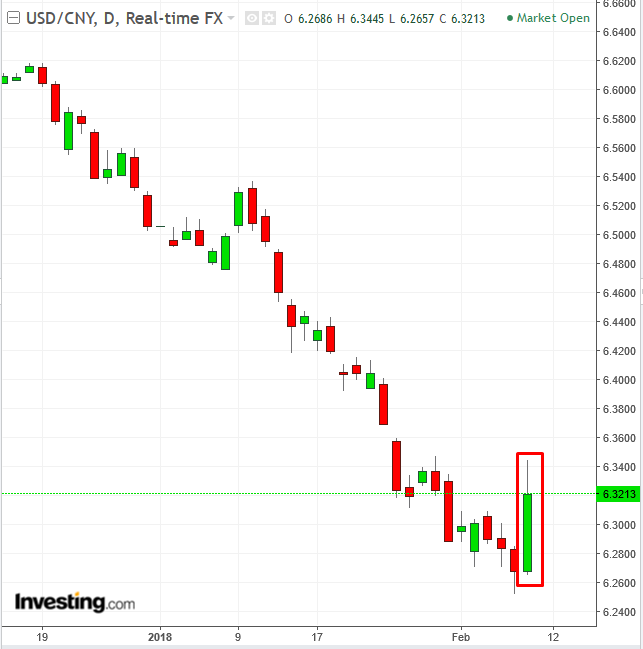
In Asia, the yuan fell the most since the currency’s devaluation in August 2015, after China reported a much narrower-than-expected trade surplus as imports jumped. The country has resumed its Qualified Domestic Limited Partnership plan after a two-year hiatus, granting licenses to about a dozen global money managers able to raise funds in China for overseas investments, Reuters reported on Thursday, citing unidentified sources. Increasing imports and overseas investment both contribute to a weaker currency.
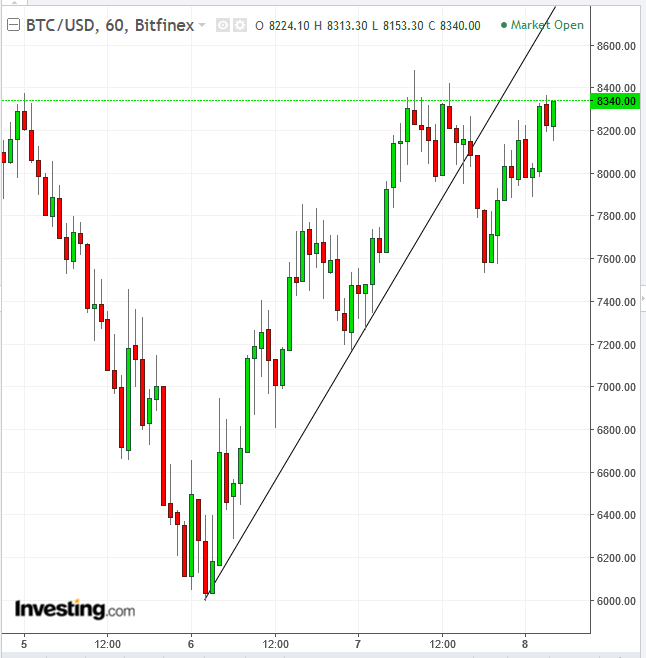
Bitcoin’s rebound remains under pressure since it fell from its uptrend line from the $6,000 low on Tuesday.
Up Ahead
Market Moves
Stocks
Currencies
Bonds
Commodities
