- English (UK)
- English (India)
- English (Canada)
- English (Australia)
- English (South Africa)
- English (Philippines)
- English (Nigeria)
- Deutsch
- Español (España)
- Español (México)
- Français
- Italiano
- Nederlands
- Polski
- Português (Portugal)
- Português (Brasil)
- Русский
- Türkçe
- العربية
- Ελληνικά
- Svenska
- Suomi
- עברית
- 日本語
- 한국어
- 简体中文
- 繁體中文
- Bahasa Indonesia
- Bahasa Melayu
- ไทย
- Tiếng Việt
- हिंदी

Jacobs Engineering Group Inc (J)
Jacobs Engineering Group Inc stock price live, this page displays NYSE J stock exchange data. View the J premarket stock price ahead of the market session or assess the after hours quote. Monitor the latest movements within the Jacobs Engineering Group Inc real time stock price chart below.
What Is the Jacobs Engineering Group Inc Stock Price Today?
The Jacobs Engineering Group Inc stock price today is 125.69.
What Is the Stock Symbol for Jacobs Engineering Group Inc?
The stock ticker symbol for Jacobs Engineering Group Inc is J.
Is J the Same as $J?
$J is a common way to refer to the Jacobs Engineering Group Inc ticker symbol in social media, forums, and online discussions. The dollar sign is a shorthand convention used to indicate that it is a stock ticker symbol
What Stock Exchange Does Jacobs Engineering Group Inc Trade On?
Jacobs Engineering Group Inc is listed and trades on the NYSE stock exchange.
Is Jacobs Engineering Group Inc a Good Stock to Buy?
Determining whether Jacobs Engineering Group Inc—or any stock—is a good buy requires comprehensive analysis. To evaluate its potential, users can sign up to InvestingPro, where they can assess the current Jacobs Engineering Group Inc share price compared with the fair value and other essential metrics.
You can find more details by visiting the additional pages to view historical data, charts, latest news, analysis or visit the forum to view opinions on the J quote. (ISIN: US46982L1089)
Currency in USD
Fair Value
An estimate of a stock's true price based on valuation models like discounted cash flow, peer valuation multiples, and dividend discount models.
Day's Range
123.44
126.11
52 wk Range
105.68
168.44
J is not included in our AI-picked strategies. See which stocks are.
Fair Value
An estimate of a stock's true price based on valuation models like discounted cash flow, peer valuation multiples, and dividend discount models.
Day's Range
123.44126.11
52 wk Range
105.68168.44
Key Statistics
Edit
Prev. Close
Open
Volume
Average Vol. (3m)
1-Year Change
Book Value / Share
Fair Value
Fair Value Upside
Market Cap
Shares Outstanding
Revenue
Net Income
EPS
EPS Growth Forecast
Next Earnings Date
(1.16%)
Dividends Payment Streak
P/E Ratio
Return on Assets
Return on Equity
Gross Profit Margin
Price/Book
EBITDA
EV/EBITDA
Beta
J Scorecard
Company’s Health
Assesses a company's financial position by analyzing its market value, financial ratios, industry benchmarks, and competitors.
UnlockFair Value
An estimate of a stock's true price based on valuation models like discounted cash flow, peer valuation multiples, and dividend discount models.
Unlock PriceTechnical Analysis
Strong Buy
Price Target
158.27
Upside
+25.92%
Members' Sentiments
Bearish
Bullish
ProTips
Tips that distill complex financial data into concise, actionable investment insights.
Has raised its dividend for 7 consecutive years
- Form 8K Jacobs Engineering Group For: 23 June
- Investing.com
- Form 8K Jacobs Engineering Group For: 23 June
- Investing.com
Technical Analysis
Summary
Strong Sell
Sell
Neutral
Buy
Strong Buy
Strong Buy
Technical Indicators
Strong Buy
Moving Averages
Strong Buy
Analyst Ratings
11 Buy
5 Hold
0 Sell
Ratings:
16 analysts
Overall Consensus
Buy
Analysts 12-Month Price Target:
Average 158.27
(+25.92% Upside)
Jacobs Engineering Group Inc SWOT Analysis
AI Integration | The firm adopts artificial intelligence as evolutionary enhancement across diversified operations, applying technology pragmatically to design optimization and project management rather than pursuing disruptive transformation strategies. |
Analyst Outlook | Price targets range from $154 to $160, with EPS projections spanning $6.05-$7.10 for FY1 and $7.00-$8.07 for FY2, reflecting confidence in backlog conversion covering over 40% of guided revenues. |
Merger Dynamics | Explore potential WSP combination creating America's leading design firm through share-heavy structure, emphasizing talent retention as critical success factor while navigating consolidation benefits and integration complexities. |
Middle East Growth | Jacobs leverages strategic positioning in Saudi Arabia and UAE mega projects through joint ventures, capturing multi-decade infrastructure opportunities in airports, shipyards, and smart city developments backed by sovereign resources. |
Jacobs Engineering Group Inc Earnings Call Summary for Q2/2026
- Jacobs Engineering Q2 2026 EPS of $1.75 beat forecast of $1.64 by 6.71%; revenue rose 27% YoY to $2.3B, surpassing $2.28B estimate.
- Adjusted EBITDA margin improved to 14.1%, up 70 bps YoY; adjusted EBITDA reached $327M, representing 14% YoY growth.
- Company raised FY 2026 EPS guidance to $7.10-$7.35 range and increased adjusted EBITDA margin outlook to 14.6%-14.9%.
- Stock declined 3.15% in after-hours to $126.62 despite earnings beat, trading near 52-week low of $118.38 amid investor concerns.
- CEO cited successful strategic execution in digital enablement and AI; PA Consulting integration expected to drive cost synergies in FY 2027.
Last Updated: 05/11/2026, 12:27 PM
Read Full TranscriptJacobs Engineering investor slides for Q2/2026
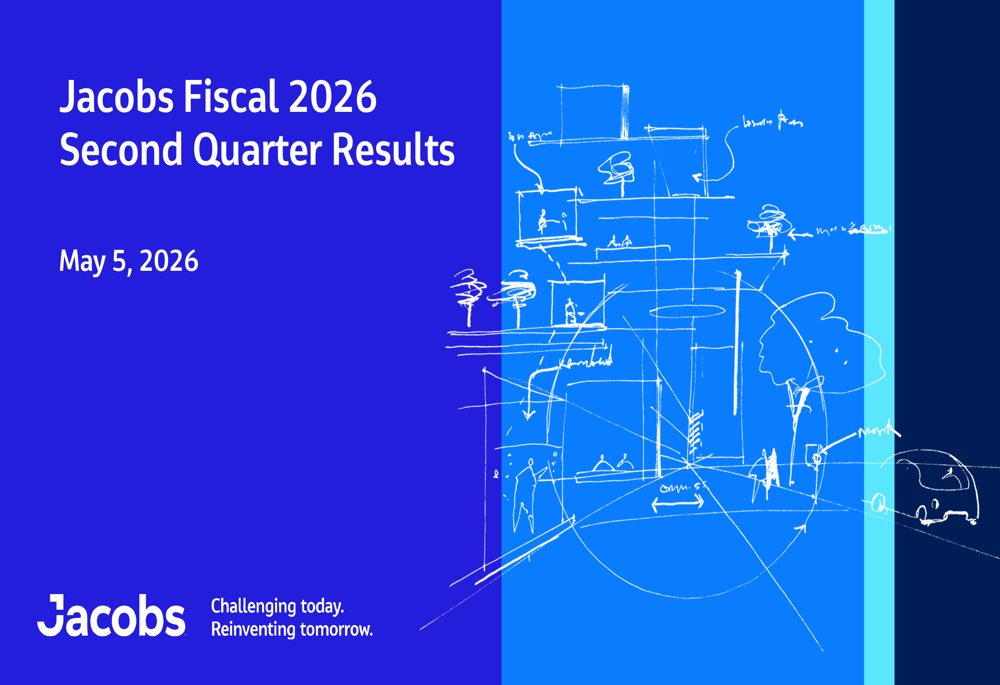
Last Update: May 11, 2026
See full investor slides
Earnings
Latest Release
May 05, 2026
EPS / Forecast
1.75 / 1.64
Revenue / Forecast
2.3B / 2.28B
Compare J to Peers and Sector
Metrics to compare | J | Sector Sector - Average of metrics from a broad group of related Industrials sector companies | Relationship RelationshipJPeersSector | |
|---|---|---|---|---|
P/E Ratio | 36.2x | 31.0x | 12.1x | |
PEG Ratio | −3.38 | 0.68 | 0.03 | |
Price / Book | 4.5x | 3.3x | 1.4x | |
Price / LTM Sales | 1.1x | 1.1x | 1.2x | |
Upside (Analyst Target) | 27.3% | 30.0% | 25.3% | |
Fair Value Upside | Unlock | 1.3% | 9.3% | Unlock |
Jacobs Solutions Inc. engages in the infrastructure and advanced facilities, and consulting businesses in the United States, Europe, Canada, India, Asia, Australia, New Zealand, the Middle East, and Africa. The company provides consulting, planning, architecture, design, engineering, and infrastructure delivery services including project, program, and construction management and long-term operation of facilities. It also offers consulting services for consumer and manufacturing, defense and security, energy and utilities, financial services, government, health and life sciences, and transport sectors. The company was founded in 1947 and is headquartered in Dallas, Texas.
Ownership
Ownership Overview
Top Holders
People Also Watch
FAQ
What Is the Jacobs Engineering (J) Stock Price Today?
The Jacobs Engineering stock price today is 125.69 USD.
What Stock Exchange Does Jacobs Engineering Trade On?
Jacobs Engineering is listed and trades on the New York Stock Exchange.
What Is the Stock Symbol for Jacobs Engineering?
The stock symbol for Jacobs Engineering is "J."
Does Jacobs Engineering Pay Dividends? What’s The Current Dividend Yield?
The Jacobs Engineering dividend yield is 1.16%.
What Is the Jacobs Engineering Market Cap?
As of today, Jacobs Engineering market cap is 14.84B USD.
What Is Jacobs Engineering's Earnings Per Share (TTM)?
The Jacobs Engineering EPS (TTM) is 3.43.
When Is the Next Jacobs Engineering Earnings Date?
Jacobs Engineering will release its next earnings report on Aug 11, 2026.
From a Technical Analysis Perspective, Is J a Buy or Sell?
Based on moving averages and other technical indicators, the daily buy/sell signal is Strong Buy.
How Many Times Has Jacobs Engineering Stock Split?
Jacobs Engineering has split 8 times.
How Many Employees Does Jacobs Engineering Have?
Jacobs Engineering has 47000 employees.
What is the current trading status of Jacobs Engineering (J)?
As of Jun 29, 2026, Jacobs Engineering (J) is trading at a price of 125.69 USD, with a previous close of 125.69 USD. The stock has fluctuated within a day range of 123.44 USD to 126.11 USD, while its 52-week range spans from 105.68 USD to 168.44 USD.
What Is Jacobs Engineering (J) Price Target According to Analysts?
The average 12-month price target for Jacobs Engineering is 158.27 USD, with a high estimate of 181 USD and a low estimate of 131 USD. 11 analysts recommend buying the stock, while 0 suggest selling, leading to an overall rating of Buy. The stock has an +25.92% Upside potential.
What Is the J After Hours Price?
J's last after hours stock price is 125.70 USD, the stock has decreased by 0.01, or 0.01%.
Industry Spotlight
Risk Disclosure: Trading in financial instruments and/or cryptocurrencies involves high risks including the risk of losing some, or all, of your investment amount, and may not be suitable for all investors. Prices of cryptocurrencies are extremely volatile and may be affected by external factors such as financial, regulatory or political events. Trading on margin increases the financial risks.
Before deciding to trade in financial instrument or cryptocurrencies you should be fully informed of the risks and costs associated with trading the financial markets, carefully consider your investment objectives, level of experience, and risk appetite, and seek professional advice where needed.
Fusion Media would like to remind you that the data contained in this website is not necessarily real-time nor accurate. The data and prices on the website are not necessarily provided by any market or exchange, but may be provided by market makers, and so prices may not be accurate and may differ from the actual price at any given market, meaning prices are indicative and not appropriate for trading purposes. Fusion Media and any provider of the data contained in this website will not accept liability for any loss or damage as a result of your trading, or your reliance on the information contained within this website.
It is prohibited to use, store, reproduce, display, modify, transmit or distribute the data contained in this website without the explicit prior written permission of Fusion Media and/or the data provider. All intellectual property rights are reserved by the providers and/or the exchange providing the data contained in this website.
Fusion Media may be compensated by the advertisers that appear on the website, based on your interaction with the advertisements or advertisers.
© 2007-2026 - Fusion Media Limited. All Rights Reserved.