US stocks pare deep opening losses on mixed trade war signals
Both defensive and growth sectors lead and lag, painting a mixed growth outlook picture
Canadian dollar and Mexican peso strengthen on signs the two countries may avoid hefty tariff
Treasurys mirror moves in stocks, supporting bullish view
Declining VIX suggests investors are ready to take on more risk
Global stocks bounce back from Wednesday jitters
ECB, BoJ expected to leave interest rates unchanged
Bitcoin pressured by US regulatory risk
- The February 25, $9,284.3 low, a potential double-top neck line,
- The top of a falling channel since December 17 and
- The 200 dma (red)
The Chinese People’s Political Consultative Conference runs through March 15 and overlaps with the National People’s Congress meetings in Beijing, through March 20.
The ECB isn’t expected to change policy on Thursday, but the Governing Council may discuss a change to pave the way for the end of quantitative easing.
BoJ monetary policy decision and briefing on Friday.
US monthly payrolls data is released on Friday.
The MSCI Asia Pacific Index rose 0.8 percent.
Japan's TOPIX rose 0.4 percent.
Hong Kong’s Hang Seng Index rose 1.6 percent.
South Korea's KOSPI rose 1.3 percent.
Australia’s S&P/ASX 200 Index rose 0.7 percent.
The STOXX Europe 600 Index increased 0.1 percent as of 8:10 a.m. London time.
The U.K.’s FTSE 100 Index rose less than 0.05 percent.
The MSCI All-Country World Equity Index gained 0.2 percent to the highest in more than a week.
Futures on the S&P 500 Index climbed less than 0.05 percent.
The Dollar Index is little changed, at 89.60.
The euro decreased less than 0.05 percent to $1.2409.
The British pound increased less than 0.05 percent to $1.3899.
The Canadian dollar gained 0.1 percent to C$1.2896 per U.S. dollar.
The Mexican peso jumped 0.2 percent to 18.6833 per dollar with its fifth straight advance.
The yield on 10-year Treasuries fell one basis point to 2.87 percent, the largest fall in a week.
Germany’s 10-year yield was unchanged at 0.66 percent.
Britain’s 10-year yield was unchanged at 1.495 percent.
The Bloomberg Commodity Index dipped 0.2 percent to the lowest in more than three weeks.
WTI crude climbed 0.1 percent to $61.21 a barrel.
Gold gained 0.2 percent to $1,327.97 an ounce.
LME aluminum fell less than 0.05 percent to $2,096.00 per metric ton, the lowest in more than 11 weeks.
Key Events
Yesterday, US equities trimmed a sharp decline to end the day mixed. Stocks opened with deep losses as President Donald Trump’s hard line on imposing steep tariffs on steel and aluminum imports became the key theme playing on investors minds worldwide yesterday, after the administration's pro free-trade, Chief Economic Advisor Gary Cohn resigned in protest.
However, White House Council of Economic Advisers Chairman Kevin Hassett told lawmakers on the Joint Economic Committee:
President Trump is very, very serious when he says that he’s a free trader and that he’s pursuing symmetry and reciprocity.
As well, Press Secretary Sarah Huckabee Sanders said that Mexico and Canada—two key US trade partners—may be exempted from the tariffs. The Mexican peso and the Canadian dollar stabilized on the news. This dual coaxing by the White House prompted investors to race toward what they suddenly saw as a buy-the-dip opportunity.
The S&P 500 opened 0.95 percent lower yesterday and fluctuated: moving from a 0.2 percent loss to a 0.95 percent loss in the first three hours. The benchmark index managed to rebound in the final few hours of trading for the fourth consecutive day, and closed little changed, with a decline of 0.05 percent.
Losses were led by a balanced mix of defensive and growth stocks. The defensive Consumer Staples sector was the main laggard (-0.88 percent), followed by growth sector Energy (-0.78 percent), defensive shares in Utilities (-0.75 percent) and finally growth stocks in Consumer Discretionary (-0.68 percent).
The two outperformers of the day—growth sector Technology (+0.55 percent) and defensive sector Health Care (+0.51 percent)—also signaled a mixed message. The near equal representation of defensive and growth sectors may indicate a lack of market leadership. In other words, equity investors can’t seem to make up their minds on whether the economy will expand, which translated into gains for growth stocks, or contract, translating into defensive stocks edging higher.
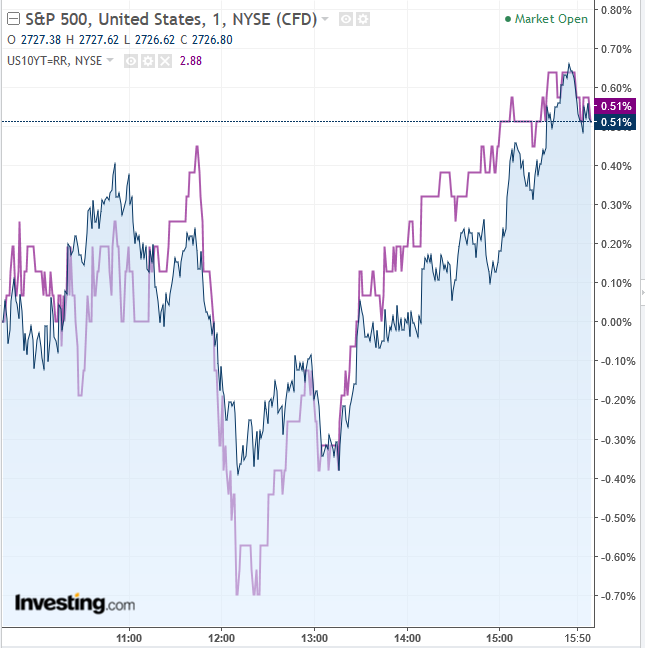
Intermarket analysis of equities and bonds may confirm the indecision shown by investors. 10-year Treasury yields opened sharply lower, 1.5 percent in the red, based on the typical inverse relationship where demand drives bond prices up and narrows the gap between their price and their current yield.
The 10-year note closed little changed at 2.88 percent, as investors sold off, pushing prices down and widening the margin between bond prices and their current yields. Bonds ultimately moved in mirror image to the S&P 500.
When studying the futures market, intermarket analysis also suggests investors are bullish. Like the S&P 500, the NASDAQ Composite and the Russell 2000 also started a 3-day rebound on March 2, which allowed them to trim back losses from the February 27-March 1 selloff, which had been prompted by trade war saber-rattling. This in turn soothed volatility.
The same didn't apply to the Dow Jones Industrial Average, whose mega-cap multinational stocks stand to lose the most from a trade war—while domestic firms listed on the Russell 2000 would be less affected, as highlighted by their outperformance, when they advanced 0.85 percent yesterday.
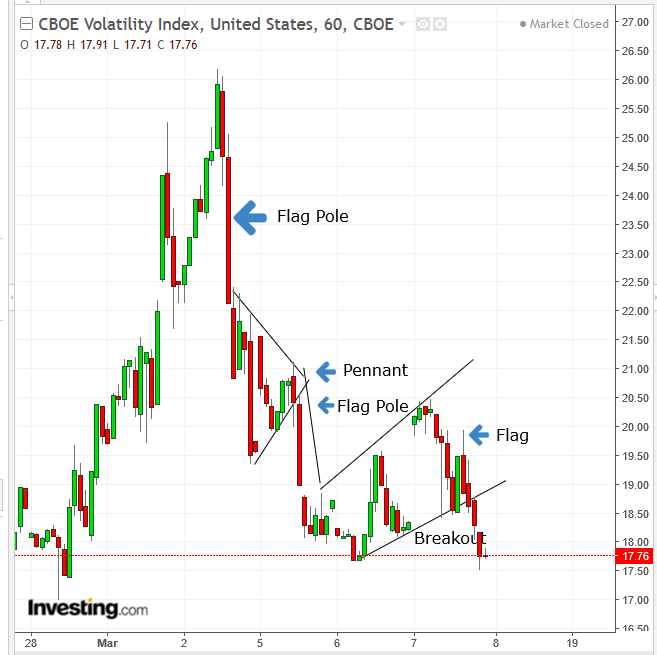
The VIX began easing from its 26.00 high of February 13, as stocks embarked on their biggest 2-day rally in 18 months after suffering their worst two-week performance in two years. The equity selloff was ignited by a jump in Treasury yields to a 4-year high, underscoring fears of a faster path of monetary policy tightening by the Fed. As volatility subsides, investors are lulled into a sense of security, making them more comfortable with taking on additional risk.
Yesterday’s close at 17.76 brought the VIX back to pre trade-war fear levels. Technically, the gauge extended a completed bullish Rising Flag formation, implying a rough 16.00 level target. That suggests a higher comfort level, encouraging investors to take more risk.
Global Financial Affairs
This morning, shares in Asian markets rallied, pushing up US futures, as investors shrugged off headwinds of a looming trade war. Across the region stocks advanced: Tokyo’s TOPIX, Sydney’s S&P/ASX 200 all closed higher while Hong Kong’s Hang Seng outperformed.
European equities followed Asian counterparts higher, as investors quickly forgot trade-war fears and switched to risk-on mode, racing to grab what were suddenly seen as cheap shares. The rally across European benchmarks was led by the industrial goods and services sectors.
For buy-and-hold investors, long term strategy is decided by fundamentals, which at present continue to be positive, regardless of political jitters. In the final analysis, company profits are what determines stock prices. In the real world, minus significant accommodative policy from central banks, a healthy economy provides a strong enough environment for companies to thrive. Since the global economy is growing, businesses are expected to follow suit.
Nevertheless, traders, who view volatility as an opportunity, may still prompt swings, as the trade war saga unfolds based on the whims of a single politician.
Markets this week have been dominated by geopolitical developments with the possibility of an escalating global trade war testing traders’ nerves. But attention now turns back to central banks, with investors focusing first on commentary from the ECB meeting on Thursday—with most expecting European policymakers to leave interest rates unchanged at 0.00 percent. On Friday it will be the turn of the Bank of Japan, which is expected to hold rates at -01.10 percent.
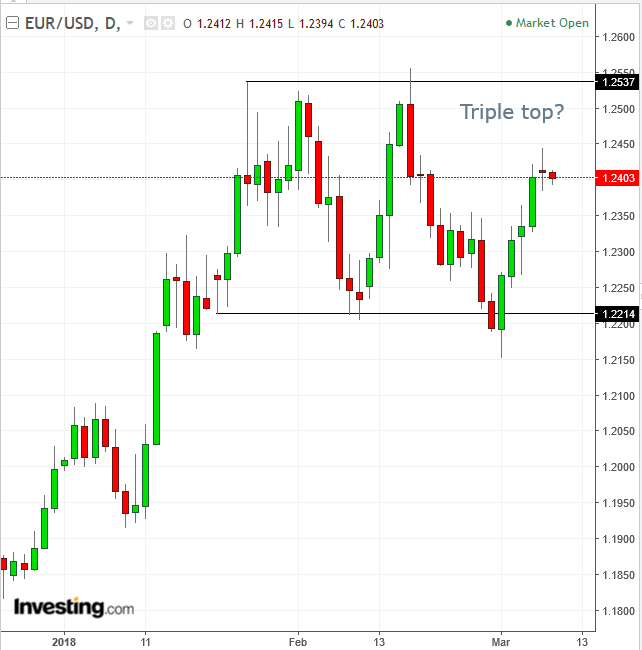
The EUR/USD pair dodged the risk of a downside breakout of a double top last Wednesday and Thursday. Traders using a filter would have been ready to avoid the bear trap with less than a 0.5 percent neckline penetration. Forward-looking technical analysts are remaining alert for a potential triple top development.
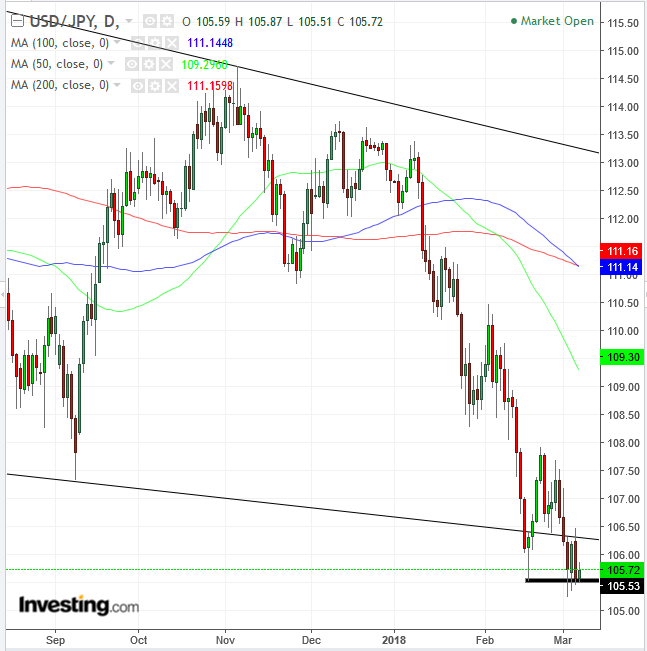
The USD/JPY pair is forming a potential continuation Pennant, whose downside breakout would finally clear the February 16, 105.53 hammer support, with an implied 103.50 target. In the bigger picture, it would provide a decisive downside breakout to a falling channel since mid-December 2016, allowing traders to eye the key 100.00 level.
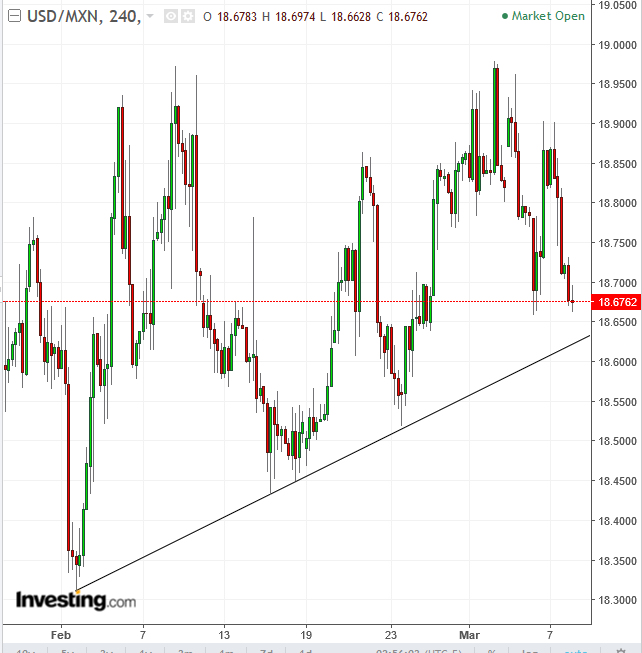
Even as the Dollar Index rose, the USD fell against the peso on the possibility that Mexico is will be exempt from Trump’s proposed tariff. Technically, the peso is retesting an uptrend line since February 1.
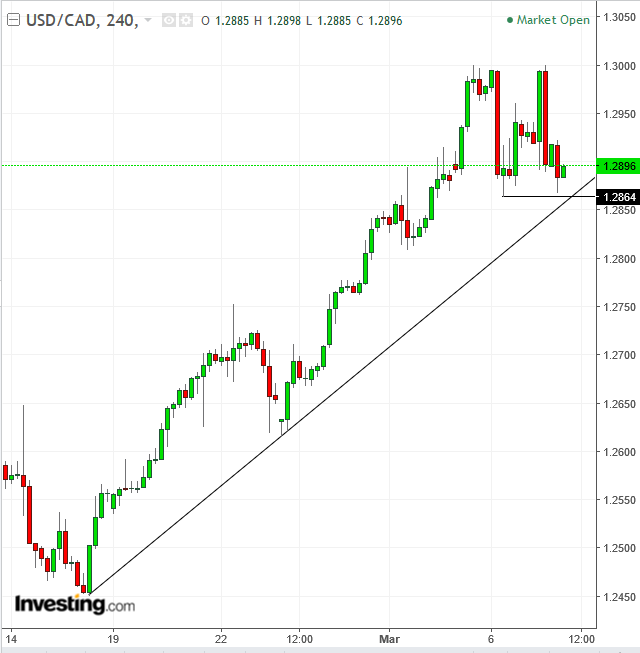
The loonie strengthened even against a rising dollar, forming a potential double top, whose downside breakout would include crossing below an uptrend line since February 16.
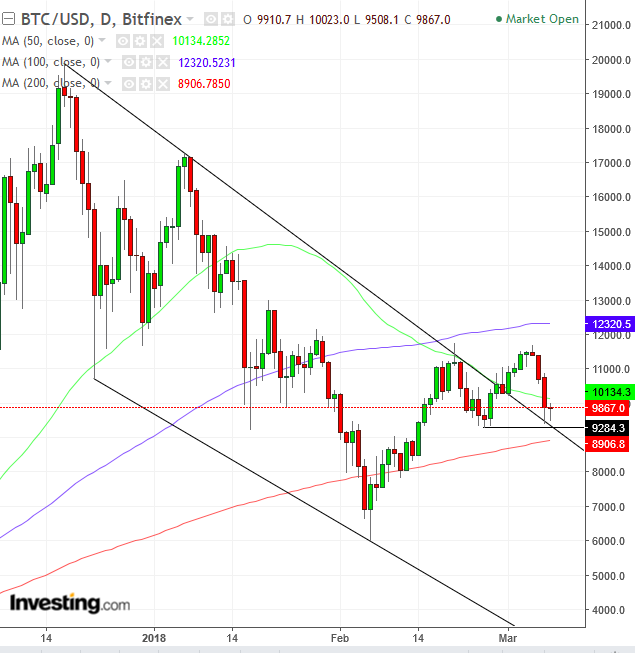
Bitcoin fell amid fresh pressure from the US securities regulator. Technically, the digital currency leader has found a triple support, demonstrating how sensitive this price level is in the supply-demand balance as highlighted by:
Since February 8, the price has been trapped between the 100 dma (blue), providing a resistance, and the 200 dma, providing a support. The price is assumed to continually trade within this range until a major event would change the balance between the bears and the bulls.
Up Ahead
Market Moves
Stocks
Currencies
Bonds
Commodities
