Breaking News
Investing Pro 0
🙌 It's Here: the Only Stock Screener You'll Ever Need Get Started

Opening Bell: U.S. Futures Tread Water As Earnings Hopes Waver, Trade Woes Rise

By Investing.com (Pinchas Cohen/Investing.com)Market OverviewJul 17, 2019 06:45AM ET
www.investing.com/analysis/opening-bell-200440565
Opening Bell: U.S. Futures Tread Water As Earnings Hopes Waver, Trade Woes Rise
By Investing.com (Pinchas Cohen/Investing.com)   |  Jul 17, 2019 06:45AM ET
Saved. See Saved Items.
This article has already been saved in your Saved Items
 
 
KS11
+1.16%
Add to/Remove from Watchlist
Add to Watchlist
Add Position

Position added successfully to:

Please name your holdings portfolio
 
CL
-0.01%
Add to/Remove from Watchlist
Add to Watchlist
Add Position

Position added successfully to:

Please name your holdings portfolio
 
1YMM3
-0.16%
Add to/Remove from Watchlist
Add to Watchlist
Add Position

Position added successfully to:

Please name your holdings portfolio
 
NQM3
+0.20%
Add to/Remove from Watchlist
Add to Watchlist
Add Position

Position added successfully to:

Please name your holdings portfolio
 
NFLX
+2.40%
Add to/Remove from Watchlist
Add to Watchlist
Add Position

Position added successfully to:

Please name your holdings portfolio
 
GB10Y...
+0.26%
Add to/Remove from Watchlist
Add to Watchlist
Add Position

Position added successfully to:

Please name your holdings portfolio
 
  • U.S. futures, European shares crawl higher as earnings hopes outweighed renewed U.S.-China trade tensions
  • Dollar drops after jumping on positive retail sales, housing data
  • Bitcoin extends slide below $10,000 critical level

Key Events

Futures on the S&P 500, Dow and NASDAQ 100 ticked mildly higher and bucked a falling Asian trend this morning, against a backdrop of renewed U.S.-China tensions and protracted uncertainty over the Fed’s path to lower interest rates.

Europe’s STOXX 600 pared a lower open that threatened to end a three-day winning streak. At the open, a selloff in financials offset a tech rally. The banking sector dropped with Swedish banks after Svenska Handelsbanken (ST:SHBa) disappointed on earnings, and Swedbank (ST:SWEDa) cut shareholder pay-out policy. Technology stocks, conversely, led a charge higher on the back of ASML (AS:ASML)’s earnings beat.

In the earlier Asian session, regional equities edged lower after a pick up in U.S. President Donald Trump's tariffs rhetoric resulted in a lackluster U.S. session performance. South Korea’s KOSPI (-0.91%) underperformed, while Australia’s S&P/ASX 200 (+0.49%) bucked the regional trend.

Global Financial Affairs

In yesterday’s U.S. session, equities retreated from all-time highs as strong earnings beat from some key market players such as JPMorgan (NYSE:JPM), Morgan Stanley (NYSE:MS) and J&J (NYSE:JNJ) were overshadowed by comments, from President Donald Trump, that higher tariffs on China could be reimposed should the Asian country fail to substantially increase its purchases of U.S. farm goods. On its part, China added hard-liner Commerce Minister Zhong Shan to its negotiating team, sparking worries of new diplomatic tensions.

The S&P 500 (-0.34%) ended a five-day advance. Trade-sensitive sectors Energy and Technology lagged (-1.10% and -0.95% respectively), the former also tracking weakening oil prices.

Renewed trade worries hit demand for oil also based on the consideration that OPEC producers recently synchronized their production cut decision to progress in trade talks between Trump and Chinese President Xi Jinping, as ongoing trade spat jitters had strengthened the outlook for a slowdown in global growth and fuel demand.

Tech companies' growth is also particularly dependent on smooth trade relations, with the U.S.-China dispute seen, at a core level, as a struggle for global tech dominance. Industrials (+0.65%) outperformed.
S&P 500 Daily Chart
S&P 500 Daily Chart

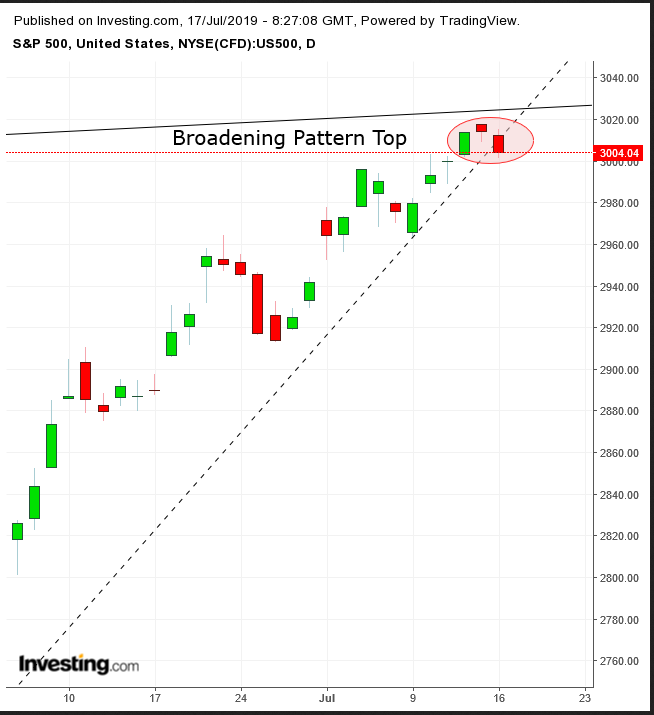
Technically, the SPX completed an evening star, at the very top of a broadening pattern since Jan. 2018, connecting the highs of January and September 2018, while connecting the lows of February and December 2018. A broadening pattern tends to develop at market tops, and the fact that this evening star—a three-session bearish pattern—develops right on the very top of a long-term bearish pattern is very telling.
DXY Daily Chart
DXY Daily Chart

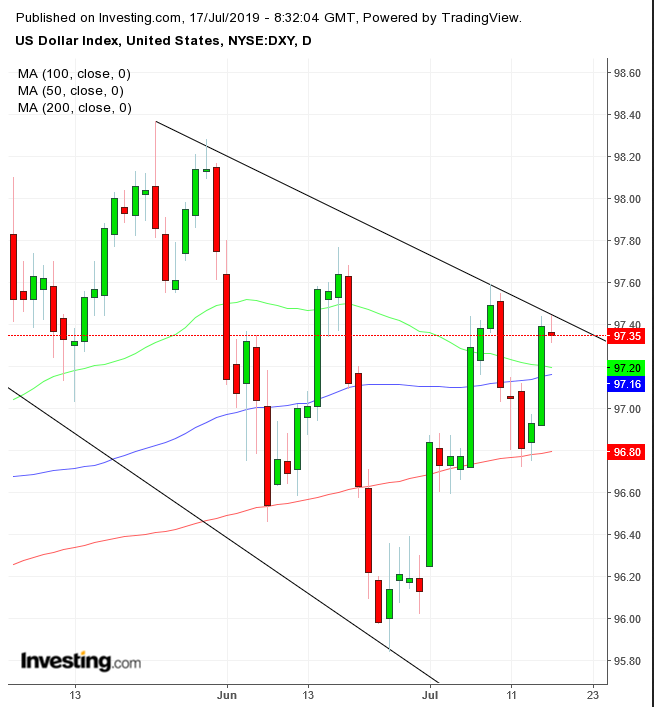
The dollar pared some gains after jumping on strong U.S. retail sales and housing data yesterday. Nevertheless, investors bets on rate cuts remain high as they're pricing in a 100% probability of a 25 basis points cut and a 27% chance of a 50 basis points cut. However, some are resuming to question the Fed’s resolve on easing policy as positive economic data accumulates—from the recent job report beat to Friday's inflation uptick to yesterday’s upbeat figures. Technically, the greenback met resistance of its falling channel top.
Bitcoin Daily Chart
Bitcoin Daily Chart

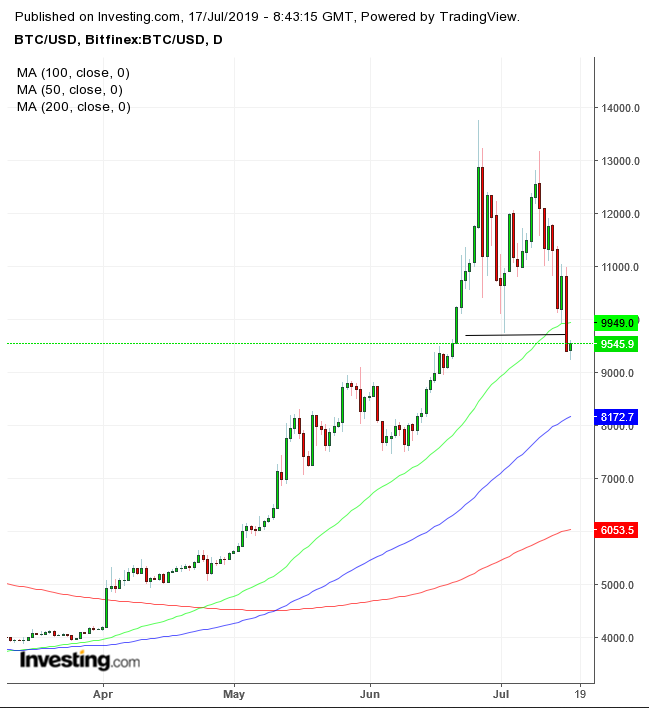
Bitcoin trimmed losses but remained below the $10,000 critical level, after Secretary of State Steven Mnuchin joined Trump and Fed Chairman Jerome Powell in warning against the dangers of the crypto market, labeling it a “national security issue.” Technically, the $10,000 psychological level breach is likely to attract more selling. At the same time, the price cut below the 50 DMA—which has been acting as its natural uptrend line since February—and, worst of all, it completed a double top.
WTI Daily Chart
WTI Daily Chart

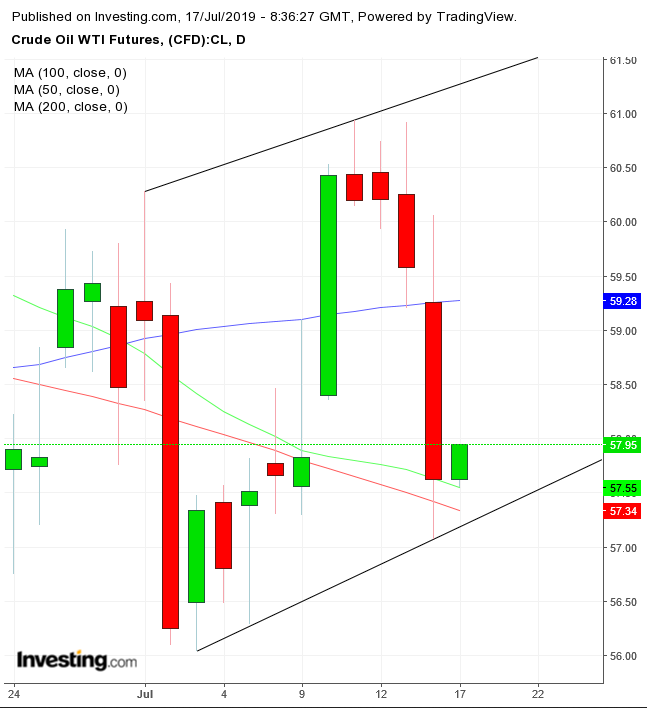
Crude oil extended gains after rebounding off the 200 DMA after inventories fell by 1.4 million barrels, nearly half of the expected 2.7 million barrels, according to API. The softer tone adopted by Secretary of State Mike Pompeo on Iran helped cool heightened tensions in the Gulf on Tuesday, prompting an earlier slide in WTI prices.

Up Ahead

Market Moves

Stocks

Currencies

  • The Dollar Spot Index decreased less than 0.05%.
  • The euro declined less than 0.05% to $1.1209, the weakest in more than a week.
  • The British pound slipped 0.2% to $1.2386, the weakest in more than two years.
  • The Japanese yen climbed 0.1% to 108.18 per dollar.

Bonds

  • The yield on 10-year Treasurys fell one basis point to 2.09%.
  • Germany’s 10-year yield edged three basis points lower to -0.27%, the lowest in a week.
  • Britain’s 10-year yield gave up three basis points to 0.787%, the lowest in a week.
  • Japan’s 10-year yield declined less than one basis point to -0.123%.

Commodities

  • West Texas Intermediate crude rose 0.2% to $57.74 a barrel, the largest advance in a week.
  • Gold declined less than 0.05% to $1,405.57 an ounce.
  • The Bloomberg Commodity Index fell 0.1%, the lowest in more than a week.
Opening Bell: U.S. Futures Tread Water As Earnings Hopes Waver, Trade Woes Rise
 

Related Articles

Tim Knight
Fed Spread Is Extreme By Tim Knight - Jun 09, 2023

Thursday afternoon means one thing, and that’s the Fed Spread. I am probably going to resume putting these posts behind the pay wall next week, since this chart is about to get...

Opening Bell: U.S. Futures Tread Water As Earnings Hopes Waver, Trade Woes Rise

Add a Comment

Comment Guidelines

We encourage you to use comments to engage with other users, share your perspective and ask questions of authors and each other. However, in order to maintain the high level of discourse we’ve all come to value and expect, please keep the following criteria in mind:  

  •            Enrich the conversation, don’t trash it.

  •           Stay focused and on track. Only post material that’s relevant to the topic being discussed. 

  •           Be respectful. Even negative opinions can be framed positively and diplomatically. Avoid profanity, slander or personal attacks directed at an author or another user. Racism, sexism and other forms of discrimination will not be tolerated.

  • Use standard writing style. Include punctuation and upper and lower cases. Comments that are written in all caps and contain excessive use of symbols will be removed.
  • NOTE: Spam and/or promotional messages and comments containing links will be removed. Phone numbers, email addresses, links to personal or business websites, Skype/Telegram/WhatsApp etc. addresses (including links to groups) will also be removed; self-promotional material or business-related solicitations or PR (ie, contact me for signals/advice etc.), and/or any other comment that contains personal contact specifcs or advertising will be removed as well. In addition, any of the above-mentioned violations may result in suspension of your account.
  • Doxxing. We do not allow any sharing of private or personal contact or other information about any individual or organization. This will result in immediate suspension of the commentor and his or her account.
  • Don’t monopolize the conversation. We appreciate passion and conviction, but we also strongly believe in giving everyone a chance to air their point of view. Therefore, in addition to civil interaction, we expect commenters to offer their opinions succinctly and thoughtfully, but not so repeatedly that others are annoyed or offended. If we receive complaints about individuals who take over a thread or forum, we reserve the right to ban them from the site, without recourse.
  • Only English comments will be allowed.
  • Any comment you publish, together with your investing.com profile, will be public on investing.com and may be indexed and available through third party search engines, such as Google.

Perpetrators of spam or abuse will be deleted from the site and prohibited from future registration at Investing.com’s discretion.

Write your thoughts here
 
Are you sure you want to delete this chart?
 
Post
Post also to:
 
Replace the attached chart with a new chart ?
1000
Your ability to comment is currently suspended due to negative user reports. Your status will be reviewed by our moderators.
Please wait a minute before you try to comment again.
Thanks for your comment. Please note that all comments are pending until approved by our moderators. It may therefore take some time before it appears on our website.
Comments (3)
Richard Broome
Richard Broome Jul 17, 2019 8:51AM ET
Saved. See Saved Items.
This comment has already been saved in your Saved Items
Let's see, all the big numbers came out great. Then the Feds think's about raising rates. Then President Trump throws out prolonged trade negotiations. He's got the Feds chasing their tails. I Love It ;-).
Pinchas Cohen
Pinchas Cohen Jul 17, 2019 8:51AM ET
Saved. See Saved Items.
This comment has already been saved in your Saved Items
It's worse. When Powell says he's lowering rates because of Trump's trade war, he incentivizes Trump to persist with protectionism, which he's happy to do on merit, or at least to please his support base. In this round of negotiations, Trump is the victor, who now can leverage the Fed to keep lower rates to do what he wanted to do in the first place. If Powell doesn't like the trade war, he's asking for it with cutting rates.
Nick Burns
Nick Burns Jul 17, 2019 8:43AM ET
Saved. See Saved Items.
This comment has already been saved in your Saved Items
like your chart work... I see the s&p in an up channel that it's about to break down from it it doesn't pull out by the end of the week ... I don't expect it to... btc if you look at a weekly chart and add 9ema as s signal line and a 20ma it's broken below the signal so far for the week might keep going... a monthly chart would show it can easily drop to 8000 or farther before recovering if it's going to
Pinchas Cohen
Pinchas Cohen Jul 17, 2019 8:43AM ET
Saved. See Saved Items.
This comment has already been saved in your Saved Items
Nick, thanks. I'm not a fan of sophisticated MAs. I think they defeat the purpose. moving averages have no inherent value. They were created to smooth out noise and show the general trend, but the input was arbitrary. I consider their only value to be that of a self-fulfilling prophecy. Since the overwhelming majority of market participants use the simple, major MAs, that's all I care about. About BTC, here's my Chart of the Day https://www.investing.com/analysis/chart-of-the-day-bitcoin-enters-official-downtrend-200440568. Thanks for your feedback.
Donkey Tablevillage
donkeybridge Jul 17, 2019 8:18AM ET
Saved. See Saved Items.
This comment has already been saved in your Saved Items
these lines on the first chart (S&p 500) are sooo beautiful
Pinchas Cohen
Pinchas Cohen Jul 17, 2019 8:18AM ET
Saved. See Saved Items.
This comment has already been saved in your Saved Items
Donkey, what precisely are you referring to, please?
 
Are you sure you want to delete this chart?
 
Post
 
Replace the attached chart with a new chart ?
1000
Your ability to comment is currently suspended due to negative user reports. Your status will be reviewed by our moderators.
Please wait a minute before you try to comment again.
Add Chart to Comment
Confirm Block

Are you sure you want to block %USER_NAME%?

By doing so, you and %USER_NAME% will not be able to see any of each other's Investing.com's posts.

%USER_NAME% was successfully added to your Block List

Since you’ve just unblocked this person, you must wait 48 hours before renewing the block.

Report this comment

I feel that this comment is:

Comment flagged

Thank You!

Your report has been sent to our moderators for review
Continue with Google
or
Sign up with Email