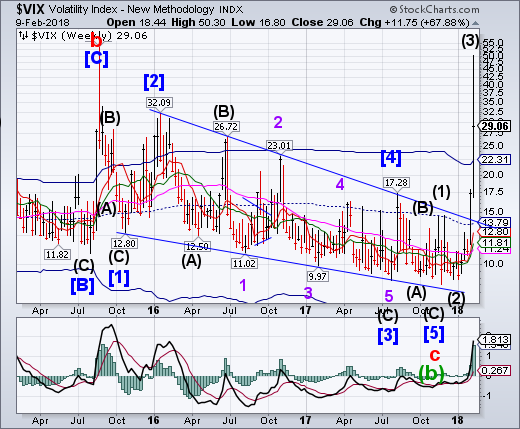
VIX nearly did a 100% retracement to the August 2015 high as suggested last week. This week it pulled back to test the Cycle Top support/resistance at 22.31. It appears to have yet another surge higher in store for it. The Cycles Model has a triple indicator of a higher Wave (3) top in the next week.
(ZeroHedge) Less than a month ago, Goldman Sachs (NYSE:GS) presciently published a note research report "VIX ETPs are now net short vega - should we worry?".
As the title suggests, it showed that the net position of VIX ETPs has become short over the past few weeks, for only the second time in their eight year history.
This odd finding - namely that the VIX ETPs had shifted their traditional vol bias from long to short - prompted the Goldman strategist to ask glibly "Should we worry?"
SPX declines to Long-term support...
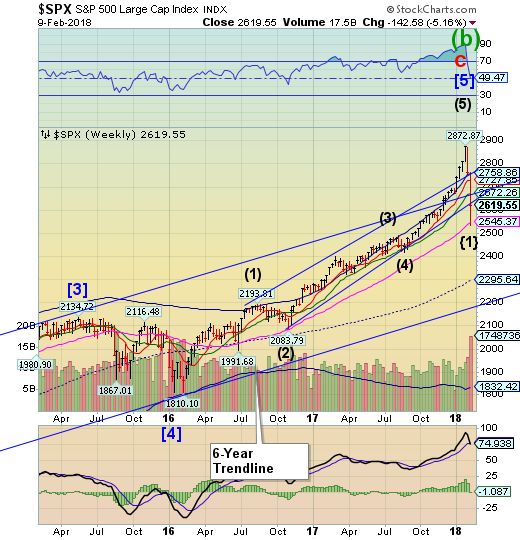
SPX declined to challenge Long-term support at 2545.37. Then it bounced to its two-year Ending Diagonal trendline. A failed retest of a trendline such as this is often referred to as “the kiss of death.” The Cycles Model suggests probable severe weakness lasting from a few days to more than a week..
(Bloomberg) One of the wildest runs in U.S. stock-market history began with the collapse of arcane bets on volatility and ended with a sober realization: The easy ride is over. After heart-stopping swings in the Dow (Down 1,000 points! Up 500 points!), a market correction is finally here.
But why—and why now? Inflation, interest rates, valuations, computers, ETFs, Trump; plenty of reasons were offered up. Among the lingering questions is the big one: Is this a hiccup or the start of something worse?
NDX violates its 2-year Diagonal trendline.
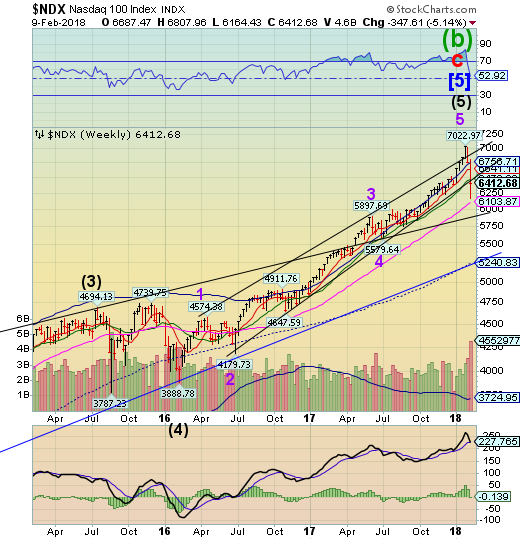
The NDX declined beneath the lower Ending Diagonal trendline at 6840.00, giving a sell signal in the process. It also bounced from long-term support at 6103.87 to challenge the trendline again. A failure here allows the NDX to decline to mid-Cycle support and the 7-year trendline at 5240.83. A breakthrough at that point suggests a further decline to the October 2011 low.
(ZeroHedge) If it seems like it was just a few days ago that we reported one of the biggest ever inflows into equities, it's because that's precisely when it happened. It was then that according to B of A CIO Michael Hartnett, we observed a "non-stop euphoria cabaret" in which markets saw a record $33.2bn inflow to equity funds, record $12.2bn inflow to active funds, $1.5bn into gold (50-week high), as well as record inflows to tech & TIPS.
Incidentally, that was the day the S&P hit its all time high, and more importantly, the day B of A also said that its euphoria and panic-buying driven "sell signal" was just triggered for the first time in 5 years, and predicted a 12% selloff in the next three months.
In retrospect, it took just two weeks because that post marked the peak of the market, and it has been non-stop selling since.
High Yield Bond Index challenges Long-term support and trendline.
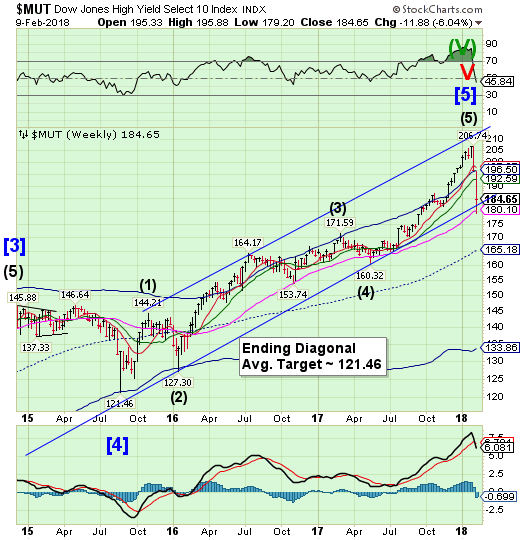
The High Yield Bond Index fell through its Cycle Top support, declining an additional 9% to challenge the 6-year trendline and Long-term support at 180.10.The bounce out of the low was sharp but short.The sell signal remains and the Cycles Model suggests additional weakness going forward.
(ZeroHedge) Yesterday saw rate vol start to accelerate, and today we see credit markets start to snap as equity market volatility contagion is spreading.
In fact, credit market volatility is spiking - and is above the Aug 2015 highs (higher relative to stocks where VIX remains below those levels)...
This is the biggest spike in High Yield bond spreads since Aug 2015's crash and raises relative funding costs to their highest since Dec 2016...
UST may show further weakness next week.
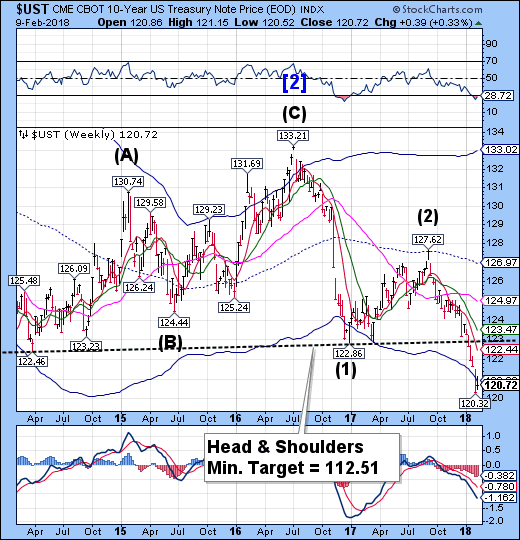
The 10-Year Treasury Note Index made a small bounce this week, but is being suppressed by its Cycle Bottom resistance, limiting its upward trajectory.There may be a further decline before another attempt at higher ground may be made. If so, UST may not see another bounce until late February.
(ZeroHedge) Back in 2011, Standard & Poor's shocked the world, and the Obama administration, when it dared to downgrade the US from its vaunted AAA rating, something that had never happened before (and led to the resignation of S&P's CEO and a dramatic crackdown on the rating agency led by Tim Geithner).
Nearly seven years later, with the US on the verge of another government shutdown and debt ceiling breach (with the agreement reached only after the midnight hour, literally) this time it is Warren Buffett's own rating agency, Moody's, which on Friday morning warned Trump that he too should prepare for a downgrade from the one rater that kept quiet in 2011. The reason: Trump's - and the Republicans' and Democrats' - aggressive fiscal policies which will sink the US even deeper into debt insolvency, while widening the budget deficit, resulting in "meaningful fiscal deterioration."
The Euro may be signaling an end to the uptrend.
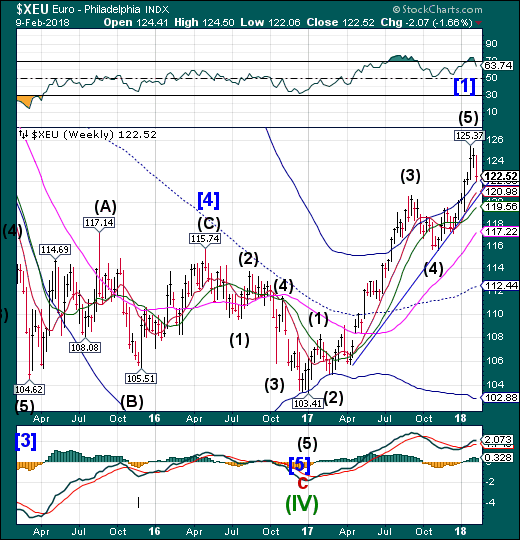
The euro reversed down to challenge its Cycle Top at 122.00. A decline beneath the Cycle Top suggests the rally may be over. A sell signal lies at the trendline and Short-term support at 120.98.
(Reuters) - Germany should not dictate economic policies to its euro zone partners, said Social Democrat Olaf Scholz, who is expected to become finance minister in a new coalition government led by Chancellor Angela Merkel’s conservatives.
His comment, in an interview with Der Spiegel magazine published on Saturday, is the clearest sign yet that Germany plans to soften its insistence on strict fiscal discipline in the currency bloc.
“We don’t want to dictate to other European countries how they should develop (economically),” said Scholz, the pragmatic mayor of Hamburg widely expected to succeed conservative Wolfgang Schaeuble, who for eight years was the face of austerity.
Euro Stoxx loss of support creates a vacuum.
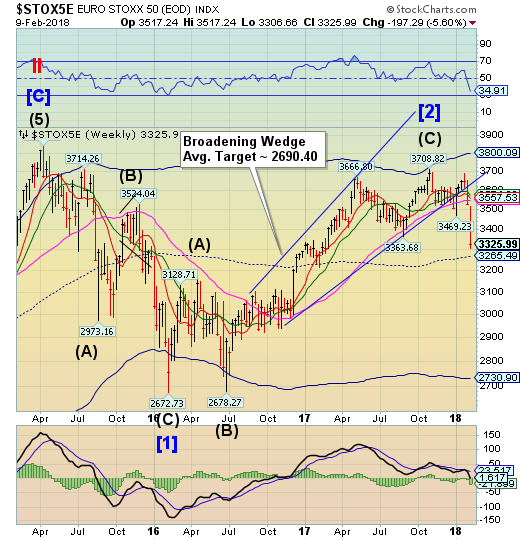
The Euro Stoxx 50 Index succumbed to gravity as it fell over 6% before a weak bounce on Friday. It may have triggered a Head & Shoulders formation (not shown in the weekly chart) that implies another minimum 10% decline. The next few days may see an acceleration of the decline.
(CNBC) European stocks closed lower Friday, as investors monitored global concerns about soaring volatility and rising borrowing costs.
The pan-European STOXX 600 ended down by 1.45 percent, with all sectors and major bourses in negative territory. Britain's FTSE 100 closed the trading week 4.2 percent lower while the French CAC 40 and German DAX slipped 5.5 percent and 5.3 percent respectively.
Global markets have been swinging between gains and major losses over the past week, as concerns over higher interest rates continue to dwell on investors' minds.
The Yen breaks above its consolidation range.
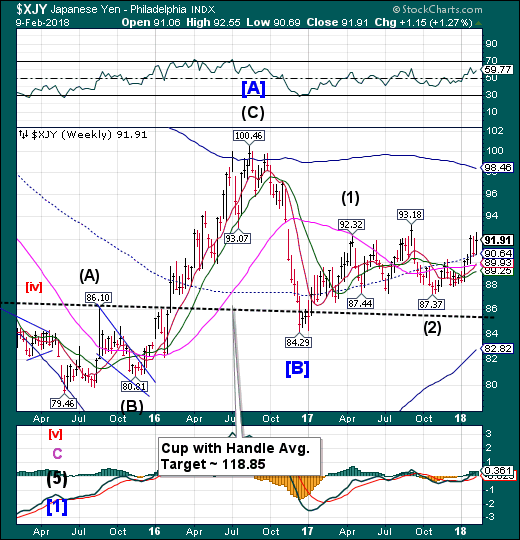
The Yen broke above its consolidation range as it probes new highs. The Cycles Model suggests the surge of strength has a few days left. A lot may happen in that time.
(Bloomberg) Investors are betting that the Japanese yen will do better this year than its haven counterpart, the Swiss franc.
With waning political risks in Europe and the Swiss National Bank reluctant to move away from its rhetoric on a “highly valued” currency, options markets favor the yen and analysts see the franc weakening. Add in speculation that the Bank of Japan will take tentative steps toward normalizing policy before the SNB, and that’s leading Investec Asset Management Limited to short the Swiss currency against the yen.
Nikkei declines to Long-term support.
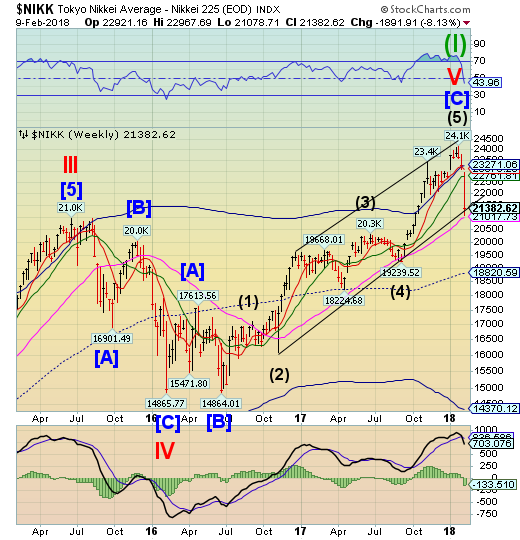
The Nikkei declined to challenge the lower Diagonal trendline and Long-term support at 21017.73. A break of those supports may force an unwind of the entire gain made since February 2016.
(Reuters) - Japan’s Nikkei share average tumbled on Friday after another torrid day for Wall Street, with oil-related stocks leading the broad declines as crude prices slumped.
The Nikkei finished down 2.3 percent at 21,382.62 bringing its weekly loss to 8.1 percent.
The broader Topix was 1.9 percent lower at 1,731.97, down 7.1 percent for the week.
U.S. Dollar breaks above its Cycle Bottom.
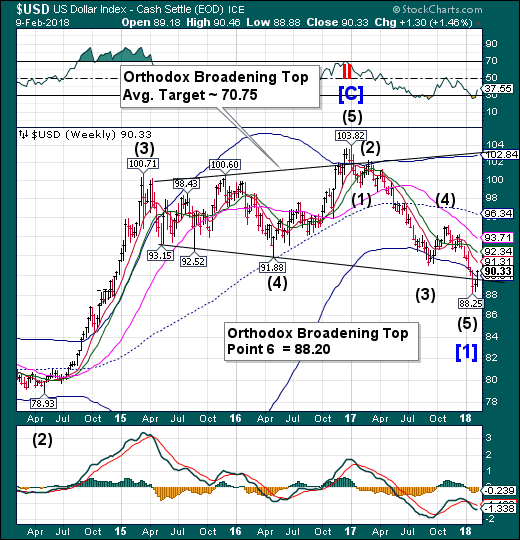
USD broke above its Cycle Bottom support/resistance, leaving a near miss on “Point 6.” TheCycles Model indicates the rally may continue into early March before letting up. There is a Broadening Top “Point 7” target near the weekly mid-Cycle resistance at 96.34.
(Reuters) - The battered U.S. dollar is unlikely to rebound this year, even though the Federal Reserve is expected raise interest rates at least three times, according to a Reuters poll of strategists, who aren’t expecting any major moves either.
Rising U.S. wage inflation and expectations for an end to European Central Bank stimulus hit bond markets and nudged U.S. Treasury yields up to four-year highs last week, leading to the worst sell-off in stock markets in six years.
Although bond yields have pulled back from those peaks, they remain elevated and are not expected to return to previous lows. But the rout across world stocks had only a muted effect on currencies, leaving the weak dollar trend intact.
.Gold challenges Short-term support.
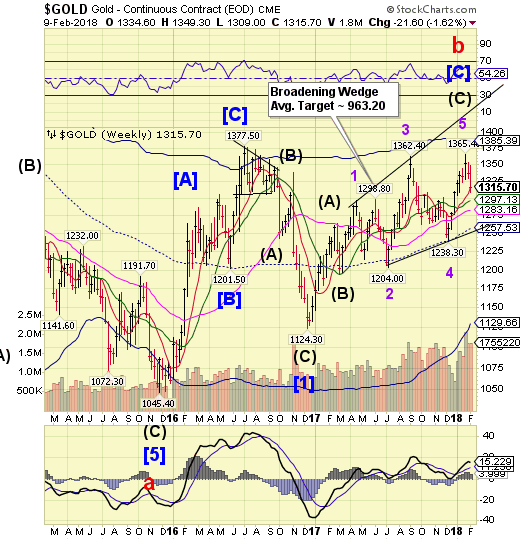
Gold declined to challenge weekly Short-term support at 1315.67. A further decline beneath that level may produce a sell signal.If so, the proposed target appears to be the lower trendline of the Broadening Wedge formation near 1250.00
(Economic Times) The yellow metal has made a good start to the year, as the prices rose around 3.5 per cent in January -- its third consecutive month of gains -- and the biggest monthly increase since August 2017. Prices fell to a low of $1,300 per ounce and rose to high of $1,366. The commodity finally settled at $1,344.7. On MCX, gold prices rose 3.3 per cent last month, closing at Rs 30,117 per 10 grams. On a YtD basis, gold prices have gained 1.2 per cent in the international market, while MCX gold prices have gained 2.9 per cent during the same time
Crude Oil challenges Intermediate-term support.
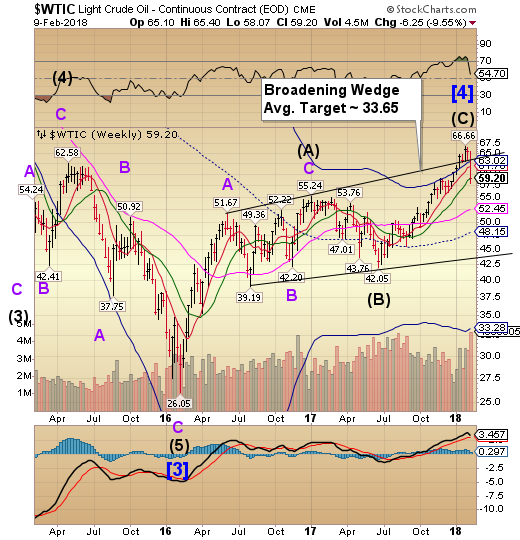
Crude declined to challenge weekly Intermediate-term support at 59.15, putting it on a sell signal. The proposed decline may take WTI to its mid-Cycle support at 48.15.However, a deeper decline may trigger the Broadening Wedge formation with a much lower target.
(CNBC) A crushing oil price rout extended into a sixth day, with U.S. crude nearly falling below $58 a barrel, as rising production, a strong dollar and a broad financial asset sell-off combined to weigh down the market.
The drubbing started last Friday and gathered steam this week, putting U.S. West Texas Intermediate crude on pace for its worst weekly performance in two years.
Shanghai SE 50 Index has a very bad week.
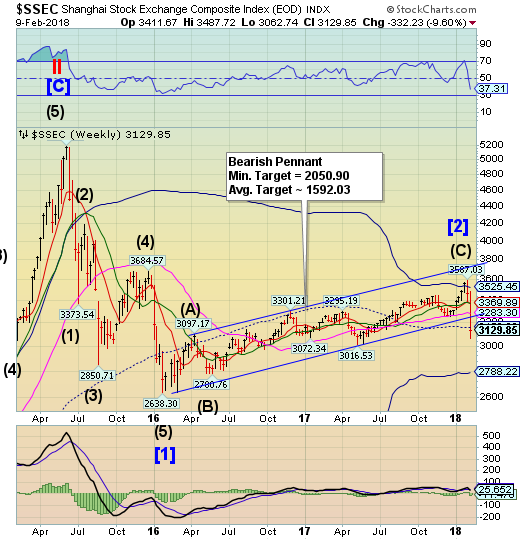
The Shanghai Indexdeclined through the Pennant trendline and mid-Cycle support at 3156.83.The proposed sell signal was activated early last week.The bounce may have been stopped by mid-Cycle resistance, indicating a probable continuation of the decline. The immediate target may be beneath the Cycle Bottom at 2788.22.
(ZeroHedge) Update 0950ET: Things went from bad to worst very fast...*CHINA China H-Shares INDEX SLIDES 5%*Shanghai Composite INDEX DROPS 5.3%*CHINA SSE (LON:SSE) 50 INDEX OF BIG CAPS DROPS 7.5% *Tencent Holdings Ltd ADR (OTC:TCEHY) DROPS 5.1% TO TRADE BELOW HK$400
This is the big caps worst day since the Aug 2015 devaluation crash, and the worst week (unless The National Team steps in) since Lehman...
The Banking Index challenges Intermediate-term support.
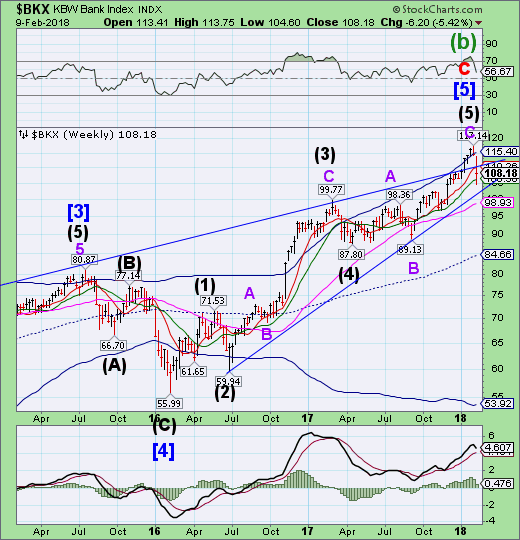
BKX declined through Intermediate-term support at 106.98 before closing the week above it.This activates the sell signal.Confirmation of the signal comes beneath the Ending Diagonal trendline at 102-103.00, which implies a target near the February 2016 low.
(Barrons) After the financial crisis, regulators kept banks on a short leash in terms of returning capital to shareholders via dividends and share repurchases.
But that grip has loosened as the health of these banks has improved, along with their capital levels. The benefits of the tax bill, which lowers the U.S. corporate rate from 35% to 21%, should help too. All of this has improved the dividend prospects for this group, which should look good for the next few years, barring a significant downturn or recession.
(Bloomberg) By signaling hawkish policy intentions that went beyond the market consensus, the Bank of England did more than convey its updated views on the U.K. economy and the prospects for monetary policy tightening. It also highlighted the ongoing gradual shift by central banks in advanced countries toward less stimulative policies.
This evolution makes sense, given domestic economic conditions. It is not sidetracked by the current bout of market volatility. But it also raises interesting system-wide questions that have no definitive answers, at least yet.
(Bloomberg) China's banks are in trouble again.
With global markets in turmoil, the sell-off on the mainland hasn't generated as many headlines. That shouldn't be the case. In just four days, banks on the CSI 300 Index tumbled on average almost 11 percent, erasing the benchmark's entire gain this year.
