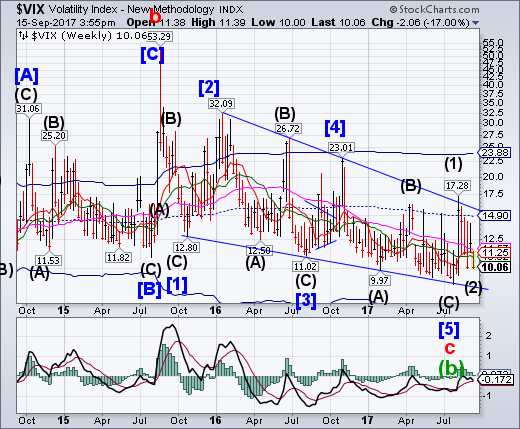
VIX may have completed its corrective decline with a low at 10.00 this week. It is beneath all technical supports and must rise above its Intermediate-term resistance at 10.92 for a buy signal, with further confirmation above weekly mid-Cycle resistance at 14.90 and the Ending Diagonal trendline near 15.00.
Markets are under-pricing political risk, says James Butterfill, head of investments and research at ETF Securities. He told Daybreak Europe’s Caroline Hepker and Markus Karlsson the VIX ought to be much higher. Butterfill also spoke about central bankers’ attempts to deflate what he calls a ’bond balloon’.
SPX challenges the Trump trendline.
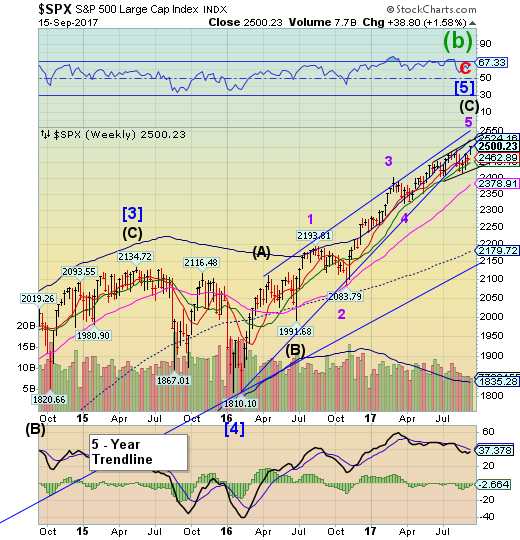
SPX challenged its Trump trendline as it ramped higher on Friday. Another all-time high was made. This appears to be an anomaly. Broken Ending Diagonal trendlines are rarely challenged like this, much less making a new high. One possiibility is that it may have formed a Breoadening Wedge formation. If so, a decline beneath the formation at 2450 may be viewed as a sell signal.
U.S. stocks rose to record levels Friday and posted strong weekly gains.
The Dow Jones industrial average rose 64.86 points to close at 22.2686.34, a record. Boeing (NYSE:BA), 3M and Apple (NASDAQ:AAPL) contributed the most to the gains. The index also posted an intraday high of 22,275.02
The S&P 500 also notched record highs, advancing 0.2 percent to finish at 2,500.23. Friday also marked the first time the index broke above 2,500. Information technology and financials were among the best-performing sectors.
NDX does not confirm the SPX.
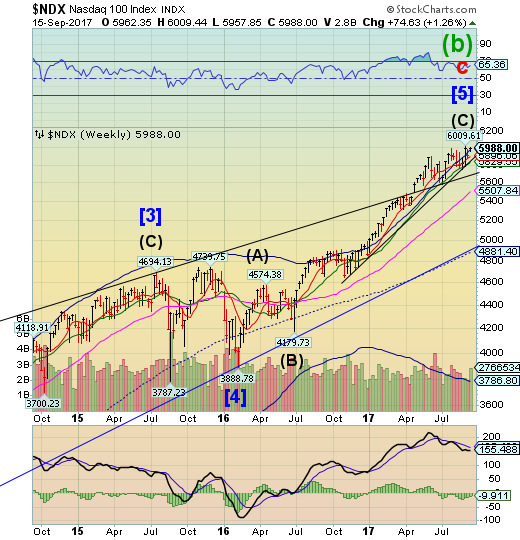
NDX did not exceed the high left on September 1. That is a non-confirmation of the blue chips asign of weakening and possibly a reversal. A decline beneath Intermediate-term support at 5829.55 and its Trump election trendline may produce a sell signal.
I remember the first time I saw the movie “Poltergeist.” It scared the $*#@ out of me, and I slept with the lights on for a month.
Recently, I got a chance to catch a rerun. It certainly wasn’t the same experience. It was kind of like eating a “twinkie” as an adult, the sponge cake and creamy filling aren’t nearly as delicious as I remembered them. “Poltergeist” is now more of a “campy” flick with bad special effects.
But the run up in the markets over the last few days, on really no news at all, reminded me of the scene where “Carol Anne” is pointing to the static filled television screen proclaiming “they’re back.”
High Yield Bond Index makes a new all-time high.
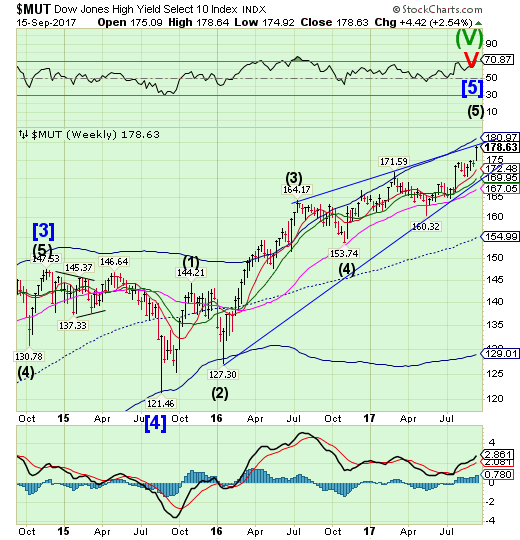
The High Yield Bond Indexwithin a tick of its all-time high, closing at the upper trendline of its Ending Diagonal formation.Both stocks and high yield bonds had an inversion this week. An indicated low became a high, instead. This may predict an end of a trend, so we must stay vigilant.
The private equity industry will continue to play a growing role in financial markets, fueled by low yields and investors’ willingness to forgo traditional risk protections, Michael Milken said.
Milken, who helped pioneer the junk bond market at Drexel Burnham Lambert Inc., said Thursday in an interview with Bloomberg Television in Singapore:
This is their golden age ... You can leverage, you can borrow without covenants, and so for equity holders it affords you very unusual rates of return.
USB takes a breather.
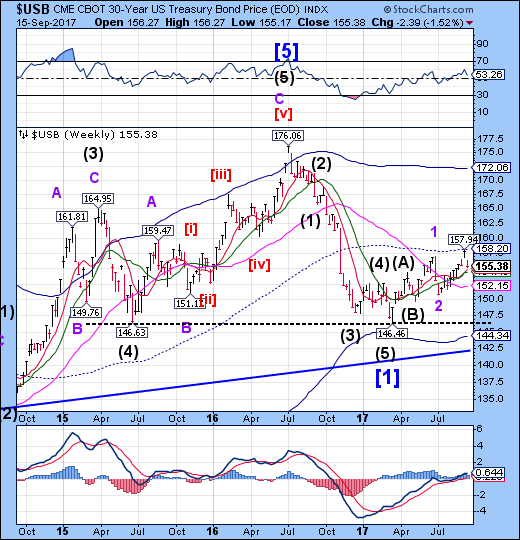
The Long Bond pulled back to its Intermediate-term support at 154.43 for a breather.This is not unusual to have happen after a breakout. A resumption of the rally may take USB above mid-cycle resistance at 158.20.Should the right shoulder of a potential Head & Shoulders reach proportionality, the rally may go to 165.00 or as far as the Cycle Top at 172.06.
U.S. government bonds weakened for a fourth consecutive day after a key measure of consumer prices rose in August.
The yield on the benchmark 10-Year U.S. Treasury note edged up to 2.199% from 2.194% on Wednesday, notching its longest streak of increases since early July. Yields rise as bond prices fall.
Yields initially spiked after Labor Department data showed that U.S. consumer prices rose last month at the strongest rate since January. The consumer-price index ticked up 0.4% in August from the prior month, spurred by an increase in gasoline prices after Hurricane Harvey caused a temporary shutdown in Texas refineries.
The euro pulls back.
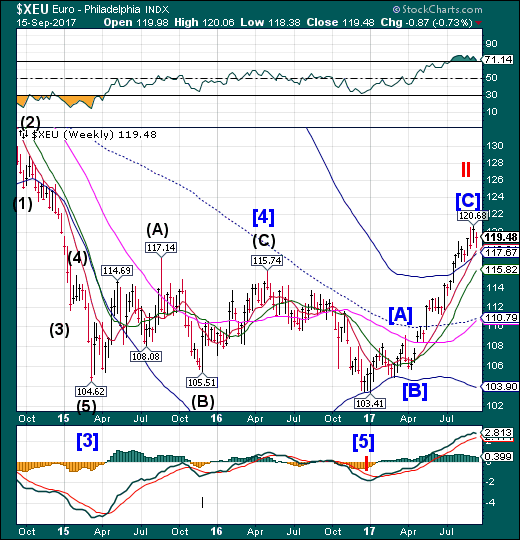
The euro pulled back to Short-term support at 118.02 before bouncing into the close of the week. Per the Cycles Model, weakness has set inthis week. A decline beneath the Cycle Top at 117.67 may be a sell signal. Traders are looking for a higher euro, but it may have reached a technical limit to this rally.
It looks like two of the world's most important currencies might be reacting to politics rather than economics.
The US dollar index has fallen by about 11% against a basket of its peers since US President Donald Trump's inauguration. It's now at its lowest level since January 2015.
The euro, meanwhile, has been climbing since April 2017, and is now at its highest level since January 2015. It broke through 1.200 against the dollar last week, but has since reversed some of those gains.
A Deutsche Bank (DE:DBKGn) Asset Management team argues that the dates here are key because they suggest that the US and French elections might be the "major influence" on the currencies' moves.
Euro Stoxx challenges Intermediate-term resistance.
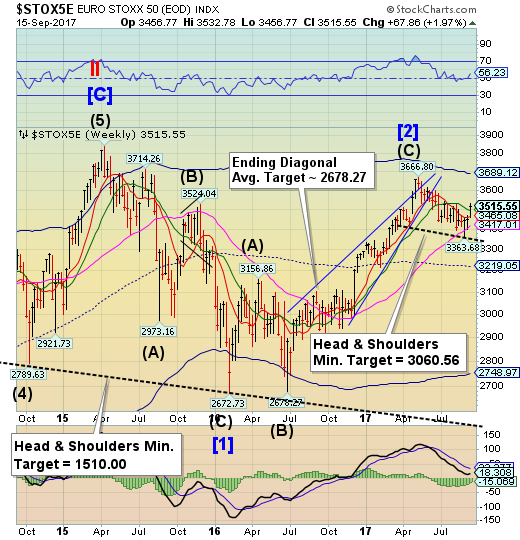
The Euro Stoxx 50 Index appears to have completed the right shoulder of its Head & Shoulders formation as it bounced above Intermediate-term resistance at 3494.18. The Cycles Model suggests that this period of strength may be about to end. A reversal has the potential to set a cascading decline unto motion over the next several weeks.
European shares dipped on Friday as another North Korean missile launch softened appetite for riskier banks and miners but still scored their strongest week since July as attractive valuations tempted investors.
The pan-European STOXX 600 and euro zone stocks. STOXX 50E both fell 0.3 percent, while export oriented FTSE. FTSE slumped 1.1 percent as the pound spiked higher after a Bank of England policymaker opened the door for a possible rate increase in the coming months.
The yen pulls back.
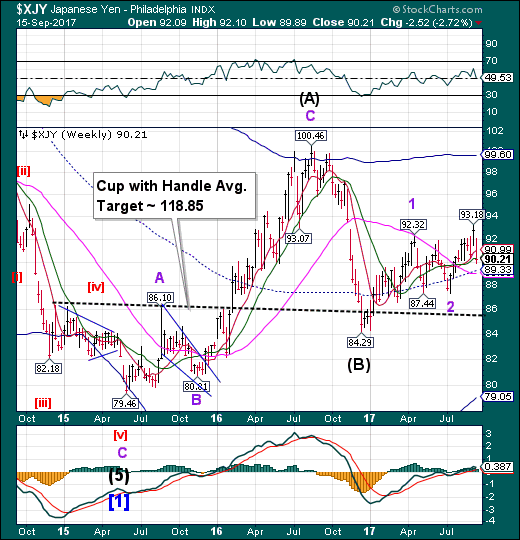
The yen pulled back to challenge Intermediate-term support at 90.33 after its breakout. A Master Cycle low was due this week which accounts for the decline. The decline may extend to the mid-Cycle support at 89.33 before a reversal. It remains on a provisional buy signal.
The yen may advance to 100 against the dollar by the year end as investors conclude that Japan is still failing to sustain inflation gains five years after Abenomics was introduced, according to HSBC Holdings Plc (LON:HSBA).
HSBC, which holds the most bullish call on the currency among analysts surveyed by Bloomberg, also expects the benchmark Treasury yield to fall to 1.9 percent, which will support the yen as Japanese funds cut back purchases, according to David Bloom, the global head of FX strategy in London.
Nikkei bounces above Long-term support.
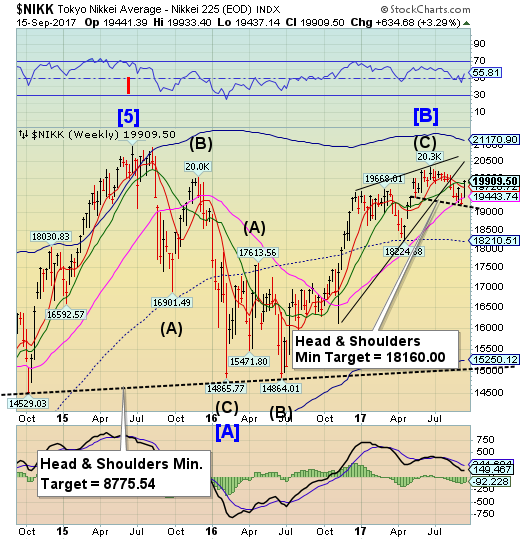
The Nikkei bounced above Long-term support to retrace 64% of its 2017 losses, stopping just above Intermediate-term support/resistance at 19857.38. The bounce also created a probable new Head & Shoulders formation. Should the Nikkei reverse next week, it tells us what we may expect in the next two weeks or so.
Japan's Nikkei share average ended higher on Friday and posted its biggest weekly gain in ten months as a stronger dollar saw investors buying shares of exporters, shrugging off North Korea's ballistic missile launch that dented risk appetite in broader Asia. Prior to the Tokyo financial markets' open on Friday, North Korea yet again fired a missile that flew over Japan's northern island of Hokkaido far out into the Pacific Ocean, South Korean and Japanese officials said.
US dollar consolidates beneath its Cycle Bottom
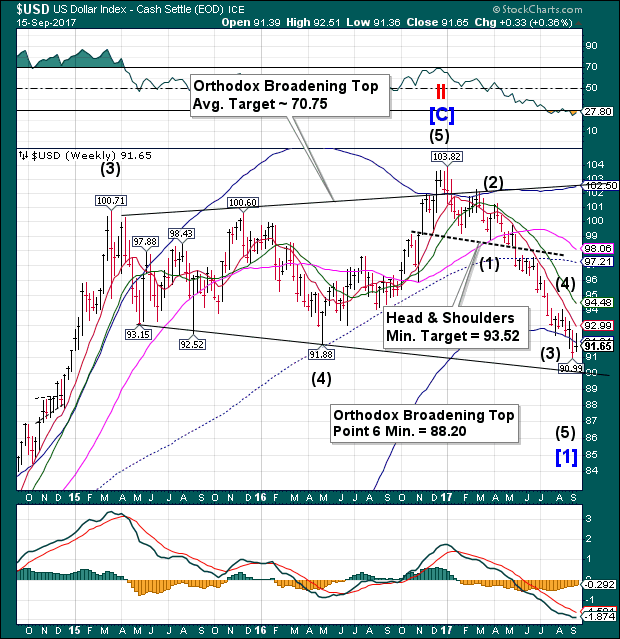
USD formed an inside consolidation, but closed beneath its Weekly Cycle Bottom support at 91.91, with the probability of continuing to its Orthodox Broadening Top short-term target. The lower trendline of the Orthodox Broadening Top at 90.00 may be the next attractor, but the formation calls for a breakout beneath the trendline, as indicated by “point 6.”
The US dollar has struggled under the sudden strength of Sterling and has continually been put under pressure by a buoyant euro.
It’s been somewhat of a rollercoaster ride for currency markets this month, and much of the activity has centredaround the US dollar and its relationships with its key currency pairings. Positive economic data from the US and a robust USD at the end of August, as the US Dollar showed impressive intra-day growth, have given way to a very different picture, beginning at the start of September and continuing over the past few weeks.
Gold pulls back from a seasonal high.
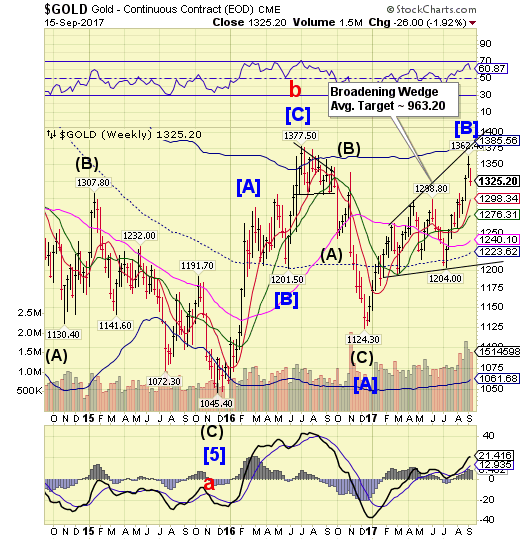
Gold pulled back from its seasonal high. The Cycles Model suggests thedecline may continue through early October with the probability of a short-term bounce in the next week.
Gold prices might see some more consolidation next week as the metal’s safe-haven allure continues to lose traction, according to analysts. But, the Federal Reserve meeting could offer surprising support to the yellow metal.
Even bullish gold analysts are admitting that the precious metal could retreat a bit further next week, especially after commodity markets chose to ignore another North Korean missile strike and a London terrorist attack on Friday.
Crude bounces again to Long-term support.
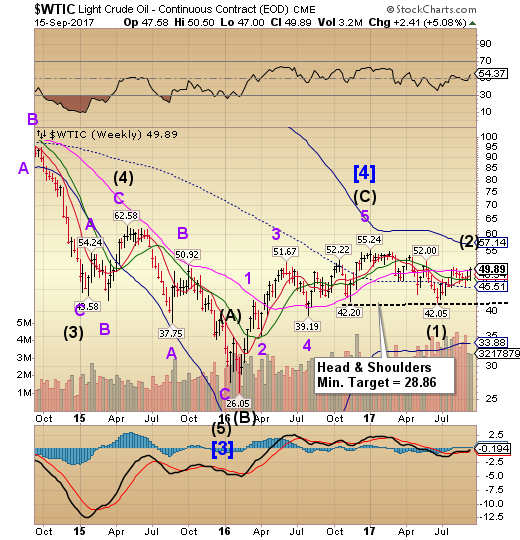
Crude bounced again in a 7-week consolidation to challenge on Long-term resistance at 49.75. The final bit of Cyclical strength may have played out last week. The sell signal is potentially in play with confirmation beneath mid-Cycle support at 45.51.
Oil prices settled higher racking up their biggest weekly gain since July on Friday amid rising expectations that higher oil demand will reduce excess crude supplies to Opec’s five-year average target.
On the New York Mercantile Exchange crude futures for October delivery rose $0.00 to settle at $49.89 a barrel, while on London's Intercontinental Exchange, Brent gained 0.23% to trade at $55.60 a barrel.
Opec said production in August fell by 79,000 barrels a day (bpd) to 32.76 million as falling production from Venezuela, Iraq, the UAE and Saudi Arabia offset rising output from Nigeria.
Shanghai Index losing altitude.
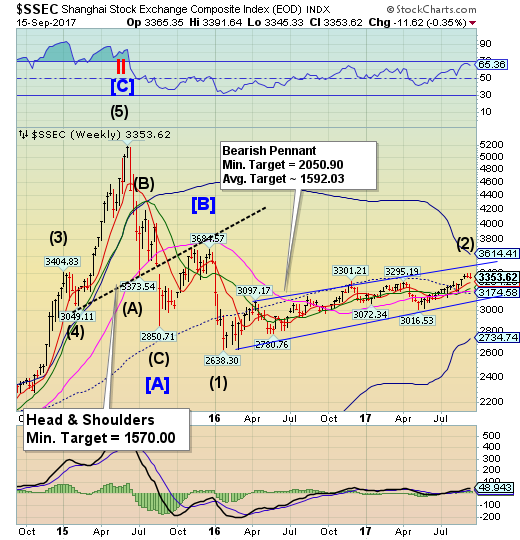
The Shanghai Index has started to lose altitude as it winds up its period of strength. A decline beneath Short-term support at 3294.23 puts it on the alert for a potential sell signal. The Shanghai Index now enters the negative season for up to a month. The potential for a sharp sell-off is rising.
Pretty soon, China bears will be as rare as the Giant Panda.
At least that’s what Bloomberg suggested in a story about how Chinese markets have continued to defy proclamations that country’s economy would soon collapse in an avalanche of bad debt, exposing rampant corporate fraud. Or that a rash of outflows and the pressure of short sellers would force a massive yuan devaluation. Or that the exposure of rampant fraud and abuse in its corporate sector would tank local markets, which rely heavily on shady investment products.
The Banking Index challenges Intermediate-term resistance.
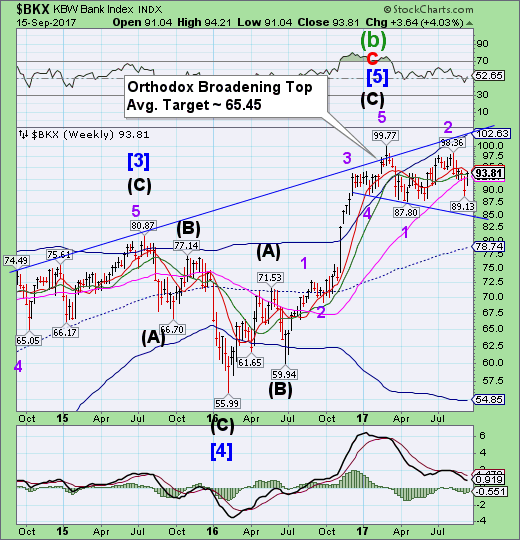
BKX bounced from prior support levels to challenge Intermediate-term resistance at 93.79. It remains on aprovisional sell signal. If the Orthodox Broadening Top formation is correctly identified, the next level of support may be the mid-cycle line at 78.74.
Update: And... she's gone: EQUIFAX SAYS CIO AND CHIEF SECURITY OFFICER ARE RETIRING
One week after what may be the biggest security leak in US history, when Equifax (NYSE:EFX) belatedly admitted that hackers had made off with over 143 million private data profiles, sending the company's stock 37% lower in the past week...
... leading to a massive scandal which will go through at least one round of Congressional hearings in which company CEO Richard Smith will have to explain why the company waited for weeks before making this unprecedented data breach public (a breach which came due to a vulnerability the company was aware of and should have patched months prior) and will likely culminate with prison time for one or more company executives, questions have emerged if Equifax was involved in another cover up, this time involving the background of its Chief Security Officer.
U.S. banks, already under pressure from slower loan growth and low interest rates, could be facing yet another challenge as a rising number of Americans fall behind on their credit card payments.
Several large U.S. banks and credit card companies, including Capital One Financial Corp (NYSE:COF) (COF.N) and JPMorgan Chase & Co (NYSE:JPM) (JPM.N), reported a rise in credit card delinquency rates for August, the second consecutive rise after falling for four months.
While the rates remain significantly below the levels hit during the 2008-2009 financial crisis, rising delinquencies could result in higher loan losses for lenders.
One week ago, in his weekly "flow report", BofA's Michael Hartnett looked at the "Disconnect Myth" between rising stocks and sliding yields and succinctly said that there is "no disconnect between stocks & bonds."
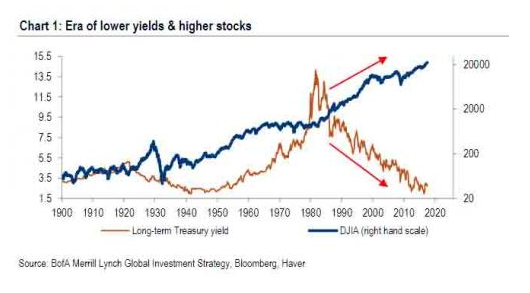
Why? The reason for low yields and high stocks was simple: trillions in central bank intervention. The result is an era of lower yields & higher stocks, or as the chart above shows, an era in which the alligator jaws of death are just waiting for their moment to shine. Here are the three phases:
- 1981-2009 (disinflation/Fed put), 10-Year Treasury yields down from 15.8% to 3.9% = 10.7% annualized S&P 500 returns;
- 2009-2016 (Fed QE/global ZIRP) yields down from 3.9% to 2.4% = 14.9% SPX ann. return;
- 2017 YTD (ECB/BoJ QE) yield down to 2%, SPX annualizing 17.5%.
Fast forward to today, when in the interim period stocks have continued to rise, hitting new all time highs in both the US and globally, oblivious of any news and fundamental developments - as one would expect from a massive asset price bubble, and in line with what Hartnett has dubbed a Liquidity Supernova.
