We had seen signs global equities were looking vulnerable to a slight drawdown, where specifically onshore and offshore Chinese and US equity markets had really only gone one way in 2018 and some of the heat needed to come out of the market.
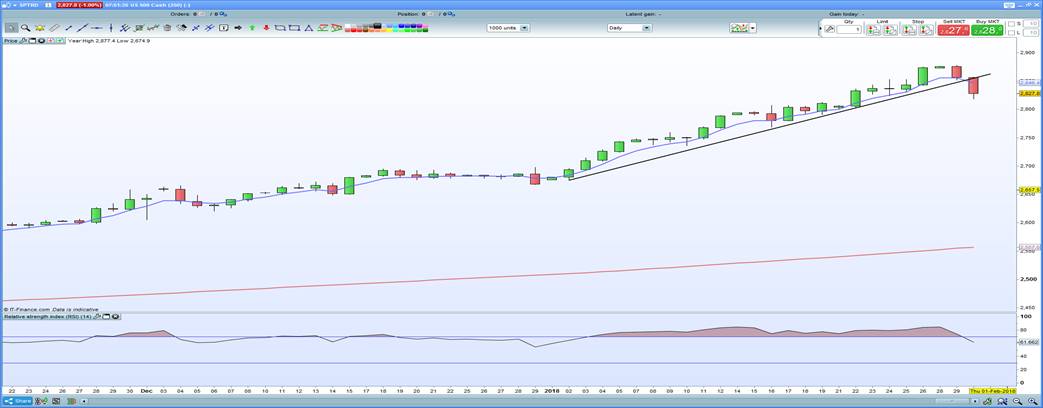
The deflation in asset prices from overextended asset prices is certainly welcomed by many, although (in my opinion) it shouldn’t lead to a material drawdown of anything say greater than 5% or so. That said, I would be hesitant to start buying risk again here, given the S&P 500 looks set to close through the 2018 uptrend and 5-day exponential moving average (seen at 2856 and 2845 respectively – see chart below) and while this technical development doesn’t necessarily signal a greater downside move, it does suggest a change of behaviour from market participants and the bulls losing their dominance. At the very least, we can expect choppy price action in the short-term and perhaps an end to the strong trending conditions we have seen really since 1 January. That said, we have some big corporates due to report through this week and that could support the bulls cause once again.

There hasn’t really been one smoking gun behind the change in market behaviour and it seems the market has almost talked itself into this sell-off, with an increased focus on the moves higher in various developed market bond yields. With the selling in the long-end of the curve inspired by global growth at around 4% in Q4 (the highest clip since 2011), with the central bank inspired liquidity premium also coming out of the market. Importantly, we also need to look at the inflation-adjusted yield, or ‘real’ yield, and here we can see US 5-Year ‘real’ Treasuries sitting now at 51bp (+3bp on the day) and the highest since December 2015, while the 10-Year ‘real’ rate is at 63bp and the highest since July 2017. So when we include the move higher in real rates, back by a further 5.3% move higher to 14.56% in implied S&P 500 volatility (i.e. the “VIX” index) and a slight widening of high yield credit spreads, we can see a decent tightening of financial conditions.

I am sure the Federal Reserve would not be overly concerned by this, in fact, they may even welcome it, although the same can’t be said for Donald Trump who would have loved to have gone into today's State of the Union speech (scheduled for 13:00 aedt) with euphoric stock market conditions and pushing even higher.
One would argue that if it weren’t for the fact that the USD is largely unchanged on the session then US equities could even be lower than the 1.2% fall we are seeing in the Dow Jones and 0.9% fall in the S&P 500. That said, relative to the sanguine conditions traders and investors have been accustomed to for months, the moves in the past 24 hours almost feel wild. However, it is certainly nice to see a bit of two-way price action here, and we question if there is much more to play out here.
Looking at the moves, we can actually see buying in utilities, with a 0.3% gain in the S&P utilities ETF (NYSE:XLU) and this ETF looks to be putting in a base. Elsewhere it's tough going, with health care getting hammered, as has energy, while materials and financials have also seen a reasonable downside. Volumes through the S&P 500 have perked up, with the notional value some 27% above the 30-day average, with 80% of stocks lower on the day.
In terms of how this affects Asia, well, clearly the lead is not going to inspire, but let’s not forget that S&P 500 futures were some 0.5% lower when the ASX 200 closed at 16:10 aedt, so some of the falls overnight have been discounted. S&P 500 futures were trading at 2839 when the local index closed the session, so the fact they now recede at 2827, shows we have a further 0.4% to price into our market and the Aussie SPI Futures go some way to reflecting this, with the futures index just 13 points lower than where the ASX 200 cash market shut. With these dynamics in mind, our opening call for the ASX 200 currently sits at 6000, although there seem few reasons for investors to be buying into the open given the slight uncertainty that perhaps this pullback in risk sentiment could manifest into something greater.
So watch price action in the ASX 200 from 10:10 to 10:15, to see the bid come out of the market and the sellers having a greater say. What is of interest, though, and what could support, is a focus on BHP and CBA ADR (American Depository Receipt), which both indicate we could see a flat open this morning. In fact, CBA could open a touch higher. Another consideration is that today is month-end and the losses predicted by SPI futures should only add to the 0.7% fall we have seen thus far in January and we are unlikely to have any help from Asia either, with further falls expected in the Hang Seng, H-Shares and Nikkei.
In terms of event risk, there will be some focus on Trump State of the Union speech, with traders also likely tweak positions and exposures ahead of the upcoming US data, in the form of Employee Compensation Index (ECI), Chicago PMI, ADP private payrolls and of course the FOMC meeting (06:00 aedt). However, the greater focus is clearly on the Aussie Q4 CPI print at 11:30 aedt, where economists expect headline CPI to print 0.7% Q/Q (2% Y/Y), while the trimmed mean inflation print is expected at 0.5% Q/Q (1.8% Y/Y). Trading this event is tough, as we may see the headline print beat, helped on by higher oil prices, while trimmed mean CPI could miss, or different permutations of these outcomes. However, it’s really the trimmed mean inflation print we want to focus on and given the Aussie 30-day bill futures are pricing in 5.5bp of hikes by the May meeting, if we get this coming in at 0.8% and above the AUD/USD will take off as the market goes someway to pricing in the May meeting as a ‘live’ meeting.
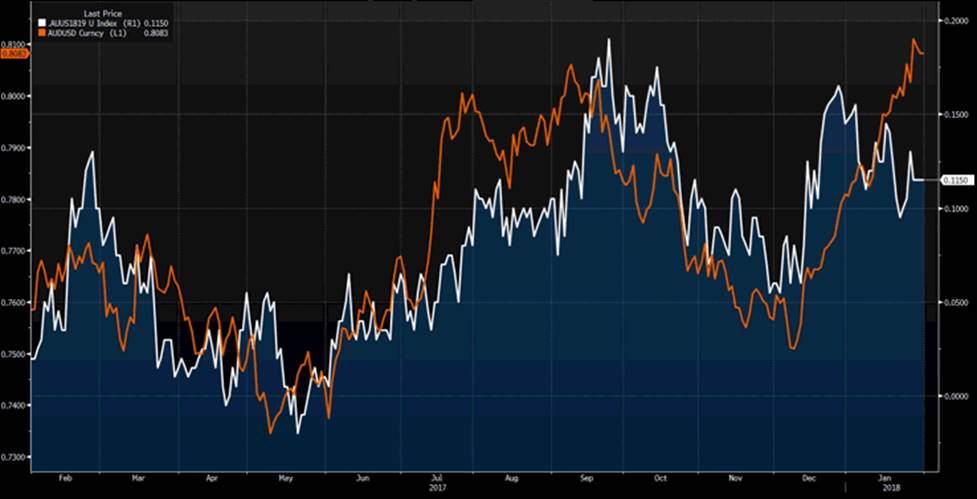
Of course, we could see inflation come in below forecast and this could take some of the heat out of the AUD, especially with the Aussie rates market pricing in 41bp of tightening in 2019, which some will say is punchy. At $0.8080 AUD/USD has come off a session high of $0.8114, while the trade-weighted AUD sits at the highest levels since October having rallied 4% since 7 December.
Orange line – AUD/USD, white line – Relative Aussie vs US interest rate hike expectations for 2019. AUD/USD has diverged from rate expectations, but could be due some mean reversion.

