Stuck In The Middle“Trying to make some sense of it all,
But I can see that it makes no sense at all,
Is it cool to go to sleep on the floor,
‘Cause I don’t think that I can take any more
Clowns to the left of me, jokers to the right,
Here I am, stuck in the middle with you” – Stealers Wheel
“Trying to make some sense of it all,
But I can see that it makes no sense at all,
Is it cool to go to sleep on the floor,
‘Cause I don’t think that I can take any more
Clowns to the left of me, jokers to the right,
Here I am, stuck in the middle with you” – Stealers Wheel
On Tuesday, I updated our weekly analysis. To wit:
“With Monday’s move higher on reports, the ‘trade war’ with China has been put on hold to negotiate a reduction in the ‘trade deficit.’
When the market broke above the 100-dma, we used some of the cash we had raised on previous rallies to increase the allocation to equities in our portfolios. However, we still maintain an overweight position on cash currently as a hedge against potential market risk.
While the markets moved higher yesterday, it remains contained in a short-term trading range. We are looking to add further exposure to equities if the market can close above last week’s closing high.”
Chart updated through Friday
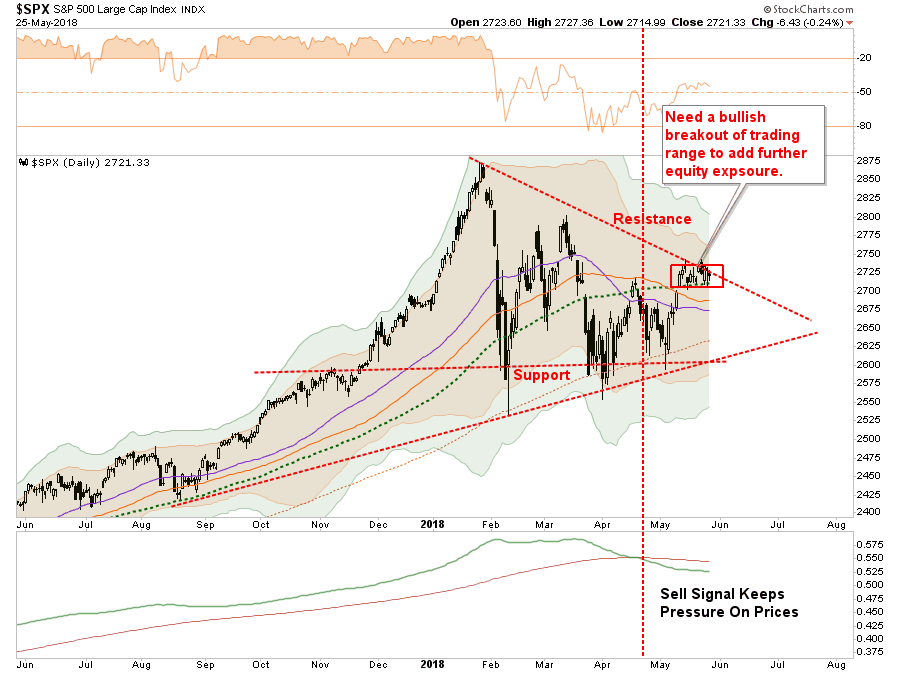
Unfortunately, the S&P 500 was unable to gather enough steam to make the break and remained below the current downtrend resistance line. This keeps our portfolio allocations on hold currently.
Importantly, our current equity exposure remains under strict guidelines:
- Overweight cash in portfolios as the “risk” of a failure has not been absolved as of yet,
- Positions are carrying a “tighter than normal” stop-loss level, and;
- We will quickly add negative hedges as necessary on any failure of support.
I also noted that I would need to update our three potential “pathways” this week as well.
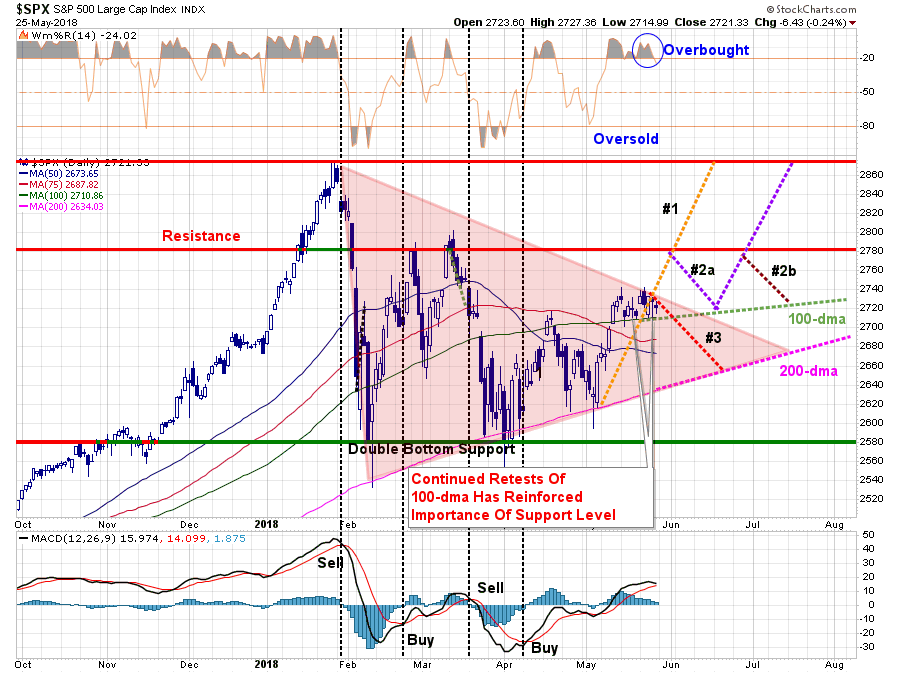
As shown by the reddish triangle, the ongoing consolidation process continues. Eventually, this will end with either a bullish or bearish conclusion. There is no “middle ground” to be had here.
- Pathway #1 – a breakout to the upside on heavy volume that pushes the market through resistance at 2780 and back to old highs. (Probability 20%)
- Pathway #2a and #2b – a breakout to the upside which fails resistance at 2780. The market then either a) retests the 100-dma and then is able to push to old highs, or, b) fails at 2780 a second time and continues the consolidation process through the summer. (Probability 50%)
- Pathway #3 – the market breaks down next week on continued geopolitical worries, economic data or some unexpected catalyst and retests the 200-dma. (Probability 30%)
I have increased the more “bearish” probability from 20% last week to 30% this week given the potential triggering of a short-term “sell-signal.” (Lower panel) If the market struggles next week, a triggering of that signal will increase the downward pressure on equity prices.
We will continue to hold our cash position until the market makes some determination as to its direction.
As my friend Doug Kass noted on Friday:
“More dovish (than expected) Fed comments contributed to a midday reversal in the averages in Wednesday’s trading session. Tactically, I believe that the rally will be short-lived and that, the current high end of the recent trading range (since early February), will prove to be difficult to overcome over the near term.
My concerns are multiple. Most importantly, we are in an advanced economic and market cycle.
The cracks in the foundation of global growth have already surfaced – seen quite visibly in the submergence of the emerging markets over the last five weeks and the growing signs of ambiguity with regard to world-wide economic growth (see this week’s European PMIs, the two year low in Citigroup’s European Economic Surprise Index and the downturn in the global economic Surprise Index).
Bears have been frustrated by the lack of follow through. But the structural supply of listed companies (down from about 7800 in 1999 to 3900 today) and the reduction of the shares outstanding (by 17%) of the remaining public companies when coupled with still steady buying from non-economic players (e.g.,central banks and sovereign wealth funds) buying of stocks and massive money committed to passive products and strategies have limited downside vulnerability and, frankly, has destroyed price discovery.
Bulls have been frustrated by the inability of sales and profit beats to catalyze the markets.
With interest rates and inflation rising and the Federal Reserve retreating from QE — the liquidity that provided a catalyst to the near decade Bull Market are being removed.
Meanwhile, a steady rise in interest rates (particularly in maturities of five years and less) have tapped T.I.N.A. (“there is no alternative”) on the shoulder and is being tempted to ask C.I.T.A. (“cash is the alternative”) to the dance.”
I agree with his points, and “cash” as an alternative has served us well over the last couple of months. This is particularly the case given the market offers much more risk than reward currently and the risk of a bigger correction later this year is an increasing possibility.
Something Just Broke
The big surprise on Friday was the expected reversion in both oil prices and interest rates. As I showed earlier this month, with everyone on the same side of the boat, it was only a function of time until a rising dollar and interest rates collided with oil prices.
“Of course, the cycle of rising oil prices leading to increased optimism which begets bullish bets on oil continues to press prices higher. However, it is also the exuberance which has repeatedly set up the next fall. As shown below, bets on crude oil prices are sitting near the highest levels on record and substantially higher than what was seen at the peak of oil prices prior to 2008 and 2014.”
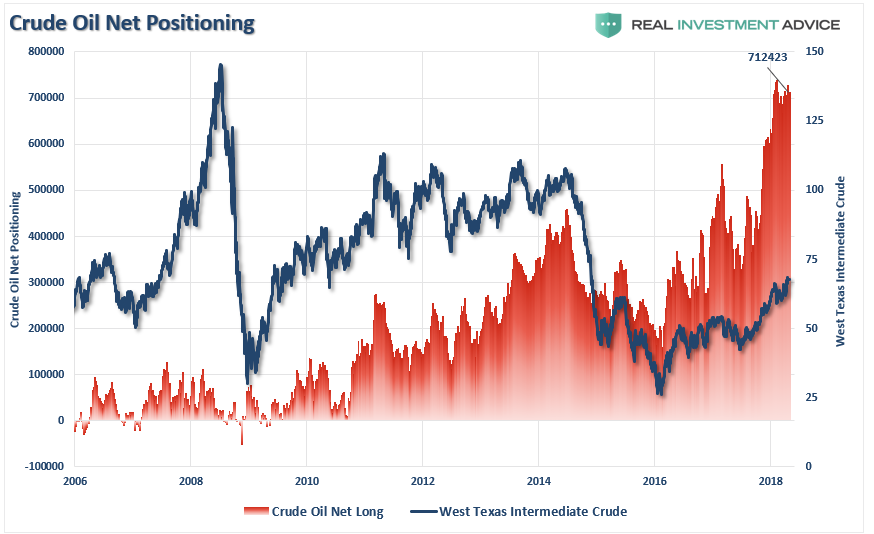
All that was lacking was a catalyst to spark the reversion. Once again, we saw Bob Farrell’s rule #9 in action:
“When everyone agrees, something else is bound to happen.”
The massive positioning was not only in oil, but short bonds as well.
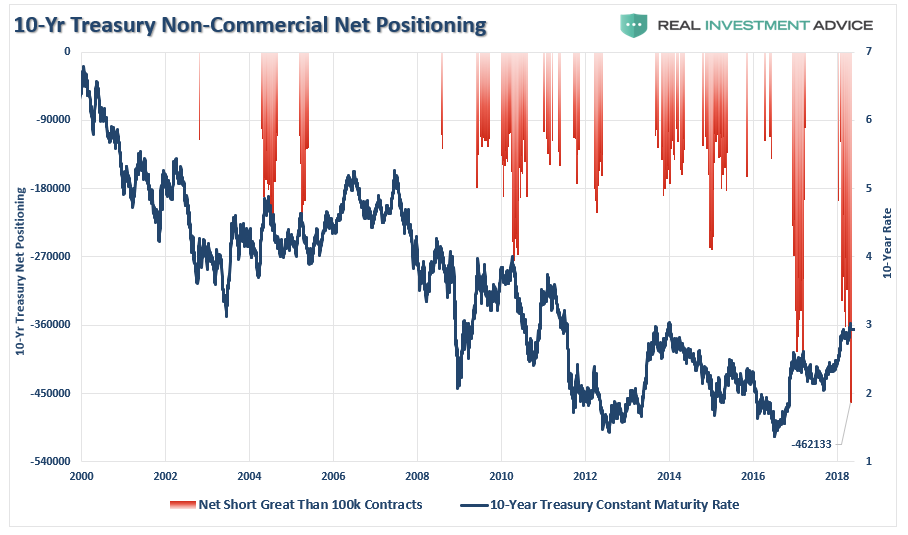
“Previously, such record net-short positioning has been more indicative of peaks in the interest rate cycle as opposed to the beginning of higher rates. You can see this more clearly if we strip out all of the positioning except those periods where net-short contracts exceeded 100,000.”
“With the net-short positioning on the U.S. Treasury at records, the net-short positioning on the eurodollar has also reached a record. Once again, what we find is when the net-short positioning starts to get overcrowded, that too has been a good indication of a bottom in bond prices (or a peak in rates.)”
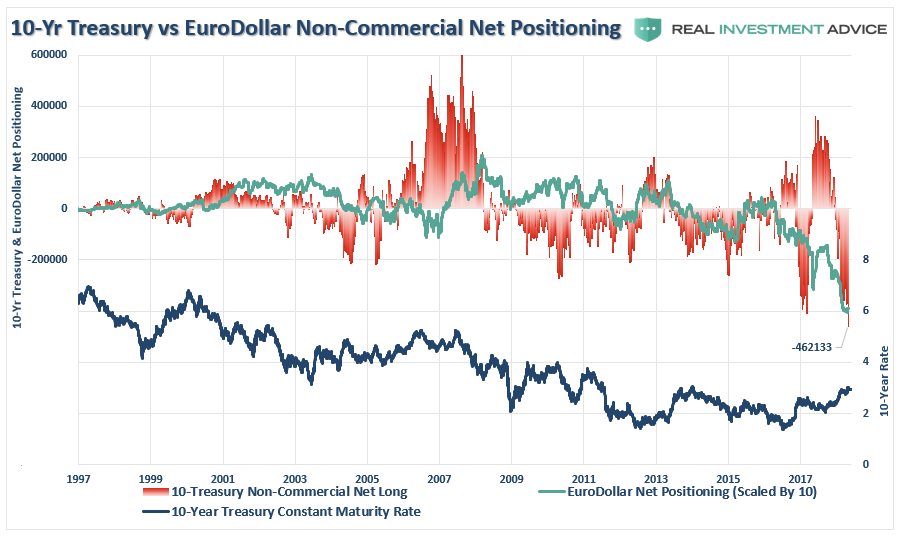
On Friday, “something broke” as rates fell by 1.68% and oil plunged by 4.51%.
This was expected as I penned last week:
“Energy led the advance last week as oil prices pushed to $70/bbl. As we noted previously, with record long positions in oil future contracts, the energy sector extremely overbought and extended, some profit taking from the recent advance, which has only recovered the sector back to January’s levels, is advisable.”
The more important problem is the rise in inflationary pressures, which has had the Fed focused on lifting rates further. The problem is the bulk of the “rise” has been driven by rising oil prices. Unfortunately, rising input costs detract from disposable household incomes on an already cash-strapped consumer. This is the wrong type of inflationary rise which negatively impacts economic growth. As opposed to rising prices driven by rising demand, cost-push inflation simply eats away at discretionary incomes reducing consumptive spending which is 70% of economic growth.
Yes, You Still Need Bonds In Your Portfolio
By John Coumarianos, M.S.
Recently financial advisor Ben Carlson wrote about why bonds are still useful for many investors. The argument comes down to psychology and volatility. After all, high-quality bonds tend to hold up when stocks hiccup. And although inflation can hurt them, accepting that risk has been a reasonable price to pay for the downside protection bonds provide during economic slowdowns, times of fear, and episodes of stock market retreats from over-valuation. Everyone needs a shock absorber in a portfolio, and bonds have served that role reasonably well. If having a lower volatility portfolio prevents you from selling stocks after big declines, then bonds have done their job.
The “spreadsheet answer” on how to allocate capital, according to Carlson, differs from the psychological answer. The spreadsheet answer says young investors should simply own stocks. Since 1926, Carlson notes, stocks have outperformed bonds more than 85% of the time on all rolling 15-year periods calculated on a monthly basis. But, because most people can’t tolerate the volatility of a pure stock portfolio, some bonds are required even for young, aggressive investors.
Beyond The Psychological And Spreadsheet Answers
The problem with both the psychological and spreadsheet answers to the allocation question is that neither of them take valuation and prospective returns into consideration. Are stocks always poised to outperform bonds over long periods? And just how long is long? A decade? Two decades? Carlson is perhaps too sure of answers to these questions. Most investors don’t have, say, five decades.
Recently, Boston-based asset management firm, Grantham, Mayo, van Oterloo (GMO), forecasted that over the next 7 years U.S. bonds (both nominal and inflation-protected) would outperform stocks around the world, save those from emerging markets. Prospective bond returns aren’t exciting, with plain U.S. bonds poised to lose .020% to inflation annually and inflation-linked bonds set to lose 0.40% annually to inflation. But, by GMO’s lights, U.S. bonds and U.S. inflation-linked bonds could outstrip U.S. large cap stocks by 4 and 3.8 percentage points, respectively, on an annualized basis.
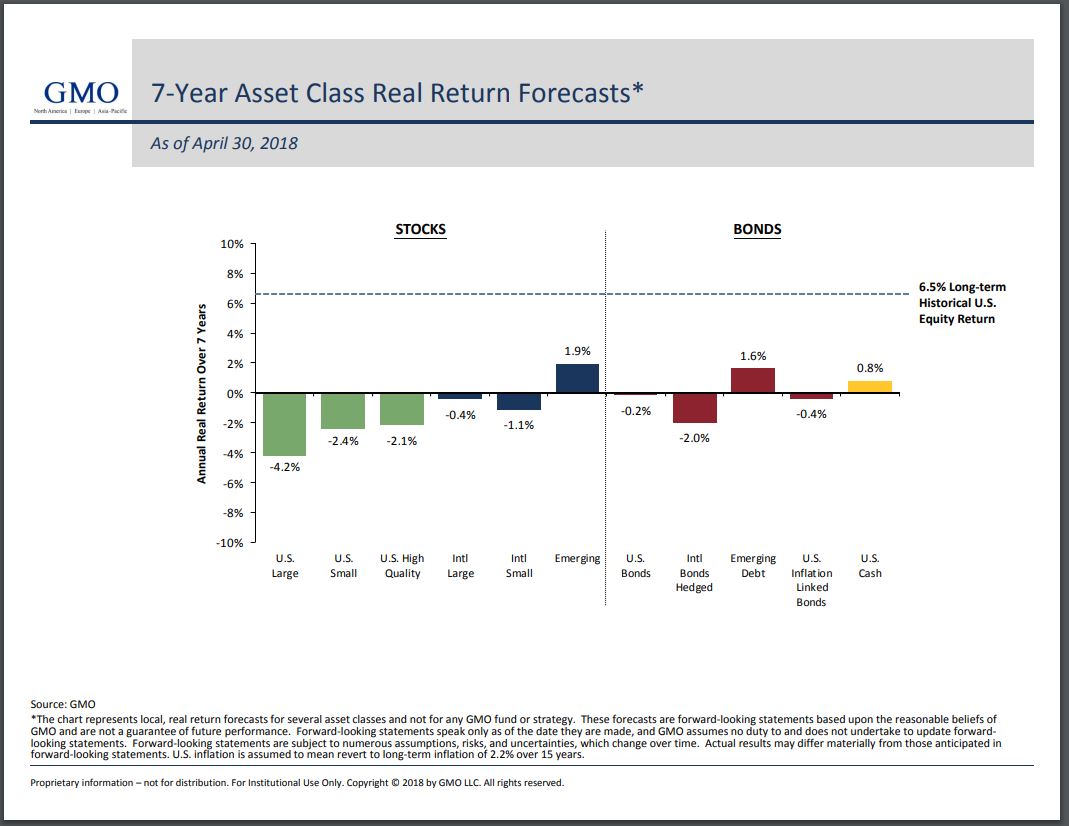
No forecast is perfect. While nominal bond returns are usually close to bond yield-to-maturity, inflation is unknown. Regarding stocks, future real returns are even harder to forecast. Not only is inflation unknown, but so are future earnings-per-share growth and multiples. It’s possible to combine the market’s current 2% dividend yield with historical 4%-5% earnings-per-share growth to arrive at a 6%-7% annualized nominal return forecast. But will stocks trade at a 30+ CAPE ratio in 7 years, as they do now? It’s not impossible, but it’s unlikely given that the two previous times in history the CAPE has displayed such high readings have been in the runups to the 1929 and 2000 peaks. So, overall, it looks like stocks are priced to lag bonds over the next 7-year period.
And although bonds might deliver higher returns than stocks over the next decade, that’s not necessarily an argument to fill your portfolio with them. There’s very little difference in yield right now between short-term bonds (two-year maturities or less) and longer-term bonds. It’s possible that rates will come back down, making longer-term bonds a better deal. But if you think rates are on their way up – or at least not going back down in a meaningful way – -then short-term bonds, which are almost cash equivalents are better. That’s how GMO has arranged the portfolio of the (Wells Fargo Absolute Return A) Fund (WARAX), for example, which has more than 20% of its assets in U.S. Treasuries of 3-year maturities or less.
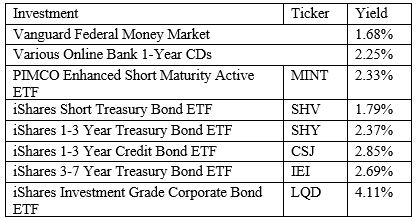
All of this means that bonds still have a place in most people’s portfolios. In fact, as interest rates have been rising, bonds are looking more attractive. The starting yield-to-maturity often indicates an investor’s return from bonds. Below is a list of some money market funds, bond funds (mostly shorter term to intermediate term), savings accounts and their yields. The yields aren’t mouth-watering yet, but they represent some relief from the nearly decade-long income drought for yield-starved investors.
See you next week.
Market and Sector Analysis
Data Analysis Of The Market and Sectors For Traders
S&P 500 Tear Sheet
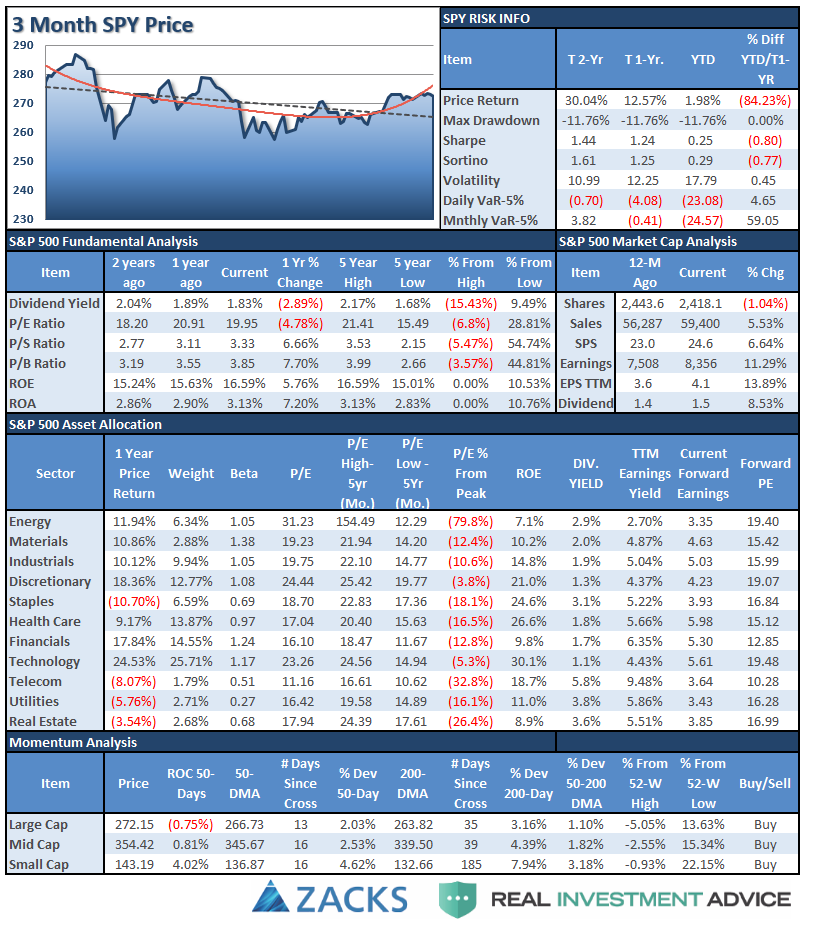
Performance Analysis
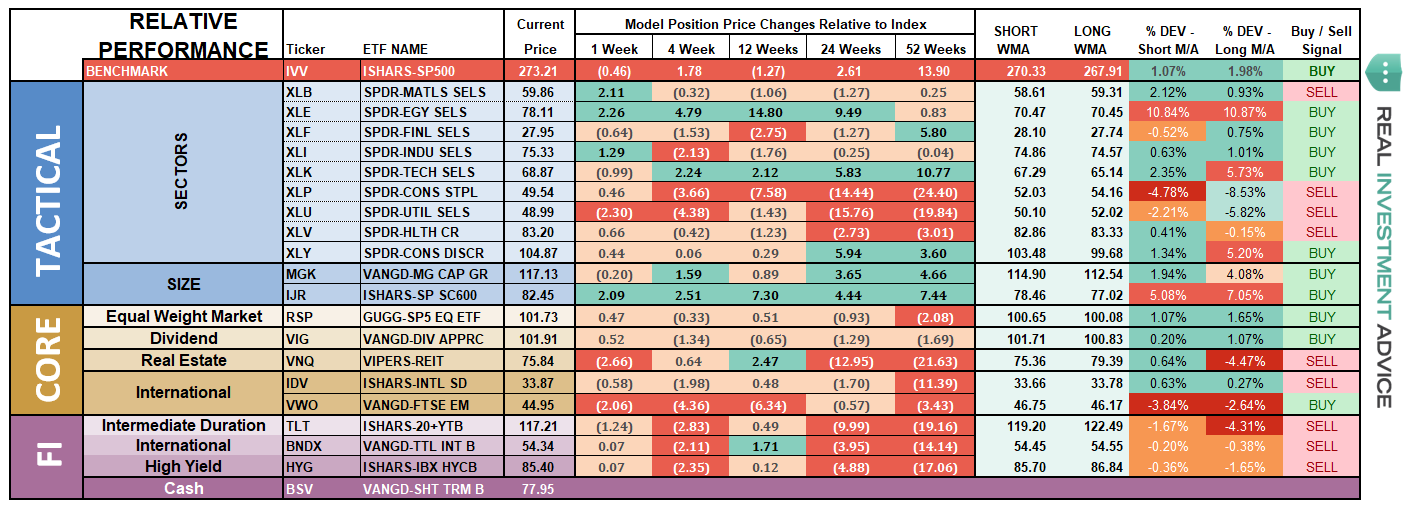
ETF Model Relative Performance Analysis
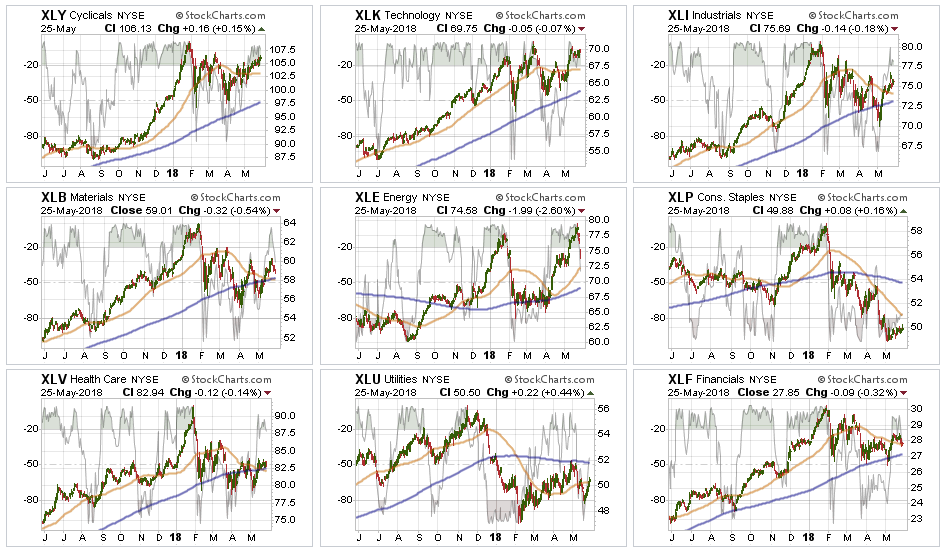
Sector and Market Analysis:
As noted above, the consolidation continues. As earnings season comes to its conclusion, the market will turn its focus to the economic and geopolitical backdrop which has been less optimistic as of late. We remain invested but our caution levels remain elevated.
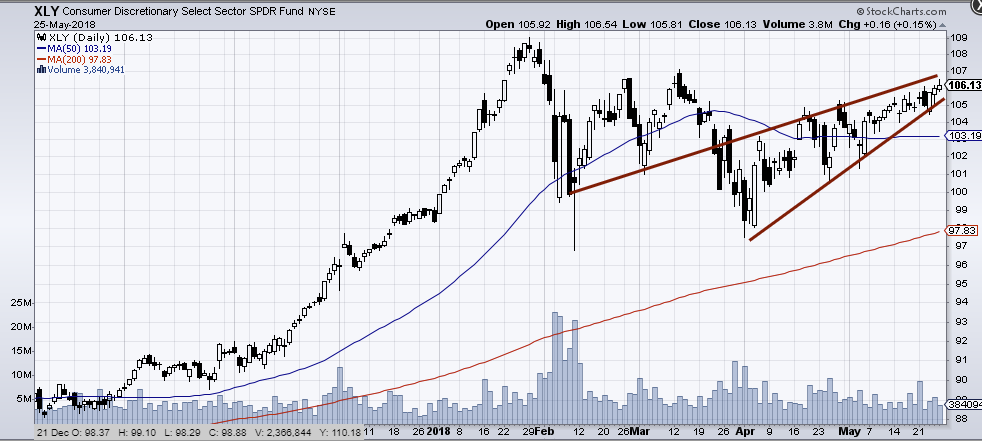
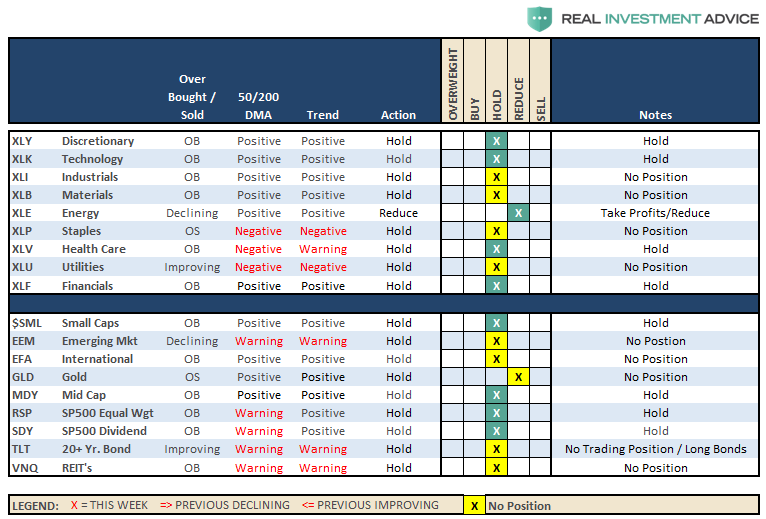
Discretionary stocks have been leading the market as of late. However, pay attention to the price compression currently forming. A downside break could lead to a rather sharp decline, so taking some profits from the sector is advisable.
Energy led the decline last week as oil prices pushed fell back below $70/bbl. As discussed above, the profit taking last week proved prudent. We are likely not done with the correction yet particularly if the dollar continues to strengthen. Taking profits and under-weighting the sector currently remains advisable.
Technology, Financials, Industrials, Materials, and Health Care held above their respective 50-dma’s last week and consolidated their recent advance. Materials and Health Care are currently the least attractive of the group with their respective 50-dma’s below their 200-dma’s. Remain underweight these two sectors for now.
Staples – there is a potential rotation trade being built in this sector as performance did improve again last week. It is too soon to buy into staples just yet, but we may be getting close to a decent trading opportunity. We are watching closely particularly as we move into the summer months.
Utilities had a nice rally last week back above its 50-dma as money rotated into the Utilities (and Bonds) on a “risk off” trade. We remain out of the sector for now, but the rally last week has caught our attention. We need some confirmation of sustainability and we watch performance next week.
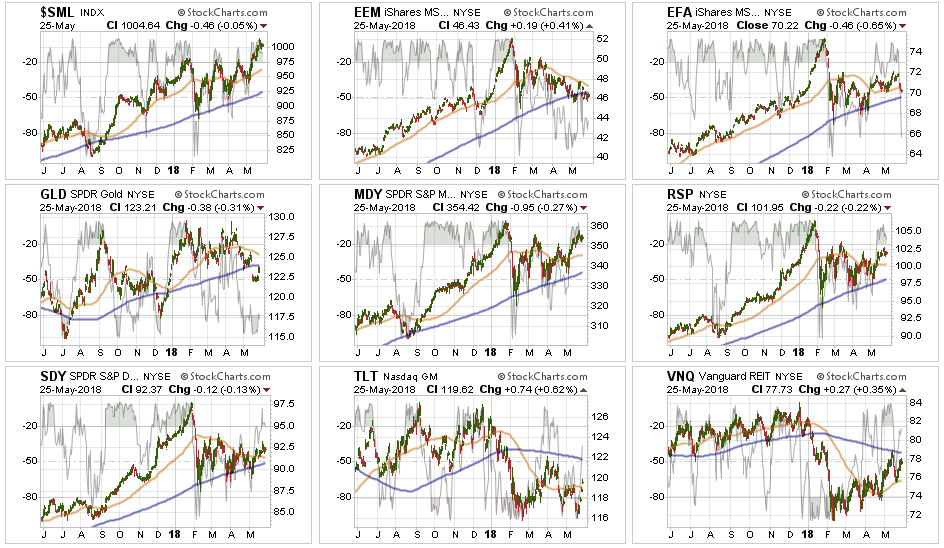
Small-Cap and Mid Cap continue to lead performance overall. After small caps broke out of a multi-top trading range, we now need a pull-back to add further exposure. While Mid-cap stocks have not broken out to all-time highs, a pullback that doesn’t violate support will also provide a better opportunity to increase exposure. After a strong push over the last few weeks, rebalance back to core weightings and look for a more opportunistic entry point in the future.
Emerging and International Markets remain lackluster in terms of performance currently. We previously removed our holdings in these markets and remain domestically focused at the moment. We will continue to monitor performance for an opportunity if it presents itself. Emerging markets, in particular, continue to lag due to a rising dollar and weak economic growth globally. Industrialized International is performing better but not by much. Remain domestically focused to reduce the drag on overall portfolio performance.
Dividends and Equal Weight continue to hold their own and we continue to hold our allocations to these “core holdings.”
Gold as noted last week, failed to hold important support at the 200-dma. We currently do not have exposure to gold and have been out for a long time. We previously suggested that “if you are already long the metal hold for now. $123 on SPDR Gold Shares (NYSE:GLD) is a hard stop and profits should be harvested on any failed rally back to the 200-dma.” Gold rallied and failed at the 200-dma. Take profits on positions, and lower your stop to last week’s bottom at $122.
Bonds and REITs – were the big winners last week. Just about the time you see articles declaring the “bond bull” dead, it is usually time to start buying interest rate sensitive sectors. We remain out of trading positions currently, but remain long “core” bond holdings mostly in floating rate and shorter duration exposure. However, we are watching Staples and Utilities closely for a “counter-rotation” trade being set up.
The table below shows thoughts on specific actions related to the current market environment.
(These are not recommendations or solicitations to take any action. This is for informational purposes only related to market extremes and contrarian positioning within portfolios. Use at your own risk and peril.)
Portfolio/Client Update:
From last week:
“Over the last several weeks, we have continued to maintain higher levels of cash than normal as market volatility had markedly increased. In our previous update, we noted the breakout of the consolidation range which provided the market with some upside in the short-term. From a portfolio management perspective, we used that breakout to put some of our excess cash weightings back to work as follows:
- In ETF model portfolios were added weight to Discretionary, Technology, Health Care and Financials as well as our “core” holdings. In existing accounts, we rebalanced to target weights in those holdings. For new accounts, we moved into the on-boarding process by adding 50% of target weights.
- In Equity model portfolios we added 50% to our target weights in our targeted companies. We will add the other half on weakness in the market which does not violate the bullish trend.
- The same goes for our Equity/Option Collar portfolio. Once we complete the position purchases we will then collar each position with a “cashless collar” to hedge exposure.
- The same positioning applies to the Equity/ETF blended model with 50% of target weights being added for new accounts and rebalancing to target for existing portfolios.
We continue to honor the current ‘bullish trend,’ but also remain very aware of the risks. As stated in the newsletter, all actions over the past week are “trading positions” with very tight stops and risk management processes in place.”
Nothing much changed as of last week, as markets still remain tightly range bound. The weakness in the market that doesn’t violate support, will allow us to average into our positions at better prices. Otherwise, we will get stopped out of our positions and look for other opportunities.
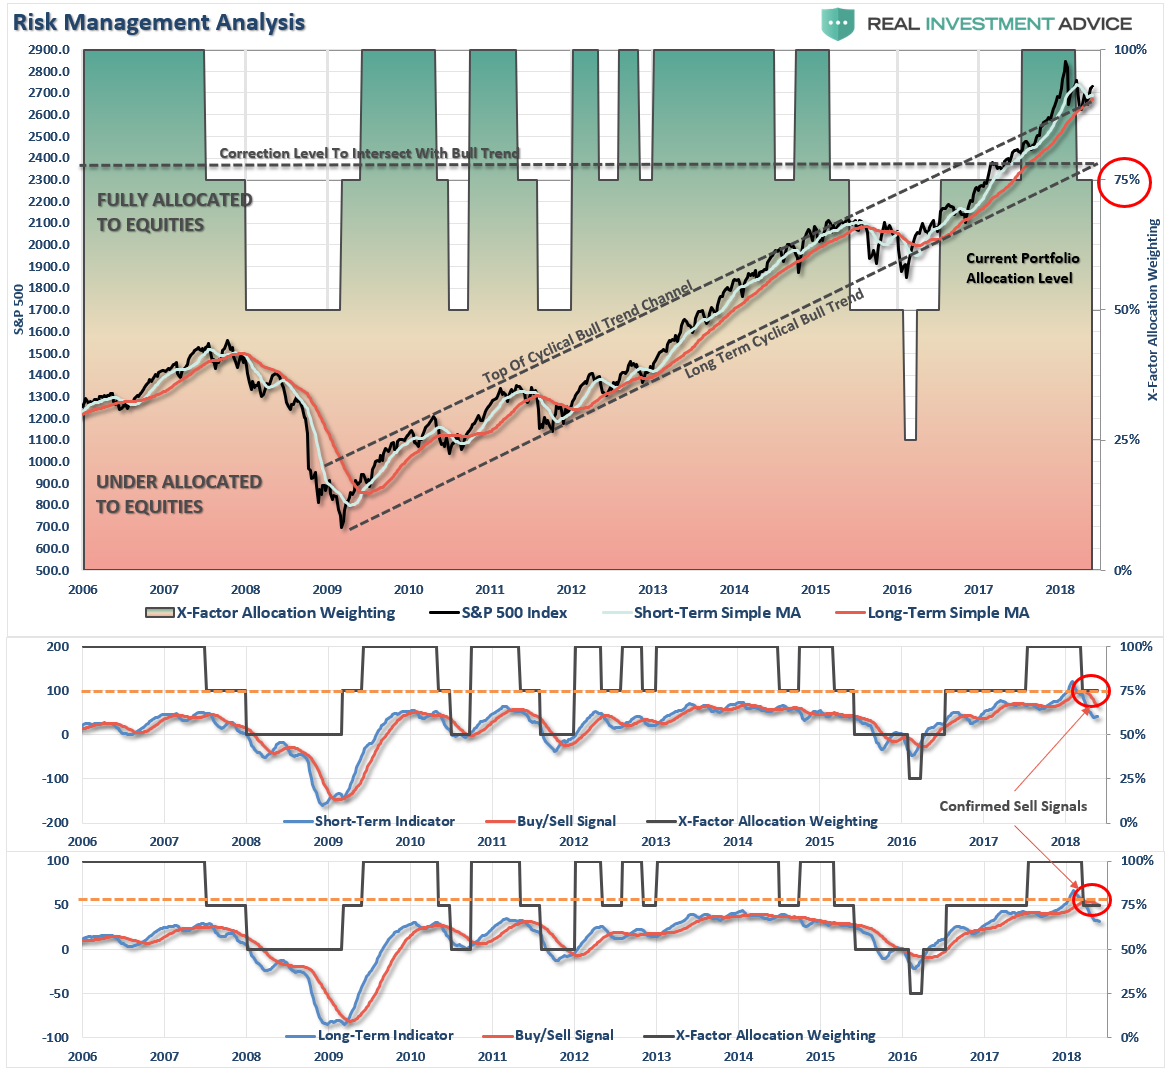
We remain keenly aware of the intermediate-term “sell signal“ and we will continue to take actions to hedge risks and protect capital until those signals are reversed.

