One of the most dangerous sports in America lasts a total of eight seconds – bull riding. In bull riding, a rider must stay on top of the bucking bull while holding onto the bull rope with one hand for eight seconds and not touching the bull or himself with his free hand. If he does that, it is a qualified ride. If he gets bucked off before eight seconds, it is a no score.
For investors, the difference between success and failure in “riding the bull,” often comes down to knowing when “hang on” and when to “dismount” the bull market. The worst outcome is getting “bucked off” and facing a really “p*ssed off” bull looking to stomp or gore whoever is closest to it.
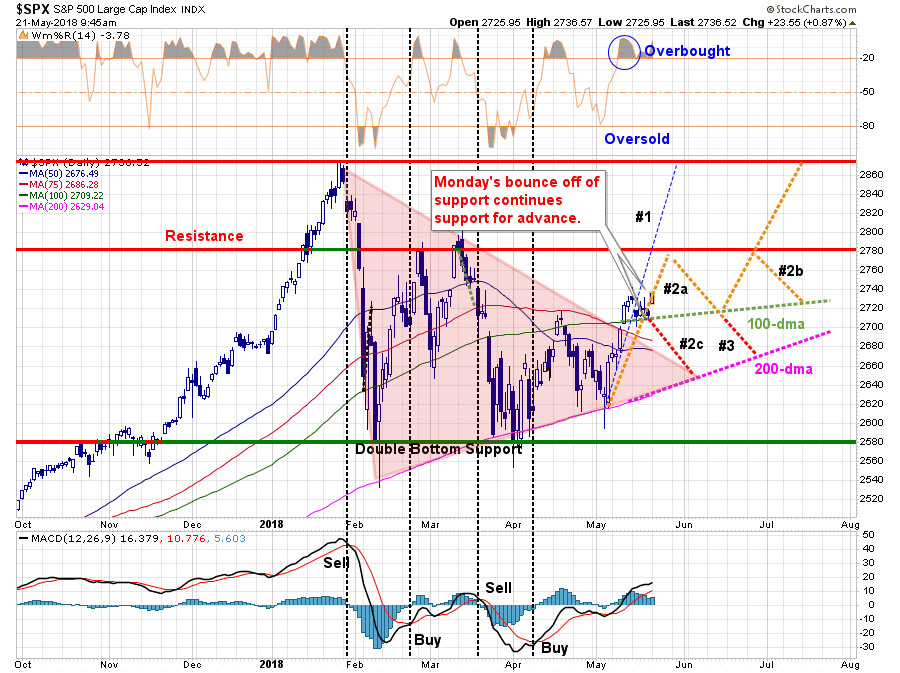
In this past weekend’s missive, “Consolidating The Breakout,” I updated the projected pathways for the market given the recent SPX break above the cluster of resistance surrounding the 100-day moving average. To wit:
As shown, in the chart above, this ‘pause’ sets the market up for a continuation of pathway #2a to the next level of resistance. However, there is a reasonable possibility that has opened up of a new path (#2c) which could lead to another retest of the 200-dma if the market breaks the current support.
Pathway #2c is currently a binary outcome and will only exist next week. Either the market will move higher next week and continue following pathway #2a or it won’t. Monday will likely ‘tell the tale’ and I will update this analysis in Tuesday’s report.
I can now update that analysis with yesterday’s move higher on reports the “trade war” with China has been put on hold to negotiate a reduction in the “trade deficit.”
As I stated, pathway #2c was binary. Given our analysis is based on the “end-of-week” close, if the market breaks above last week’s highs, we will remove pathway #2c.
Where does that leave us now in terms of our portfolio models?
When the market broke above the 100-dma, we used some of the cash we had raised on previous rallies to increase the allocation to equities in our portfolios. However, we still maintain an overweight position on cash currently as a hedge against potential market risk.
This week, we are looking to add further exposure. However, before we do that, we need some confirmation from the market of a push higher. While the markets moved higher yesterday, it remains contained in a short-term trading range. We are looking to add further exposure to equities if the market can close above last week’s closing high.
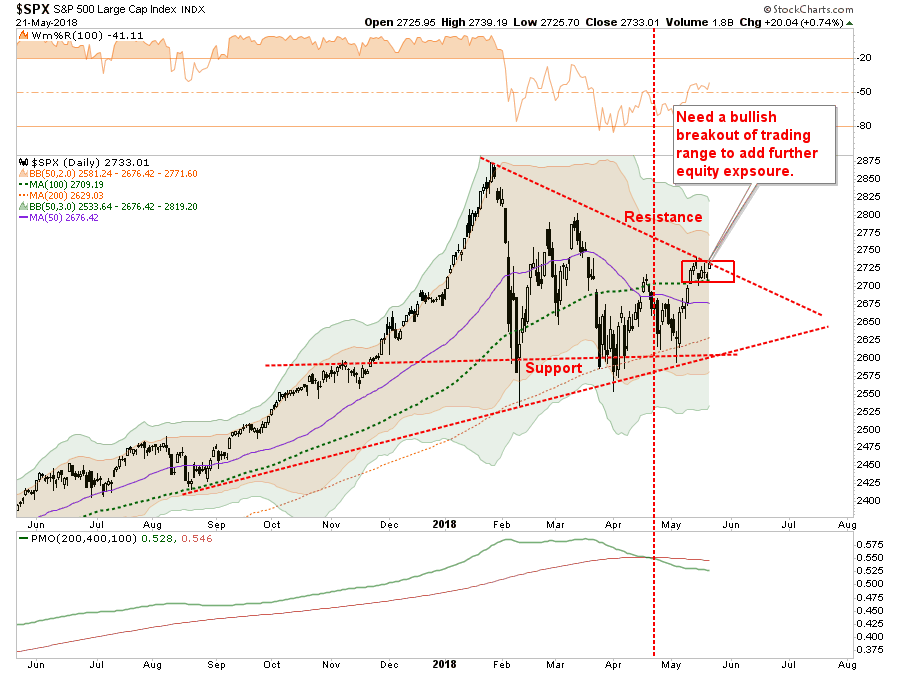
Importantly, while we are increasing equity exposure, we do so under the following guidelines:
- We are still overweight cash in portfolios as the “risk” of a failure has not been absolved as of yet,
- Positions are carrying a “tighter than normal” stop-loss level, and;
- We will quickly add negative hedges as necessary on any failure of support.
Earnings Remain The Biggest Concern
While market performance has certainly improved over the last couple of weeks, it remains overall quite disappointing relative to the jump in Q1 earnings. As noted by Upfina last week:
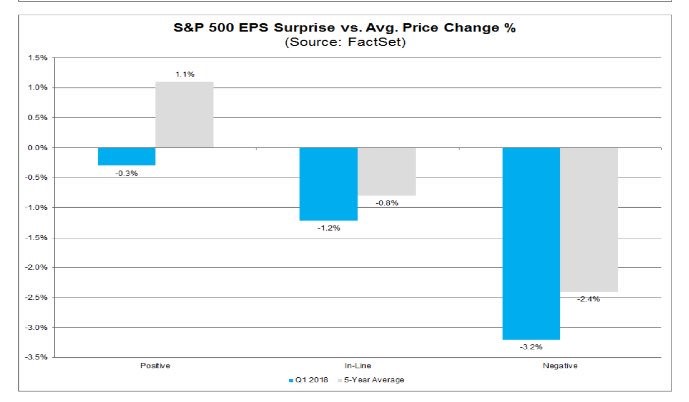
Earnings growth has been solid even as stocks have been restless. It makes you wonder if earnings results matter in the near term. The chart below reinforces the notion that earnings beats haven’t mattered.
As you can see, the average price change from 2 days before the report to 2 days after the report shows earnings beats have led to a 0.3% decline instead of a 1.1% increase which is the 5-year average. The stocks meeting and missing results have also fallen more than average. The beat portion of this chart is the most important because most firms beat results. It’s obviously important to figure out if stocks are actually selling off when bad results come out.
There are two important things to remember about earnings:
- The first is that earnings consistently beat estimates as analysts reduce estimates heading into the earnings to ensure a high “beat” rate.
- The second is that today, more than ever before, earnings are heavily manipulated through accounting gimmicks and share repurchases.
But more importantly, the market may be sniffing out the specific problem I discussed recently – estimates have gone parabolic.
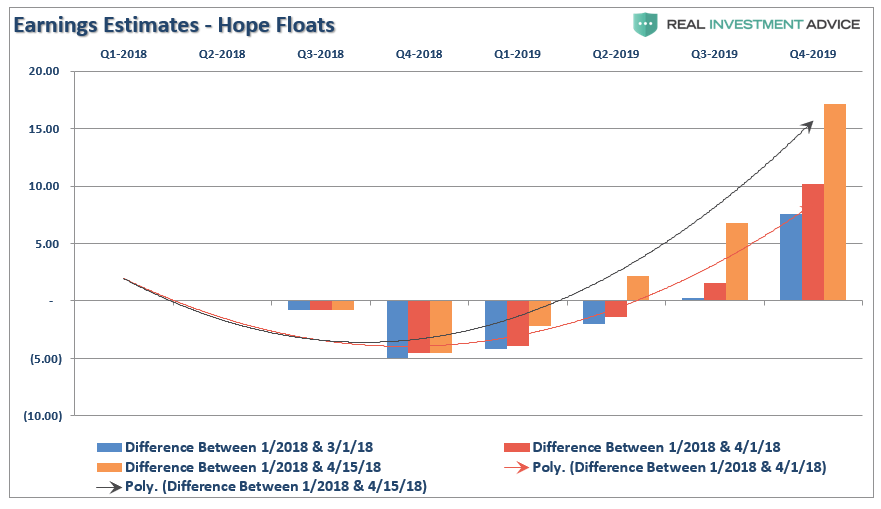
Despite a recent surge in market volatility, combined with the drop in equity prices, analysts have “sharpened their pencils” and ratcheted UP their estimates for the end of 2018 and 2019. Earnings are NOW expected to grow at 26.7% annually over the next two years.
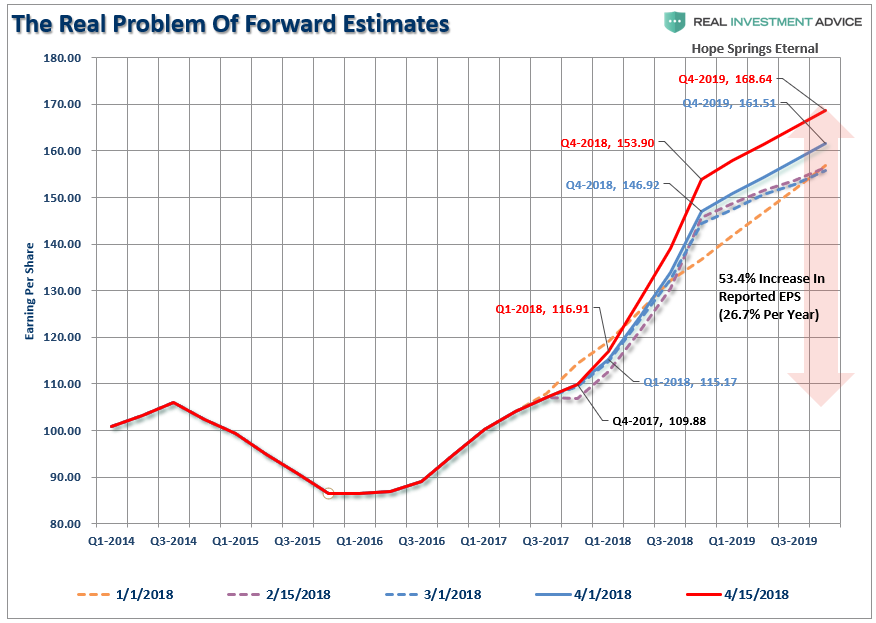
The chart below shows the changes a bit more clearly. It compares where estimates were on January 1st versus March and April. ‘Optimism’ is, well, ‘exceedingly optimistic’ for the end of 2019.
It is not just me that is scratching my head over the optimism. As my friend Doug Kass noted yesterday, so is Dr. Ed Yardeni, who recently penned much of the same:
I would like to try some of whatever industry analysts are smoking. You can compare my earnings forecasts to their consensus estimates on a weekly basis in YRI S&P 500 Earnings Forecast on our website. I say “tomato.” They say “tomahto.”
My earnings-per-share estimate for 2018 is $155.00 (up 17.4% y/y). The analysts continue to up the ante and are currently at $160.40 (up 21.5%). My estimate for 2019 is $166.00 (up 7.1%). Theirs is $175.72 (up 9.6%). Perhaps the analysts are just high on life.
Their growth estimate for next year seems too high to me since I expect 2019 earnings growth to settle back down to the historical trend of 7%.
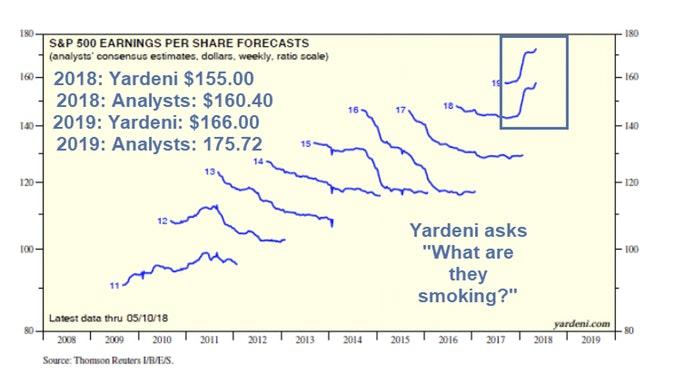
However, analysts tend to be too optimistic and often lower their estimates as earnings seasons approach.
While the surge in earnings estimates gives cover for Wall Street analysts to predict surging asset prices, the risk has historically been to the downside. This is because Wall Street has historically over-estimated earnings by about 33% on average.
Yes, while a vast majority of companies have beaten estimates in the first quarter, it is only the case because analysts are never held to their original estimates. If they were, 100% of companies would be missing estimates currently.
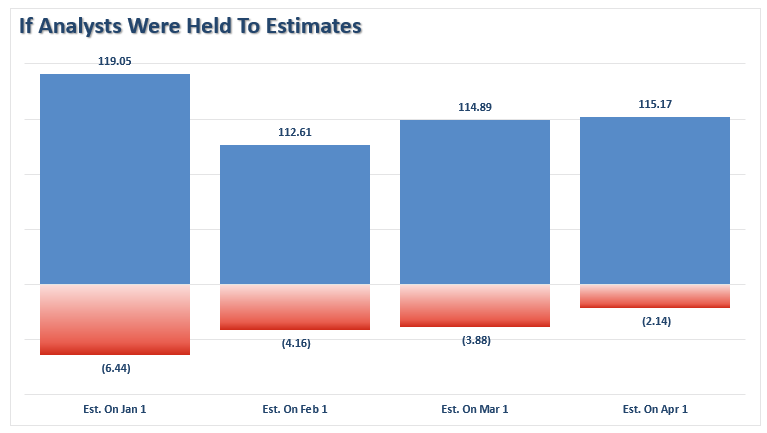
At the beginning of January, analysts overestimated earnings by more than $6/share, reported, versus where they are currently. It’s not surprising volatility has picked up as markets try to reconcile valuations to actual earnings.
Economic Growth Is Set To Explode. Right?
Most likely not.
While there was a short-term boost to economic growth last year which was driven by a wave of natural disasters in the U.S., the boost from “rebuilding” is now beginning to fade.
As noted recently by Morgan Stanley (NYSE:MS) (via Zerohedge):
While we are not yet seeing evidence of falling economic growth, we expect — with near- certainty — that we will have a peak rate of change in S&P 500 y/y earnings growth by 3Q thanks to the spike created by the tax cuts. This was something we cited in our 2018 outlook and one of the primary reasons why we thought P/Es would contract. The good news is that this has already occurred.
The risk for further P/E compression comes if markets start to worry that it’s not just a deceleration of growth on the backside of the peak, but an outright decline in growth. Consensus forecasts do not expect negative growth, but it’s worth considering the potential risk of ‘disappointment’ later this year and in 2019, for two reasons.
- First, earnings growth expectations for 4Q and 2019 look high to us, given the extremely difficult comparisons created by the tax cuts.
- Second, even in the absence of an economic recession or material slowdown, we do see growing risk to y/y growth of consumer spending due to the extraordinary one-time boosts that began late last year — hurricane relief, tax cuts and the interest in cryptocurrency, not to mention the seeming euphoria in stock markets in January that looks unlikely to be repeated.
This suggests that the difficult comparisons are not only the result of tax cuts but perhaps better top-line growth that can’t be repeated. I think it’s too early to worry about this risk today, but it’s not too early to start thinking about it and watching for signs of consumer behavior becoming more tempered. I would also throw in the price of crude oil as an important consideration, given that our economics team estimates that close to one-third of the tax cut benefit to the US consumer may have already been removed by the rise in oil and gasoline prices.
The economy is sensitive to changes in interest rates. This is particularly the case when the consumer, which comprises about 70% of the GDP calculation, is already heavily leveraged. With corporations more highly levered than at any other point in history, and dependent on bond issuance for dividend payments and share buybacks, higher interest rates will quickly stem that source of liquidity. Notice that each previous peak was lower.
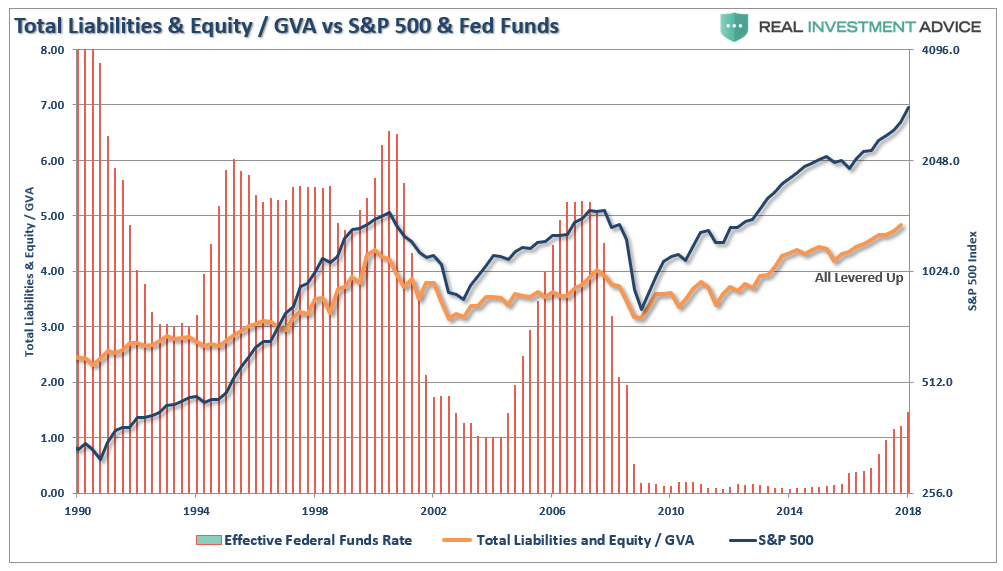
With economic growth running at lower levels of annualized growth rates, the “bang point” for the Fed’s rate hiking campaign is likely substantially lower as well. Currently, there are few, if any, Wall Street analysts expecting a recession at any point in the future. Unfortunately, it is just a function of time until a recession occurs and earnings fall in tandem.
More importantly, the expectation for a profits-driven surge in asset prices fails to conflate with the reality that valuations have been the most important driver of higher stock prices throughout history.
While we are increasing equity exposure from a “trading” perspective, we remain much more concerned by the in the longer-term from the underlying issues which have been unkind to forward returns:
- Yields are rising which deflates equity risk premium analysis,
- Valuations are not cheap,
- The Fed is extracting liquidity, along with other Central Banks slowing bond purchases, and;
- Further increases in interest rates will only act as a further brake on economic growth.
Wall Street is notorious for missing the major turning of the markets and leaving investors scrambling for the exits.
This time will likely be no different.
We remain “cautiously optimistic” and are happy just “riding the bull” for now.
As every good Texan knows, all “bull riders” get thrown if they stay in the saddle too long. The trick is to “hold on tight” with one hand and “dismount and run for safety” when the buzzer sounds.
The consequences of getting thrown have not been kind.
