Breaking News
Investing Pro 0
Free Webinar - Master Forex Trading Today! Don't Miss Out | Tuesday, June 6, 2023 | 01:00PM EDT Enroll Now

Opening Bell: U.S. Futures Hit By Dire Corporate Warnings; Oil Tumbles

By Investing.com (Pinchas Cohen/Investing.com)Market OverviewOct 23, 2019 05:34AM ET
www.investing.com/analysis/opening-bell-us-futures-hit-by-dire-corporate-warnings-oil-tumbles-200476496
Opening Bell: U.S. Futures Hit By Dire Corporate Warnings; Oil Tumbles
By Investing.com (Pinchas Cohen/Investing.com)   |  Oct 23, 2019 05:34AM ET
Saved. See Saved Items.
This article has already been saved in your Saved Items
 
 
ESM3
+0.03%
Add to/Remove from Watchlist
Add to Watchlist
Add Position

Position added successfully to:

Please name your holdings portfolio
 
TIOc1
+0.99%
Add to/Remove from Watchlist
Add to Watchlist
Add Position

Position added successfully to:

Please name your holdings portfolio
 
0700
-0.30%
Add to/Remove from Watchlist
Add to Watchlist
Add Position

Position added successfully to:

Please name your holdings portfolio
 
000270
+1.17%
Add to/Remove from Watchlist
Add to Watchlist
Add Position

Position added successfully to:

Please name your holdings portfolio
 
NZ10Y...
+3.18%
Add to/Remove from Watchlist
Add to Watchlist
Add Position

Position added successfully to:

Please name your holdings portfolio
 
STOXX
-0.48%
Add to/Remove from Watchlist
Add to Watchlist
Add Position

Position added successfully to:

Please name your holdings portfolio
 

  • U.S. futures, European shares slide on corporate warnings, Texas Instrument-led selloff
  • New Brexit deadlock adds to stock and pound weakness
  • Swiss heavyweight ABB adds to dire economic warnings
  • Oil tumbles on Russia's skepticism over supply cuts extension

Key Events

Futures on the S&P 500, Dow and NASDAQ 100 dropped with European stocks this morning after a key revenue forecast cut from semiconductor heavyweight Texas Instruments (NASDAQ:TXN) sounded a dire warning about the state of the global economy, spreading pessimism to European technology firms, already battered by Brexit worries.

Dow and NASDAQ contracts hit the lowest price since Oct. 10, though they later bounced off their lows.

The STOXX 600 was pulled lower by a global chip shares selloff after Texas Instruments, which sells to a broad range of sectors, delivered a fourth-quarter forecast 10% below the low-end of analyst expectations on Tuesday, while also missing both earnings and revenue forecasts.

Swiss industrial giant ABB (SIX:ABBN) also added to economic fears after signaling a critical slowdown in its two main markets—China and the U.S., with order intake from the latter turning negative. The group’s shares still managed to rise after third-quarter profits contracted less than expected.

The European benchmark's technical support coincides with the geopolitical limbo traders find themselves in, after British Prime Minister Boris Johnson saw his Brexit withdrawal bill rejected by Parliament, which in turn quashed hopes to implement an orderly Brexit by the Oct. 31 deadline. Bets are now open on whether European negotiators will grant Johnson an extension on the bill to avert either a no-deal Brexit or snap U.K. general elections.
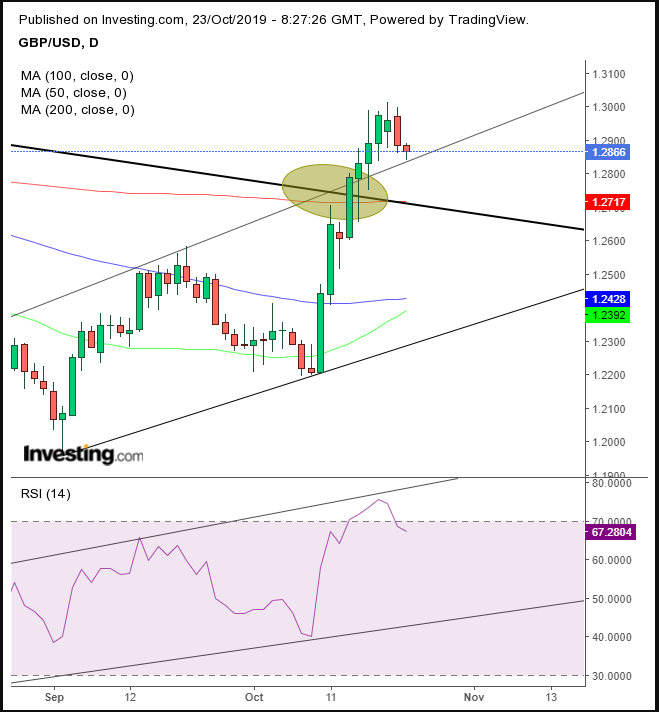
GBP/USD Daily Chart
GBP/USD Daily Chart

The pound recovered slightly from the lows of its second-day slump, after finding support above the top of its former rising channel.

In the earlier Asian session, most regional equities took their cue from U.S. markets after some large companies reported mixed earnings. Hong Kong’s Hang Seng (-0.82%) edged lower for the fourth straight day, with Tencent Holdings (HK:0700) (-2.32%) and insurance company AIA Group (HK:1299) (-0.73%) weighing on the average—the latter poised to complete the right shoulder of an H&S top, following a death cross. The selloff followed a report in the Financial Times about a Chinese government plan to replace the city's Chief Executive Carrie Lam.

Global Financial Affairs

Yesterday, U.S. stocks crumbled away from nearing record highs after yet another Brexit fail boosted macro risk and market giants Facebook (NASDAQ:FB) and Netflix (NASDAQ:NFLX) led a tech selloff, dragging the NASDAQ Composite 0.72% lower.
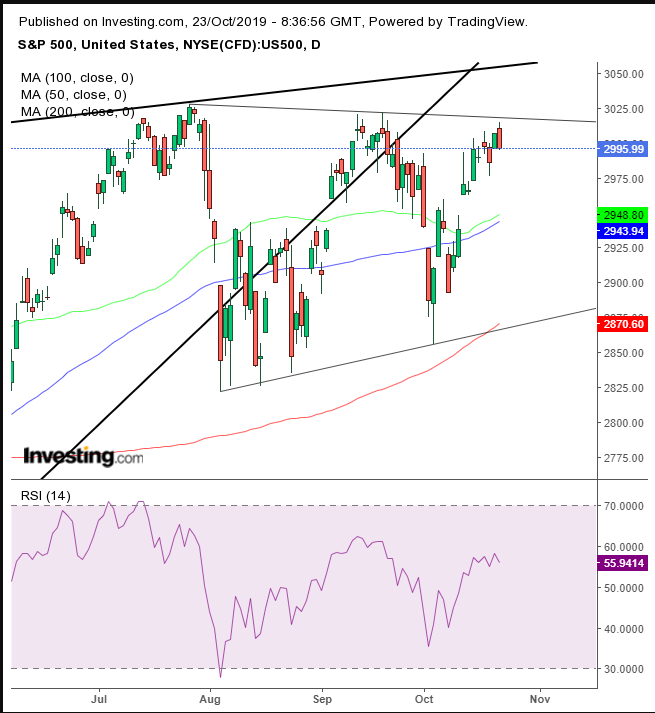
S&P 500 Daily Chart
S&P 500 Daily Chart

Technically, on the S&P 500 chart, demand is finding resistance by oversupply at the top of a triangle formation, developed below the top of a long-term broadening pattern since January 2018.
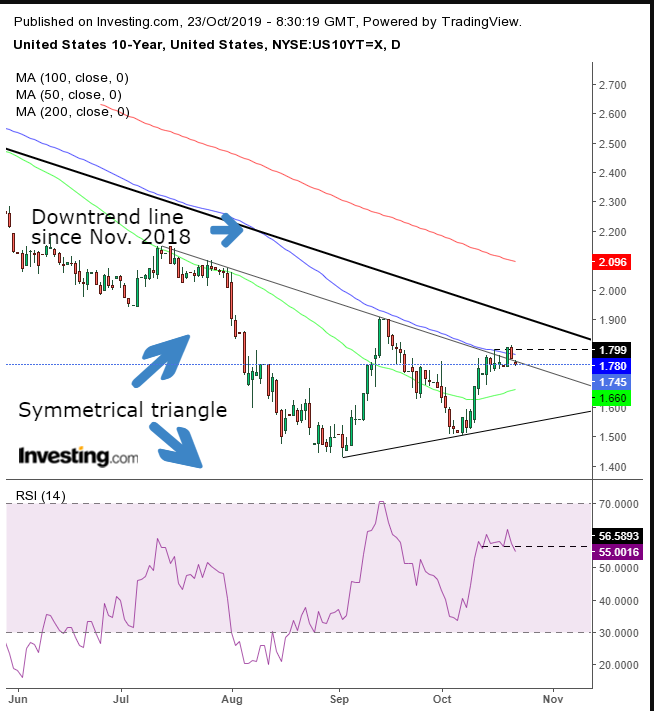
UST 10-Year Daily Chart

Meanwhile, yields on 10-year Treasurys slid, returning into a symmetrical triangle, occurring below their long-term downtrend line since November 2018. The RSI is topping out, suggesting rates might retest the bottom of the triangle in an effort to breakout according to the long-term downtrend.

The dollar remained well above the 200 DMA after it managed to climb back over it. Earlier, the greenback had slipped lower for four straight sessions, breaking below a rising channel since mid June.

Gold climbed for the second day but still within a narrow, 1% congestion since Oct. 11.

WTI tumbled after Russia’s Energy Minister Alexander Novak downplayed chances of OPEC+ oil producers agreeing to broader output cuts in December.

Up ahead

Market Moves

Stocks

  • France’s CAC 40 slid 0.5%.
  • Hong Kong’s Hang Seng declined 0.82%.
  • Currencies

  • The Dollar Index was little changed.
  • The British pound increased 0.1%.
  • The euro was little changed at $1.1127.
  • The Japanese yen gained 0.1% to 108.38 per dollar.
  • Bonds

  • The yield on 10-year Treasurys fell one basis point to 1.75%.
  • Britain’s 10-year yield slid four basis points to 0.675%.
  • Italy’s 10-year yield dropped three basis points to 0.899%.
  • New Zealand’s 10-year yield declined five basis points to 1.291%.
  • Commodities

  • West Texas Intermediate crude slipped 0.6% to $54.17 a barrel.
  • Gold rose 0.2% to $1,491.39 an ounce.
  • Iron ore fell 0.9% to $84.31 per metric ton.
  • Opening Bell: U.S. Futures Hit By Dire Corporate Warnings; Oil Tumbles
     

    Related Articles

    Alex Demolitor
    Silver’s Swoon Should Resume By Alex Demolitor - Jun 05, 2023

    After a brief rally, U.S. nonfarm payrolls helped suppress silver’s momentum. Is there more downside ahead? While the permabulls bought into the rate-cut hype, we warned on Apr. 14...

    Opening Bell: U.S. Futures Hit By Dire Corporate Warnings; Oil Tumbles

    Add a Comment

    Comment Guidelines

    We encourage you to use comments to engage with other users, share your perspective and ask questions of authors and each other. However, in order to maintain the high level of discourse we’ve all come to value and expect, please keep the following criteria in mind:  

    •            Enrich the conversation, don’t trash it.

    •           Stay focused and on track. Only post material that’s relevant to the topic being discussed. 

    •           Be respectful. Even negative opinions can be framed positively and diplomatically. Avoid profanity, slander or personal attacks directed at an author or another user. Racism, sexism and other forms of discrimination will not be tolerated.

    • Use standard writing style. Include punctuation and upper and lower cases. Comments that are written in all caps and contain excessive use of symbols will be removed.
    • NOTE: Spam and/or promotional messages and comments containing links will be removed. Phone numbers, email addresses, links to personal or business websites, Skype/Telegram/WhatsApp etc. addresses (including links to groups) will also be removed; self-promotional material or business-related solicitations or PR (ie, contact me for signals/advice etc.), and/or any other comment that contains personal contact specifcs or advertising will be removed as well. In addition, any of the above-mentioned violations may result in suspension of your account.
    • Doxxing. We do not allow any sharing of private or personal contact or other information about any individual or organization. This will result in immediate suspension of the commentor and his or her account.
    • Don’t monopolize the conversation. We appreciate passion and conviction, but we also strongly believe in giving everyone a chance to air their point of view. Therefore, in addition to civil interaction, we expect commenters to offer their opinions succinctly and thoughtfully, but not so repeatedly that others are annoyed or offended. If we receive complaints about individuals who take over a thread or forum, we reserve the right to ban them from the site, without recourse.
    • Only English comments will be allowed.
    • Any comment you publish, together with your investing.com profile, will be public on investing.com and may be indexed and available through third party search engines, such as Google.

    Perpetrators of spam or abuse will be deleted from the site and prohibited from future registration at Investing.com’s discretion.

    Write your thoughts here
     
    Are you sure you want to delete this chart?
     
    Post
    Post also to:
     
    Replace the attached chart with a new chart ?
    1000
    Your ability to comment is currently suspended due to negative user reports. Your status will be reviewed by our moderators.
    Please wait a minute before you try to comment again.
    Thanks for your comment. Please note that all comments are pending until approved by our moderators. It may therefore take some time before it appears on our website.
    Comments (1)
    Ephraim Shavit
    Ephraim Shavit Oct 23, 2019 8:04AM ET
    Saved. See Saved Items.
    This comment has already been saved in your Saved Items
    Dear Mr Cohen,in my opinion all the technical market analysisis far of beeing relevant.As the US indices and consequently the word ones dance accordingly to the President Tweets,rallies plane steps media briefings ,the only valid tech analysis is his mood or whimses.In my opinion the only.valid strategy remains the long term based on intrinsic.valueor dividend yield..Or.based on fair assesment of the market on which each firm operated.sincerly
    Pinchas Cohen
    Pinchas Cohen Oct 23, 2019 8:04AM ET
    Saved. See Saved Items.
    This comment has already been saved in your Saved Items
    Thanks for your opinion, Ephraim. However, technical analysis is not relevant for one particular market but not for another. The objective of the student is to recognize trends and pockets of supply and demand of various time spans. These hold true irrespective of the known and unknown drivers, and if these important levels break, investors gain insight that help with gauging the market.
     
    Are you sure you want to delete this chart?
     
    Post
     
    Replace the attached chart with a new chart ?
    1000
    Your ability to comment is currently suspended due to negative user reports. Your status will be reviewed by our moderators.
    Please wait a minute before you try to comment again.
    Add Chart to Comment
    Confirm Block

    Are you sure you want to block %USER_NAME%?

    By doing so, you and %USER_NAME% will not be able to see any of each other's Investing.com's posts.

    %USER_NAME% was successfully added to your Block List

    Since you’ve just unblocked this person, you must wait 48 hours before renewing the block.

    Report this comment

    I feel that this comment is:

    Comment flagged

    Thank You!

    Your report has been sent to our moderators for review
    Continue with Google
    or
    Sign up with Email