- China indices, global stocks, US futures rally, after Chinese officials vow to boost China’s economy
- Italian bonds and stocks rebound after Moody’s spares the country from 'junk' status downgrade
- Oil eyes $70 on looming Iran sanctions
- Verizon (NYSE:VZ), due to report Tuesday before market open, expected to show a $1.19 EPS, versus $0.98 in the same quarter last year.
- Twitter (NYSE:TWTR) reports earnings Thursday before market open, with an EPS consensus of $0.05, from $0.02 percent the same quarter last year.
- Amazon.com (NASDAQ:AMZN), also scheduled to report Thursday aftermarket, with a $3.29 EPS consensus, compared to $0.52 for the same quarter last year.
- Alphabet (NASDAQ:GOOGL), expected to publish results Thursday aftermarket as well, and a EPS forecast of $10.54, compared to $9.57 for the same quarter last year.
- For Intel (NASDAQ:INTC), also due to release Thursday aftermarket, analysts expect an EPS of $1.15, from $1.01 the same quarter last year.
- Microsoft (NASDAQ:MSFT), reporting on Wednesday after market close, with a $0.96 estimate, from $0.84 the same quarter last year.
- McDonald’s (NYSE:MCD), announces earnings Tuesday before market open, with an EPS forecast of $1.98, rising from the $1.76 posted for the same quarter last year.
- Monetary policy decisions are due in Europe, Indonesia, Sweden and Canada. On Thursday, ECB policy makers could also confirm that asset purchases will end this year, reiterating their pledge to keep interest rates at record lows through summer 2019.
- US GDP growth, out on Friday, may have slowed in the third quarter, yet according to analyst forecasts it is still on its best pace since mid-2015.
- Futures on the S&P 500 ticked 0.4 percent higher as of 8:09 a.m. London time.
- The STOXX Europe 600 gained 0.7 percent.
- The UK’s FTSE 100 climbed 0.4 percent to the highest level in more than a week.
- Germany’s DAX advanced 1 percent.
- The MSCI Asia Pacific Index gained 0.5 percent.
- The MSCI Emerging Market Index rose 1.1 percent.
- The Bloomberg Dollar Spot Index slipped 0.2 percent, the largest fall in a week.
- The euro gained 0.3 percent to $1.1548.
- The British pound climbed 0.1 percent to $1.3084.
- The Japanese yen dropped 0.2 percent to 112.74 per dollar, the weakest level in almost two weeks.
- The yield on 10-year Treasurys gained one basis point to 3.20 percent.
- Germany’s 10-year yield edged two basis points higher to 0.48 percent.
- Britain’s 10-year yield climbed one basis point to 1.588 percent.
- The spread of Italy’s 10-year bonds over Germany’s fell 17 basis points to 2.8514 percentage points to the smallest premium in more than two weeks.
- West Texas Intermediate crude gained 0.7 percent to $69.60 a barrel, the largest rise in almost two weeks.
- Gold gained less than 0.05 percent to $1,227.05 an ounce, the highest level in a week.
Key Events
European shares as well as futures on the S&P 500, Dow and NASDAQ 100 took their cue from the biggest Chinese equity rally in two and a half years this morning, after both the Chinese government and central bank sources signaled further stimulus for the country's economy, which has shown signs of strain from the ongoing trade war with the US.
The STOXX Europe 600 opened 0.1 percent higher and extended gains to 0.4 percent, though trimming an initial jump of 0.7 percent. Technically, the price extended Friday’s rebound from the bottom of a bearish, rising flag, on top of a downtrend line since late August 2017, which may prove to be the neckline of a massive top since May 2017.
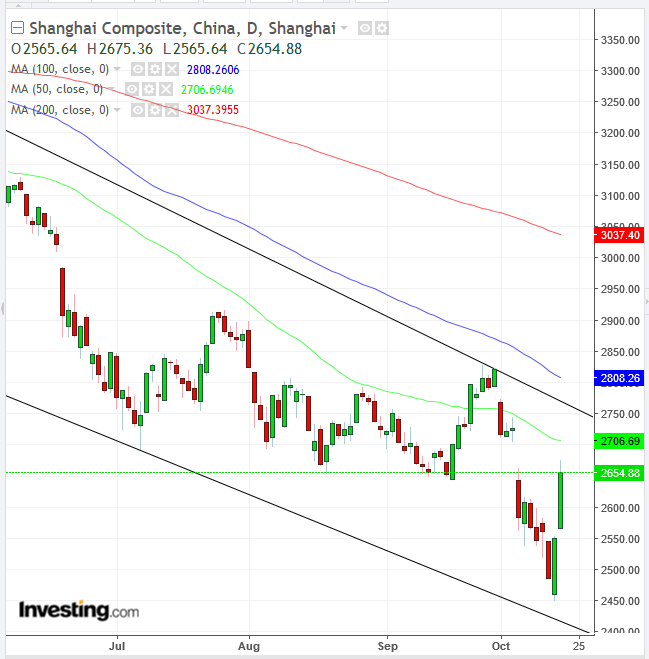
China’s Shanghai Composite leaped over 4 percent, its biggest gain since March 2016. This follows the Asian benchmark halving its value in the seven months leading to February, when it bottomed. Today’s rally builds on Friday’s rebound, for a total 7 percent comeback. The mainland market's extraordinary optimism followed bullish rhetoric from President Xi Jinping, who vowed “unwavering” support for the country’s private sector through further tax cuts and deductions.
The SZSE Component also closed 4.89 percent higher, or +7.9 percent since Friday. Technically, however, the advance is considered nothing more than a correction within a downtrend, as it approaches the top of a descending channel and the 50 DMA. This clashes with overly upbeat headlines that suggest the Chinese market's 31 percent year-to-date plunge could finally be over.
The fundamental outlook is also less positive, as there are no signs of easing tensions between the world’s two largest economies. White House economic adviser Larry Kudlow blamed China for doing “nothing” to de-escalate the trade dispute ahead of a meeting between President Donald Trump and President Xi Jinping at the G20 in Buenos Aires on November 29.
Global Financial Affairs
During Friday's US session, most stocks slipped after disappointing housing data, the lowest since 2015, wiped out an earlier, earnings-driven rally. PayPal (NASDAQ:PYPL) was investors' favorite, jumping 9.42 percent after the online payments company raised its outlook on higher-than-expected earnings and revenue. On the other side of the spectrum, eBay (NASDAQ:EBAY) tumbled 8.87 percent to a near two-year low, after being hit by an analyst downgrade.
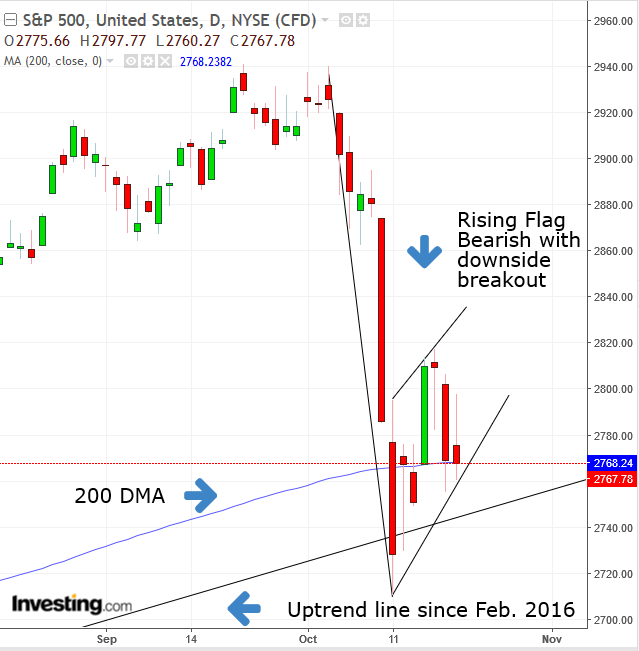
The S&P 500, Dow Jones Industrial Average and NASDAQ Composite posted the same technical picture: the price ended right on top of a convergence of technical supports between the 200 DMA, the rising trend line since the February 2016 bottom and the bottom of a rising flag, bearish with a downside breakout. These sorts of confluences tend to attract traders who follow the trend's path, increasing the pressure toward its focal point. The breaking point typically causes an explosive move, as all the pressure is forced in one direction, triggering stop-losses on one side and short squeezes on the other.
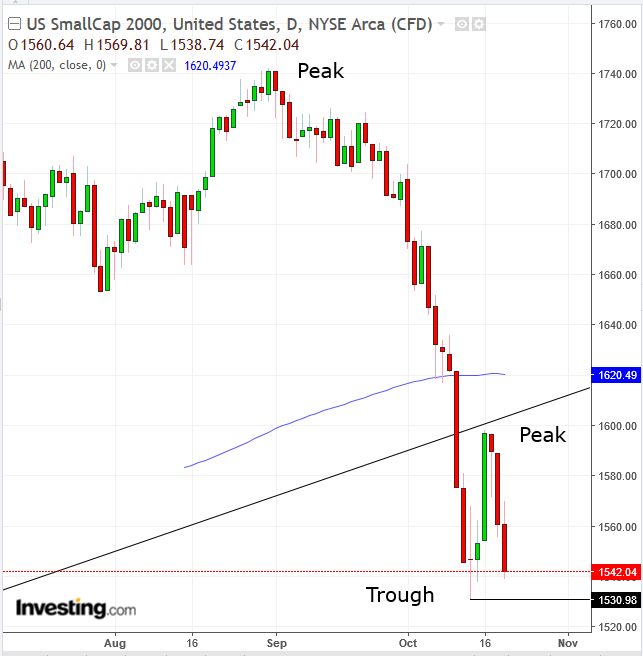
The Russell 2000, conversely, had already fallen below its confluence of the 200 DMA and long-term uptrend line since February 2016. Should the small cap benchmark slip below 1,530, it would complete a trend reversal. This is noteworthy, as overall market tops are generally preceded by a selloff of small caps. However, large cap stocks are not yet in a downtrend and this may just be the time for responsible (with strict equity management discipline) risk takers to pick up stocks on the cheap.
This morning the euro strengthened, after Italian bonds and stocks rallied after Moody’s Investors Service downgraded the country's sovereign debt by one notch, leaving them still one level above junk status, and kept its outlook stable.
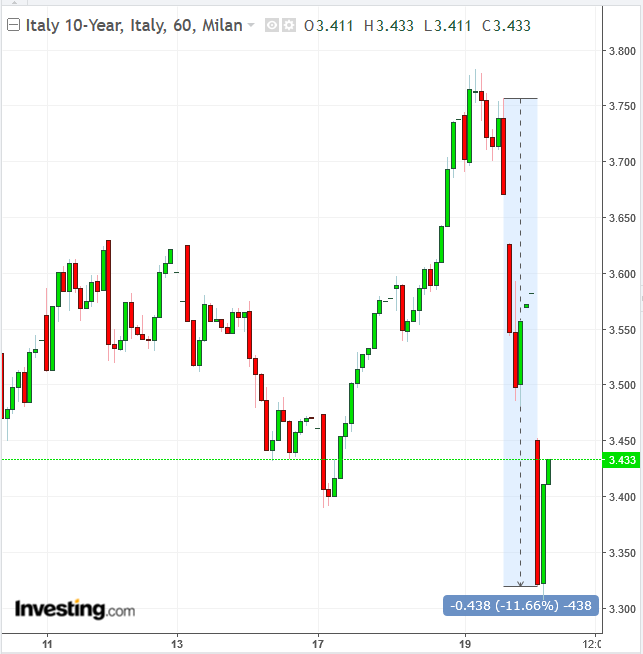
However, the single currency later started to edge lower. The yield on Italy's 10-year notes rebounded for the second hour after falling almost 4.4 basis points in the seven hours till 2:00 EDT.
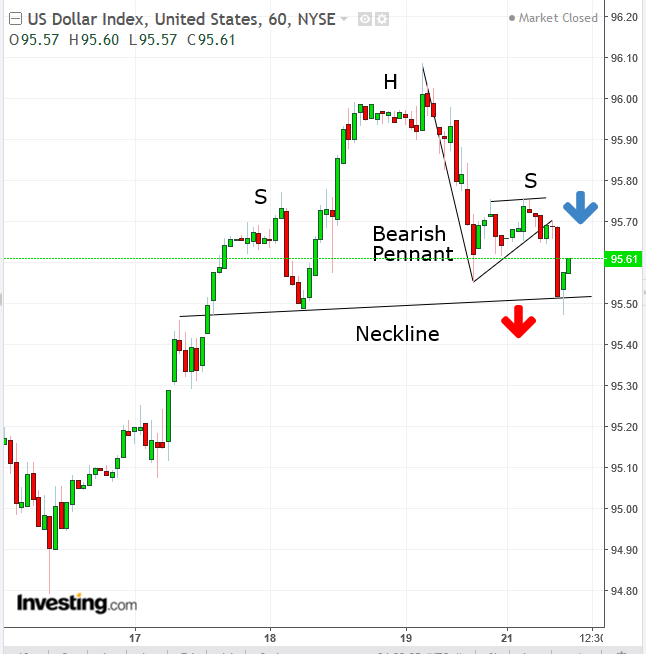
The dollar weakened as investors rotated out of safe haven currencies and into risk assets, as well as into the euro. Technically, the Dollar Index completed a bearish pennant, which also forms the right shoulder of a H&S top, on the hourly chart. However, the greenback was seen gaining some ground later in the European morning session.
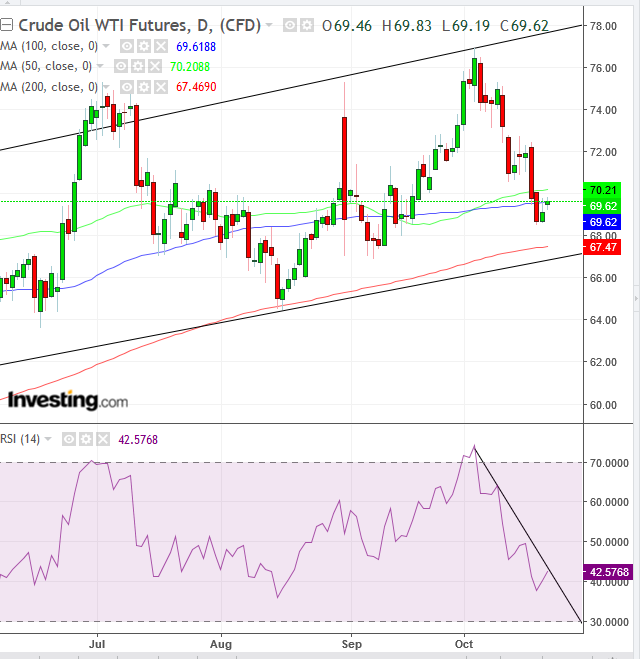
WTI crude is eyeing the $70 threshold ahead of the official start date of US sanctions against Iran, on November 4. A Reuters report suggested that OPEC producers would be unable to step up total output, as higher Saudi supply was offset by lower production in other member states.
Iraq overtook Canada as the world’s fourth-largest oil producer this year, increasing shipments to Asia, Europe and the Mediterranean region, in an attempt to fill Iran’s vacuum. However, the war-stricken country is unable to provide basic services like clean water and power to its citizens in the areas where most of its oil is extracted. Technically, black gold is gaining for a second day after nearing the bottom of a rising channel since February, “guarded” by the 200 DMA. An RSI breakout would confirm that momentum is set to go higher.
Up Ahead
Earnings
Market Moves
Stocks
Currencies
Bonds
Commodities
