Tuesday January 10: Five things the markets are talking about
It’s week two of the New Year and already investor anxiety is beginning to be priced in.
Since Trump’s surprise U.S election win last November, the markets have been dealing with a natural burst of market optimism – the dollar index is up over +5%, U.S treasury yields have spiked as investors speculate that the new U.S government will enact measures to boost economic growth and U.S equities trade atop of their record highs.
Is it too much too soon? The President elect will hold a news conference tomorrow, Wednesday, and already the market fears a wave of protectionist comments criticizing overseas manufacturers could move the “risk” appetite needle.
The forex market in particular is beginning to express this sentiment as some ‘long’ dollar position get pared and risk averse currencies get bought (JPY +0.5% to ¥115.90).
With so much built in on Trump’s policies its only natural that the market undergoes some sort of correction, it’s the pace of depth of this correction that will concern the avid investor.
1. Global stocks sending mixed messages
Asian equities had a mixed session overnight. Some commodity intensive bourses were hurt by doubts over OPEC’s oil curb deal, while all regional indices are naturally apprehensive ahead of Trump’s first news conference Wednesday since his election victory.
The Nikkei Stock Average reversed gains in afternoon trade, and closed down -0.8%. The index was weighed down by a firmer JPY, as automakers, retail, and utilities lagged.
Note: The fear among investors in Japan is that Trump could turn on the country in his desire to protect American manufacturing.
Elsewhere, Australia’s S&P/ASX 200 also ended down -0.8% – biggest decliners were in healthcare and energy, while mining names performed stronger. Korea’s Kospi declined -0.2% while the Shanghai Composite Index slipped -0.3% and Hong Kong’s Hang Seng Index added +0.6%.
In Europe, equity indices are trading generally lower with the FTSE 100 outperforming once again (supported by a weaker pound £1.2138). Financials are weighing the EURO STOXX 600 while commodity and mining stocks are trading notably higher on the FTSE 100.
U.S futures are set to open little changed.
Indices: Stoxx50 -0.2% at 3,304, FTSE +0.2% at 7,248, DAX -0.1% at 11,559, CAC 40 -0.1% at 4,884, IBEX 35 -0.6% at 9,438, FTSE MIB -0.2% at 19,331, SMI -0.2% at 8,407, S&P 500 Futures flat

2. Oil prices steady after recent falls on weaker dollar, gold higher
Oil prices have stabilized overnight after yesterday’s sharp sell-off. The “greenback” weakness has triggered a bout of short covering.
The market is certainly long crude futures contracts and it’s these positions that may cap oil’s current price rise.
Brent crude is up +20c a barrel at +$55.14, while U.S. light crude oil (WTI) is up +25c at +$52.21.
Both contracts fell more than -$2 a barrel, or around -4% yesterday on doubts that OPEC and other key oil producers would capable of cutting output as promised to try to reduce a global oversupply – the Saudi’s and Abu Dhabi both appear to be reducing production, but it is not clear whether other big producers such as Iraq will follow suit.
The higher that crude prices go encourages more North American producers to come back on line, which is counterproductive to OPEC’s and non-OPEC members efforts.
Note: On Nov 30th OPEC Ministers confirmed cutting output to +32.5M bpd, a six-month agreement that started on Jan 1.
A modest demand for “physical” gold from emerging markets (China and India) is providing the precious metal support on pullbacks.
Gold, the safe-haven asset seems to have regained some market attention as prices trade atop of their multi-month lows. Gold for February delivery was recently up +0.5% at +$1,184.91 an ounce. Demand is forecasted to rise ahead of Chinese New Year.

3. Sovereign yield curves flatten
Since Trumps surprise election win in November, global bonds have lost over -$1T in value on expectations for higher rates. U.S 10-year yield spiked from +1.60% to +2.35% in next to no time.
U.S fixed income data yesterday revealed that Hedge funds and money managers held a net -$94.3B in Treasury futures contracts betting on a rise in U.S bond yields for the week that ended Jan 3 – its the largest ‘short’ position in nearly nine-years. The amount has soared from -$42.2B for the week that ended on the U.S Election Day.
The higher yield momentum has been pulling back after U.S. 10's closed at +2.6% in mid-December. The current 10’s are trading at +2.388% ahead of this morning’s open. Any further concerns on Trump’s economic policies and these ‘short’ positions will begin to take back more product.
Elsewhere, Aussie government bonds climbed for the third time in four sessions, with yields down -5bps, or -0.06% to +2.71%. Similar Kiwi maturities are yielding +3.17%, down -8bps

4. “Big” dollar under renewed pressure
Currently, most of the markets ‘political’ concerns are being expressed via forex, rather than equities or fixed income.
The USD continues to consolidate outright against most of its major trading pairs as dealers take their cue from narrowing U.S yield spreads (2’s 10’s are under +112 bps vs. +137 bps in mid-Dec).
Note: The dollar is off its overnight lows ahead of the U.S open.
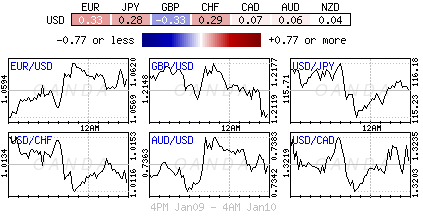
In Asia, USD/JPY tested ¥115.20 during the session, but has since gained some traction (¥115.89). Europe’s single unit continues to hover close to the psychological €1.06 handle, while the pound (£1.2134) underperforms over fears of a ‘hard’ Brexit becoming a reality.
Emerging market currencies remain a market focus of attention. TRY again printed fresh record lows this morning (€3.95) as Turkey’s parliament continues to debate over constitutional amendments that would hand the President sweeping executive powers and limit “checks and balances”. Dealers are anticipating a more aggressive stance from the country’s central bank.
Elsewhere, dealers and speculators seem to be placing some aggressive bets on the removal of the EUR/CZK currency floor (€27.00) after the Czech Dec inflation numbers hit the central banks +2% target for the first time in four-years.

5. Norway is expected to cut rates as inflation falls
Norwegian CPI-ATE inflation – Norges Bank’s favoured prices measure ex-energy and direct effects of tax changes – fell to +2.5% last month from Novembers reading of +2.6%.
The market consensus was expecting an increase. Fixed income dealers are beginning to price in further weakness, prompting Norges bank to cut its key policy rate by -25bps in H2. Analysts believe that if NOK (€9.0758) remain at its current level, imported consumer goods inflation might slow to about -2% around the middle of the year, knocking a further -1.5% off the headline CPI-ATE.