- English (UK)
- English (India)
- English (Canada)
- English (Australia)
- English (South Africa)
- English (Philippines)
- English (Nigeria)
- Deutsch
- Español (España)
- Español (México)
- Français
- Italiano
- Nederlands
- Polski
- Português (Portugal)
- Português (Brasil)
- Русский
- Türkçe
- العربية
- Ελληνικά
- Svenska
- Suomi
- עברית
- 日本語
- 한국어
- 简体中文
- 繁體中文
- Bahasa Indonesia
- Bahasa Melayu
- ไทย
- Tiếng Việt
- हिंदी

VEON Ltd (VEON)
VEON Ltd stock price live, this page displays NASDAQ VEON stock exchange data. View the VEON premarket stock price ahead of the market session or assess the after hours quote. Monitor the latest movements within the VEON Ltd real time stock price chart below.
What Is the VEON Ltd Stock Price Today?
The VEON Ltd stock price today is 49.3500.
What Is the Stock Symbol for VEON Ltd?
The stock ticker symbol for VEON Ltd is VEON.
Is VEON the Same as $VEON?
$VEON is a common way to refer to the VEON Ltd ticker symbol in social media, forums, and online discussions. The dollar sign is a shorthand convention used to indicate that it is a stock ticker symbol
What Stock Exchange Does VEON Ltd Trade On?
VEON Ltd is listed and trades on the NASDAQ stock exchange.
Is VEON Ltd a Good Stock to Buy?
Determining whether VEON Ltd—or any stock—is a good buy requires comprehensive analysis. To evaluate its potential, users can sign up to InvestingPro, where they can assess the current VEON Ltd share price compared with the fair value and other essential metrics.
You can find more details by visiting the additional pages to view historical data, charts, latest news, analysis or visit the forum to view opinions on the VEON quote. (ISIN: US91822M5022)
Fair Value
An estimate of a stock's true price based on valuation models like discounted cash flow, peer valuation multiples, and dividend discount models.
Day's Range
48.5550
51.1000
52 wk Range
34.5500
64.0000
VEON is not included in our AI-picked strategies. See which stocks are.
Fair Value
An estimate of a stock's true price based on valuation models like discounted cash flow, peer valuation multiples, and dividend discount models.
Day's Range
48.555051.1000
52 wk Range
34.550064.0000
Key Statistics
Edit
Prev. Close
Open
Volume
Average Vol. (3m)
1-Year Change
Book Value / Share
Fair Value
Fair Value Upside
Market Cap
Shares Outstanding
Revenue
Net Income
EPS
EPS Growth Forecast
Next Earnings Date
N/A
(N/A)
Dividends Payment Streak
P/E Ratio
Return on Assets
Return on Equity
Gross Profit Margin
Price/Book
EBITDA
EV/EBITDA
Beta
VEON Scorecard
Company’s Health
Assesses a company's financial position by analyzing its market value, financial ratios, industry benchmarks, and competitors.
UnlockFair Value
An estimate of a stock's true price based on valuation models like discounted cash flow, peer valuation multiples, and dividend discount models.
Unlock PriceTechnical Analysis
Strong Sell
Analysts Sentiment
Strong Buy
Price Target
79.5217
Upside
+61.14%
Members' Sentiments
Bearish
Bullish
ProTips
Tips that distill complex financial data into concise, actionable investment insights.
Impressive gross profit margins
Technical Analysis
Summary
Strong Sell
Sell
Neutral
Buy
Strong Buy
Strong Sell
Technical Indicators
Strong Sell
Moving Averages
Sell
Analyst Ratings
4 Buy
0 Hold
0 Sell
Ratings:
4 analysts
Overall Consensus
Strong Buy
Analysts 12-Month Price Target:
Average 79.5217
(+61.14% Upside)
VEON Ltd Earnings Call Summary for Q4/2025
- VEON stock surged 9.3% to $48.43 in premarket trading; trades at P/E of 4.99, significantly undervalued per InvestingPro analysis
- Ukraine operations exceeded Q4 2025 forecasts with revenue up 10% and EBITDA up 18% despite ongoing geopolitical conflict
- Pakistan shows strong growth potential from $500M spectrum auction, low 5G penetration, and increased data consumption opportunities
- Forward guidance projects revenue of $4.35B (FY2025) and $4.67B (FY2026); diluted EPS at $8.91 with 19% free cash flow yield
- Key risks include Ukraine geopolitical instability, economic fluctuations in core markets, and competitive telecom sector pressures
Last Updated: 03/13/2026, 09:13 AM
Read Full TranscriptVEON investor slides for Q4/2025
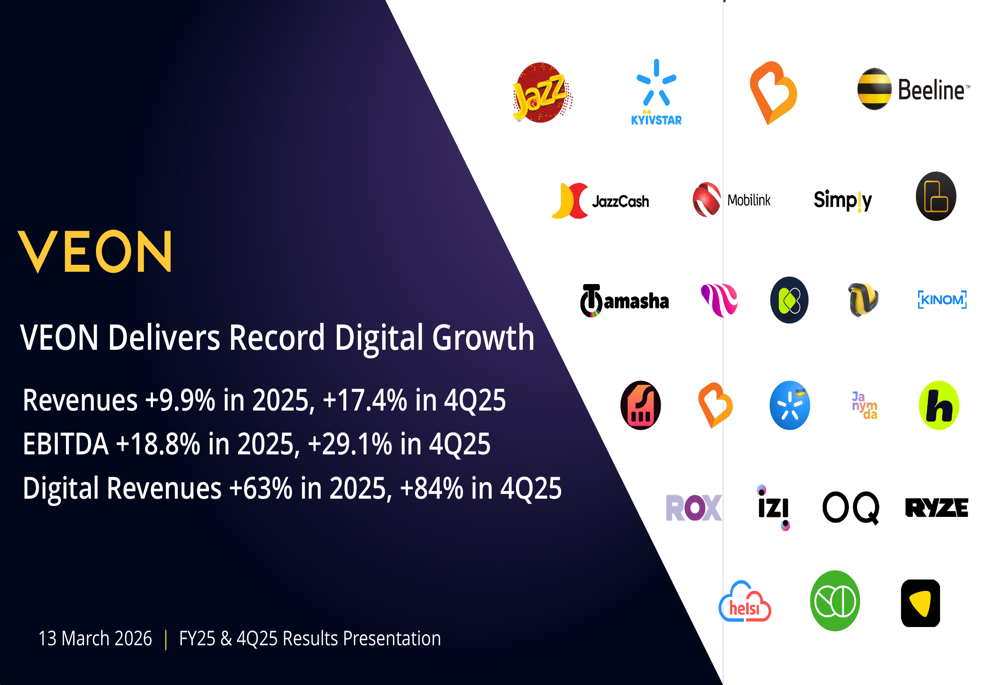
Last Update: Mar 13, 2026
See full investor slides
Earnings
Latest Release
Mar 13, 2026
EPS / Forecast
-11.00 / 1.50
Revenue / Forecast
1.17B / --
Compare VEON to Peers and Sector
Metrics to compare | VEON | Sector Sector - Average of metrics from a broad group of related Technology sector companies | Relationship RelationshipVEONPeersSector | |
|---|---|---|---|---|
P/E Ratio | 6.4x | 11.4x | 7.1x | |
PEG Ratio | 0.21 | 0.04 | 0.01 | |
Price / Book | 2.5x | 2.6x | 1.8x | |
Price / LTM Sales | 0.8x | 1.8x | 1.4x | |
Upside (Analyst Target) | 51.7% | −9.9% | 30.1% | |
Fair Value Upside | Unlock | 8.7% | 16.9% | Unlock |
VEON Ltd. provides telecommunications and digital services in Pakistan, Ukraine, Kazakhstan, Bangladesh, and Uzbekistan. The company offers mobile telecommunications services under prepaid and postpaid subscriptions, including value-added and call completion services, national and international roaming services, wireless Internet access, mobile financial services, and mobile bundles; fixed-line telecommunications using fiber optic networks; cross-border transmission services; prepaid scratch cards and electronic recharge options; mobile services on 2G, 3G, and 4G/LTE networks; cloud solutions, including consumer storage apps; local, long-distance, and international voice services; and customer support through contact centers. It also provides FikrFree, a digital insurance marketplace; Tamasha, a video streaming app; ROX, a digital lifestyle brand; Garaj, a cloud platform; ApnaClinic and Helsi digital healthcare platforms; SIMOSA, ZARR, and RYZE lifestyle platforms; Kyivstar TV, a media streaming service; My Kyivstar, a self-service application; Uklon, a ride-hailing and delivery platform; Adwisor, an adtech platform; Simply, a mobile-only neobank; BeeTV, an entertainment platform; Hitter and riitm music streaming platforms; MyBL, Janymda, and Hambi super-apps; AI tutor, an AI-powered learning assistant; Toffee, an infotainment platform; BCloud, a digital infrastructure solution; Beepul, a financial services solution; KINOM, a digital entertainment platform; BeeMarket, an electronics and home appliance marketplace; Hambi Davo, a suite of digital health services; and OQ, a digital platform. The company distributes its products and services through a direct sales force, franchises, third-party retailers, distributors, supermarkets, stores, chains, online, offices, and other channels. The company was formerly known as VimpelCom Ltd. and changed its name to VEON Ltd. in March 2017. VEON Ltd. was founded in 1992 and is headquartered in Dubai, the United Arab Emirates.
Ownership
Ownership Overview
People Also Watch
FAQ
What Is the VEON (VEON) Stock Price Today?
The VEON stock price today is 49.3500 USD.
What Stock Exchange Does VEON Trade On?
VEON is listed and trades on the Nasdaq Stock Exchange.
What Is the Stock Symbol for VEON?
The stock symbol for VEON is "VEON."
What Is the VEON Market Cap?
As of today, VEON market cap is 3.3900B USD.
What Is VEON's Earnings Per Share (TTM)?
The VEON EPS (TTM) is 7.6200.
From a Technical Analysis Perspective, Is VEON a Buy or Sell?
Based on moving averages and other technical indicators, the daily buy/sell signal is Strong Sell.
How Many Times Has VEON Stock Split?
VEON has split 1 times.
How Many Employees Does VEON Have?
VEON has 18938 employees.
What is the current trading status of VEON (VEON)?
As of May 05, 2026, VEON (VEON) is trading at a price of 49.3500 USD, with a previous close of 49.3500 USD. The stock has fluctuated within a day range of 48.5550 USD to 51.1000 USD, while its 52-week range spans from 34.5500 USD to 64.0000 USD.
What Is VEON (VEON) Price Target According to Analysts?
The average 12-month price target for VEON is 79.5217 USD, with a high estimate of 100 USD and a low estimate of 65.9 USD. 4 analysts recommend buying the stock, while 0 suggest selling, leading to an overall rating of Strong Buy. The stock has an +61.14% Upside potential.
What Is the VEON Premarket Price?
VEON's last pre-market stock price is 50.0000 USD. The pre-market share volume is 700.0000, and the stock has decreased by 0.6500, or 1.3200%.
Industry Spotlight
Install Our App
Risk Disclosure: Trading in financial instruments and/or cryptocurrencies involves high risks including the risk of losing some, or all, of your investment amount, and may not be suitable for all investors. Prices of cryptocurrencies are extremely volatile and may be affected by external factors such as financial, regulatory or political events. Trading on margin increases the financial risks.
Before deciding to trade in financial instrument or cryptocurrencies you should be fully informed of the risks and costs associated with trading the financial markets, carefully consider your investment objectives, level of experience, and risk appetite, and seek professional advice where needed.
Fusion Media would like to remind you that the data contained in this website is not necessarily real-time nor accurate. The data and prices on the website are not necessarily provided by any market or exchange, but may be provided by market makers, and so prices may not be accurate and may differ from the actual price at any given market, meaning prices are indicative and not appropriate for trading purposes. Fusion Media and any provider of the data contained in this website will not accept liability for any loss or damage as a result of your trading, or your reliance on the information contained within this website.
It is prohibited to use, store, reproduce, display, modify, transmit or distribute the data contained in this website without the explicit prior written permission of Fusion Media and/or the data provider. All intellectual property rights are reserved by the providers and/or the exchange providing the data contained in this website.
Fusion Media may be compensated by the advertisers that appear on the website, based on your interaction with the advertisements or advertisers.
© 2007-2026 - Fusion Media Limited. All Rights Reserved.