


Market Stabilization | North American business stabilization anticipated in fiscal 2027 could mark an inflection point, enabling shift from recovery mode to growth-focused initiatives |
Analyst Outlook | Barclays maintains Equal Weight rating with $5.00 price target, reflecting cautious optimism about the company's turnaround trajectory and profitability potential |
Partnership Loss | The conclusion of Stephen Curry's endorsement deal in 2026 threatens brand relevance in basketball footwear and removes a crucial marketing differentiato |
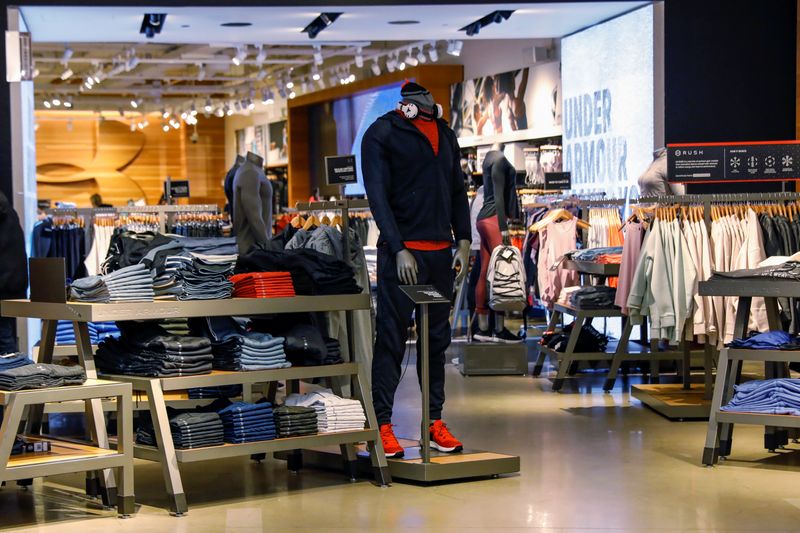
Operational Progress | Under Armour raised adjusted operating income guidance to $95-110 million, demonstrating improved cost discipline and efficiency gains despite ongoing sales challenges |
Metrics to compare | UAA | Sector Sector - Average of metrics from a broad group of related Consumer Cyclicals sector companies | Relationship RelationshipUAAPeersSector | |
|---|---|---|---|---|
P/E Ratio | −5.7x | 17.0x | 10.4x | |
PEG Ratio | 0.04 | 0.28 | 0.02 | |
Price / Book | 2.0x | 4.2x | 1.4x | |
Price / LTM Sales | 0.6x | 1.1x | 0.9x | |
Upside (Analyst Target) | −17.3% | 20.1% | 27.4% | |
Fair Value Upside | Unlock | 20.6% | 12.7% | Unlock |
Under Armour, Inc., together with its subsidiaries, engages designs, developing, marketing, and distributing performance apparel, footwear, and accessories for men, women, and youth. The company provides its apparel in compression, fitted, and loose fit types. It also offers footwear products for running, training, basketball, cleated sports, recovery, and outdoor applications, as well as for casual use. In addition, the company provides accessories, which include gloves, bags, headwear, and socks. It primarily offers its products under the UNDER ARMOUR, ARMOUR, HEATGEAR, COLDGEAR, HOVR, UA, PROTECT THIS HOUSE, I WILL, ARMOUR FLEECE, and ARMOUR BRA brands. The company sells its products through wholesale channels, including national and regional sporting goods chains, independent and specialty retailers, department store chains, mono-branded Under Armour retail stores, institutional athletic departments, and leagues and teams, as well as independent distributors; and directly to consumers through its own brand and factory house retail stores and e-commerce websites. It operates in the United States, Canada, Europe, the Middle East, Africa, the Asia-Pacific, and Latin America. The company was incorporated in 1996 and is headquartered in Baltimore, Maryland.