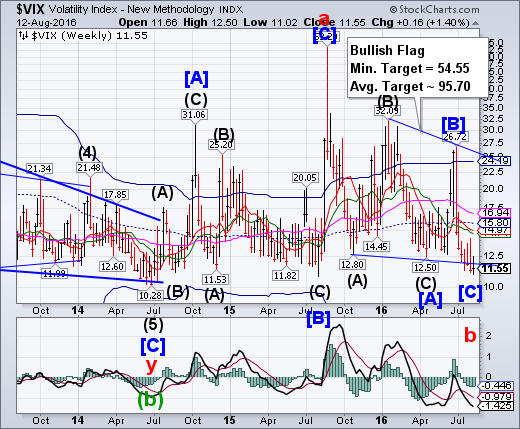
CBOE Volatility Index extended its Master Cycle low by three weeks on Tuesday. Cycle extensions are rare, but may often increase the intensity on the swing back.The VIX closed higher than last week.This may be the end of a year-long retracement from the August 2015 highs. .
(ZeroHedge) The relationship between the VIX and the spread between high yield bonds over 10-Year treasuries is highly correlated (87% over the past 15 years).This, of course, makes intuitive sense. The VIX tends to spike when confidence in stocks or the economy is shaky. Which is also true for high yield bonds.When investors begin to worry that high yield issuers won’t be able to make debt payments because of, for example, slowing growth, high yield bonds usually sell off against treasury bonds. This occurred earlier this year in February when the VIX spiked to over 28 and the spreads widened to 850 bps.
SPX continues to rally inside its Broadening Top.
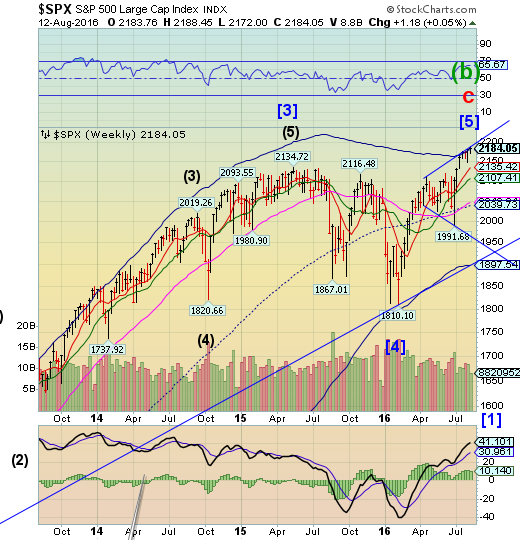
This marks the fifth week that SPX has been challenging the trendline of its Orthodox Broadening Top and weekly Cycle Top resistance at 2181.93. SPX has fulfilled all the fractal requirements for a completed uptrend.In fact, the Wave [5] fractal target was 2157.71, a target that was achieved three weeks ago.
(ZeroHedge) Productivity plunges... Retail Sales disappoints... Consumer's Confidence in their finances lowest since 2014... Weak China data... global bond yields at record lows... US yield curve back near cycle flats... US and Global GDP expectations at cycle lows...BUT best week in oil in 4 months... simultaneous record highs in S&P, Dow, Nasdaq for first time since Dec 31 1999...
NDX closes above its Cycle Top resistance.
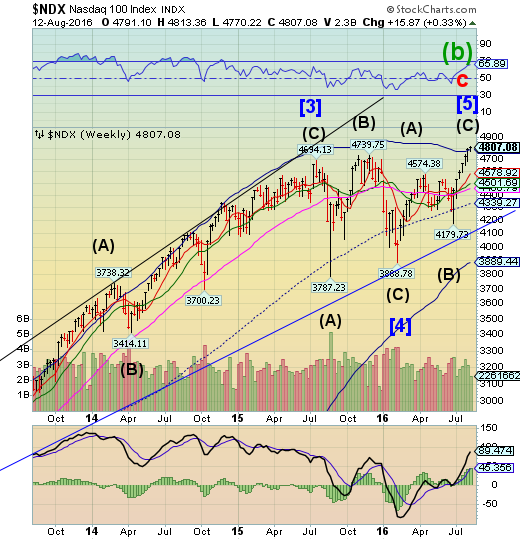
NDX closed above its weekly Cycle Top at 4789.09.It has reached its fractal target of 4732.24 on August 3. A slip beneath the Cycle Top may indicate a reversal is in motion.
The Dow Jones Industrial Average Index has met its fractal target this week, as well..
(ZeroHedge) In a historic trifecta, yesterday for the first time this century, all three US indexes posted concurrent record highs. The last time this had happened was on December 31, 1999.
(ZeroHedge) Moments ago, during an interview on Wharton Business Radio, St. Louis Fed president James Bullard, who recently flipped from the Fed's biggest hawk to its more vocal dove, said that he sees just one rate interest in the next few years. Judging by the market action ever since the February lows, he is merely confirming what the market already knows. He also confirmed that the Fed will never hike rates at a time when even one recent economic data point has printed negative, saying "the right time to move rates is after good economic news."
High Yield Bond Index remains flat this week.
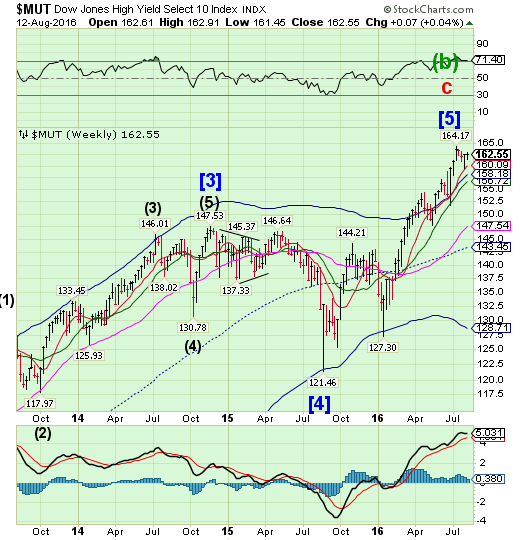
The High Yield Bond Index consolidated it a narrow range this week, closing virtually where it began. Investors should now be on the alert for a decline beneath its Short-term support at 160.09 for a probable sell signal. Wall Street is furiously issuing new products as they see the window closing soon.
(MarketRealist) High-yield bond issuance rose last week due to better yields compared to sub-zero yields in other developed countries.
Robert Tipp, chief investment strategist for the fixed-income division of Prudential Financial, said in an interview with Bloomberg on August 6, 2016, “Investors that are in the higher-yielding sectors, within whatever is their risk parameter set, are going to do very well over the long run.” He added, “The Fed’s going to have a very hard time raising rates.”
According to Tipp, investors can earn attractive returns if they stay invested in corporate debt.
USB rises above Short-term support.
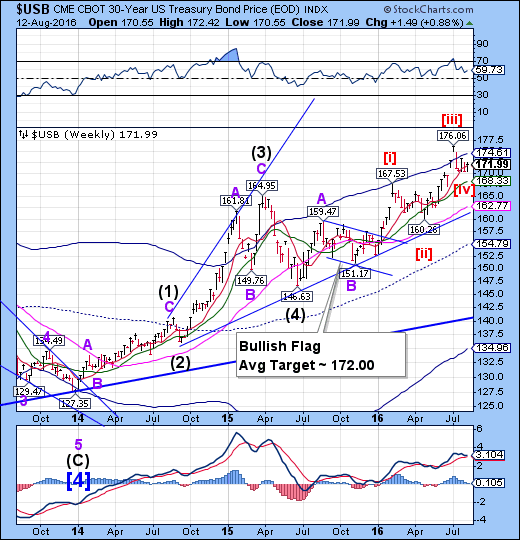
The Long Bond closed above Short-term support at 171.78, indicating the capability of a move higher. Should that be the case, it may be due to rally for the next two weeks. A potential surge to 185.00 may be indicated.
(WSJ) U.S. government bonds strengthened Friday as soft retail sales data reinforced expectations that the Federal Reserve will be slow to raise interest rates.
Sales at retailers and restaurants were flat in July, below the average forecast of economists surveyed by The Wall Street Journal who had projected a 0.5% increase. Sales excluding autos and a gauge of prices paid by U.S. businesses also fell below expectations.
Weak consumer spending could translate to slower economic growth, which would make it more difficult for the Fed to raise interest rates this year, according to analysts. Higher interest rates tend to dilute the value of outstanding bonds.
The Euro bounces from trendline support.
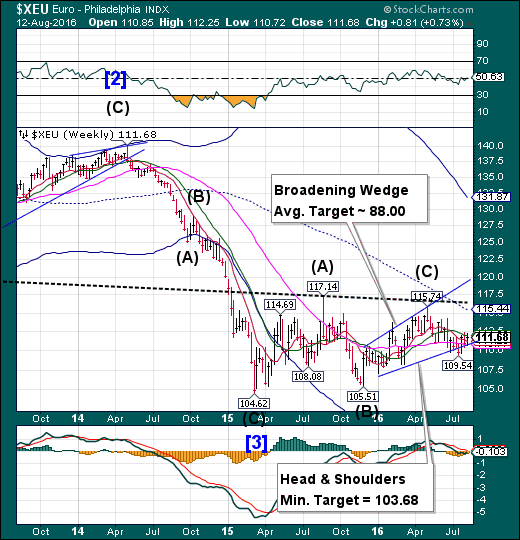
The Eurobounced from the trendline of its Broadening Wedge formation to challenge Intermediate-term resistance at 111.96.The Head & Shoulders formation may still be valid, so a second break of the trendline may put the Euro back into a possible bear market with the loss of that key support.
(Bloomberg) Germany kept its place as the pillar of the euro-area economy in the second quarter, offsetting stagnation in Italy and supporting momentum before Britain’s vote to leave the European Union.
While expansion in the region cooled to 0.3 percent in the three months through June, that was in line with economists’ expectations. It was also the 13th straight quarter of growth. The German economy expanded 0.4 percent, twice as fast as predicted, while Italy’s unexpectedly stagnated.
Euro Stoxx 50 rallies back above the trendline.
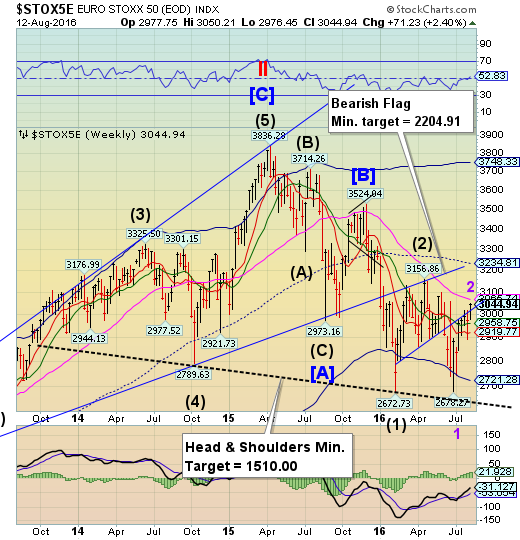
The EuroStoxx 50 Index rallied above the Bearish Flag trendline through toward long-term resistance at 3065.74.The Cycles Model identifies this as an inverted Trading Cycle, or a probable false flag, to get more investors hooked before the sell-off. Stoxx are still down 7% year-to-date.
(Bloomberg) European stocks fell after retail data in the U.S. missed economist forecasts, triggering concerns about the strength of the economy.
Commodity producers and automakers dragged the Stoxx Europe 600 Index down 0.2 percent at the close, after it traded little changed for most of the day. Sales at U.S. retailers stalled in July, while economists expected a 0.4 percent increase. The equity index, which erased its post-Brexit slump on Thursday, trimmed its weekly gain to 1.4 percent, with the volume of shares changing hands today about 39 percent lower than the 30-day average.
The Yen consolidates beneath the Cycle Top.
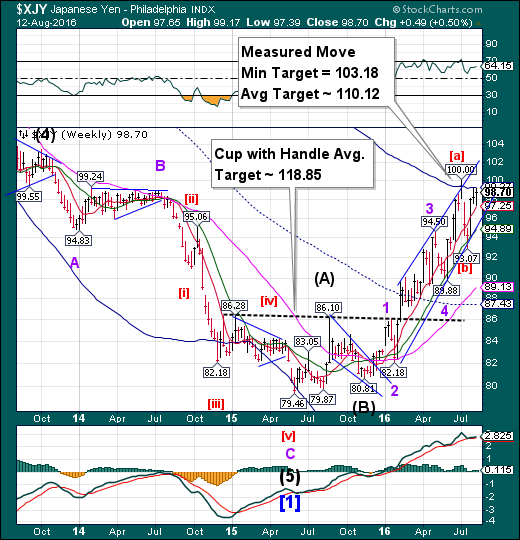
The Yen consolidated under the Cycle Top resistance at 99.27 this week.The Yen may now be capable of a breakout above the Cycle Top and its prior high at 100.00. The probable new period of strength may last through late September, giving it plenty of time to attempt to make its Cup with Handle target.
(Bloomberg) The yen held onto its biggest two-day decline in four weeks as traders weigh whether better-than-forecast jobs growth will persuade the Federal Reserve the U.S. economy is strong enough to cope with higher benchmark interest rates.
Japan’s currency dropped versus all 16 of its major peers since Thursday. Hedge funds and other large speculators cut bullish yen bets last week to the lowest in two months. The yen was also undermined after data Friday showed U.S. payrolls and wages climbed in July, prompting traders to raise the prospect of a Fed rate increase this year to almost 50 percent.
The Nikkei 225 breaks out above its July high.
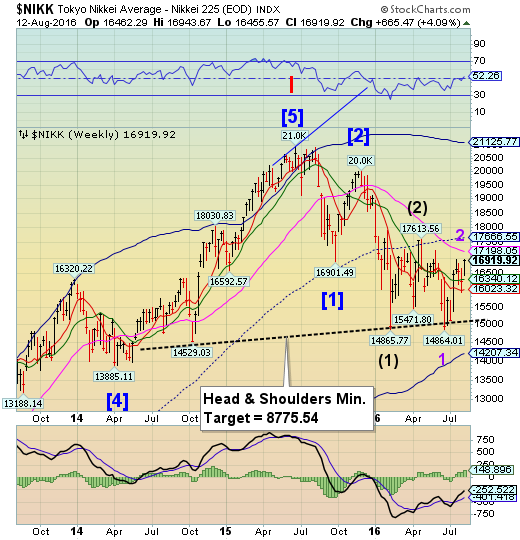
The Nikkei broke out above its July high at 16938.36. However, it is only by a margin of 4 points and the Nikkei is still over 2100 points beneath its December 31 close.A decline to the Head & Shoulders neckline may be imminent, as the next Cycle low appears to be due by the end of August;
(Bloomberg) Japanese shares recorded their biggest weekly gain in a month, following U.S. equities higher as the yen held losses while power producers and agricultural stocks led the advance.
The Topix index added 0.6 percent to 1,323.22 at the close in Tokyo, capping a 3.4 percent increase this week. The measure was closed on Thursday for the Mountain Day holiday. The Nikkei 225 Stock Average climbed 1.1 percent. The yen traded 0.1 percent lower at 102.10 per dollar after dropping 0.7 percent on Thursday. The S&P 500 Index, Dow Jones Industrial Average and Nasdaq Composite Index rose together to record highs for the first time in 16 years amid surprising earnings.
U.S. Dollar declined to Intermediate-term support.
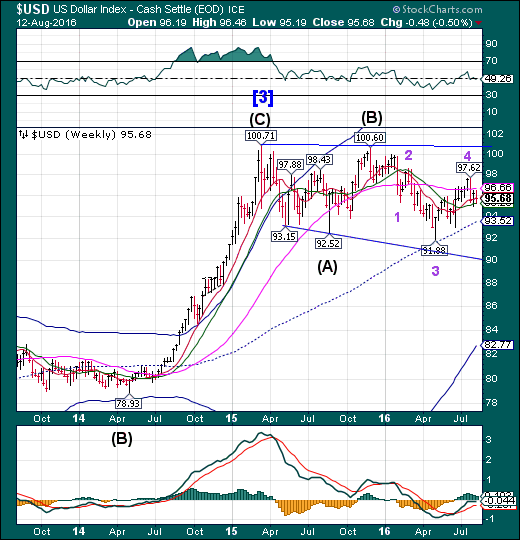
USD declined from Long-term resistance at 96.66 to challenge Intermediate-term support at 95.26. The Cycles Model suggests that the decline may continue another week or longer before a significant bounce.It appears that the weekly mid-Cycle support at 93.52 may play an important role in forming the next low. .
(Reuters) U.S. retail sales were unexpectedly flat in July as Americans cut back on discretionary spending, pointing to a moderation in consumption that could temper expectations of a sharp pickup in economic growth in the third quarter.
Other data on Friday showed that producer prices recorded their biggest drop in nearly a year in July amid declining costs for services and energy goods. Cooling consumer spending and tame inflation suggest the Federal Reserve will probably not raise interest rates anytime soon despite a robust labor market.
Gold repelled by its Cycle Top resistance.
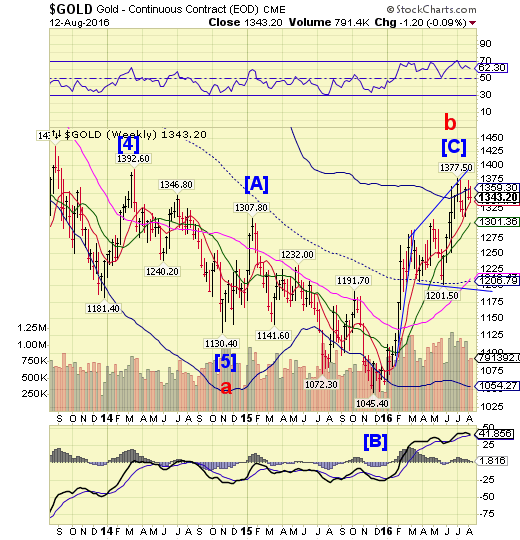
Gold probed again at its Cycle Top resistance at 1359.30, but reversed and closed above Short-term support at 1337.73. A further decline beneath that support may give gold a sell signal.The Orthodox Broadening Top suggests a decline to 1165.00.
(Bloomberg) As far as technical indicators go, the gold rally is losing steam -- and the market is finally taking notice.
Gold futures posted the first back-to-back weekly losses for a most-active contract in more than two months after prices failed to break above the three-week high reached on Aug. 2. Futures ended lower on Friday, even after prices shot up following the release of disappointing U.S. government data that weakened the case for the Federal Reserve to raise interest rates.
“We lost momentum from that early move,” Tim Evans, the chief market strategist at Long Leaf Trading Group Inc. in Chicago, said in a telephone interview. “I think a lot of the buyers that propelled that early move up just threw in the towel, and brought us back to the lower part of the range.”
Crude Oil moves higher at Long-term support.
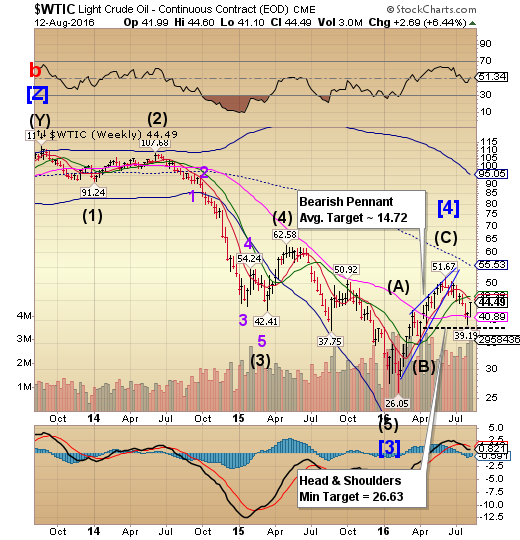
Crude renewed its strength above Long-term support at 40.89 this week to rally toward its next resistance zone. Today is a Primary Cycle turn date, suggesting a decline to (or beneath) the neckline may resume shortly.
(ZeroHedge) WTI is now up 14% from its lows last week, with Sept 2016 trading back above $44.50 at 3-week highs.
Oil's rapid OPEC-headline-driven recovery continues...
Despite rising inventories (and record production levels in OPEC), the Saudi statement hope remains and prompted the biggest spike in WTI Open Interest since August 2006 yesterday!
Shanghai Composite probes toward Long-term resistance.
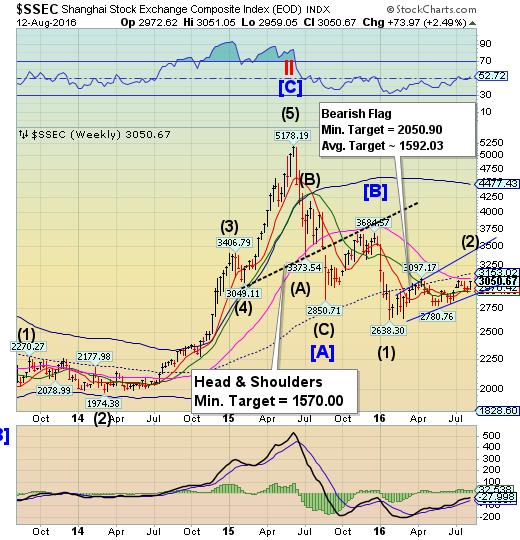
The Shanghai Index probed toward Long-term resistance at 3088.46 this week. The Cycles Model suggests that the period of strength may last another week before a reversal. The bullish target appears to be the weekly mid-Cycle resistance at 3153.02 or higher.Following that may be an extended decline through mid-October.
(ZeroHedge) Following an unprecedented credit expansion by China, which in the first few months of 2016 injected well over a trillion dollars in total credit, the payback - as previewed here - is coming. As reported earlier, overnight China reported that a swath economic activity, from factory output to investment and retail sales, slowed last month, reflecting renewed weakness in China’s economy.
All three growth numbers announced by the National Bureau of Statistics Friday morning came in weaker than expectations and also slowed from June's level. The Industrial Production rose 6.0%, compared to the median forecast of 6.2%. Fixed asset investment slowed to another 16-year low of 8.1% during the first seven months, missing the median forecast of 8.8%. Retail sales growth also decelerated to 10.2% in July, lower than the median forecast of 10.5%.
The Banking Index fails its attempt at mid-Cycle resistance.
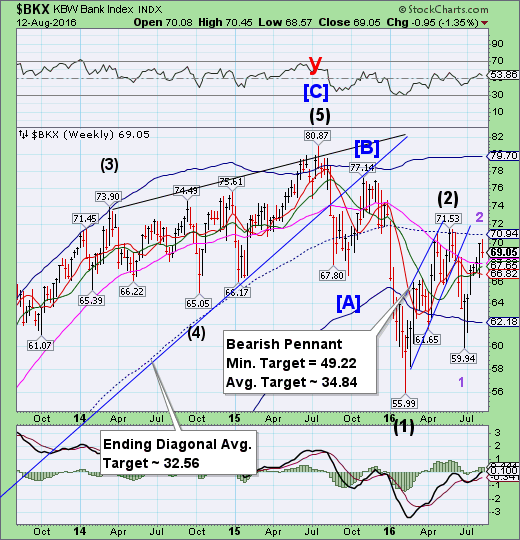
--BKX failed in its effort to challenge mid-Cycle resistance at 70.94.The Cycles Model suggests that an extension of a period of strength peaked on August 8.It does not appear that the Cycle Bottom support will stop the ensuing decline.
(NikkeiAsianReview) The Bank of Japan's negative-rate policy will squeeze profits at the three Japanese megabanks by at least 300 billion yen ($2.96 billion) or so in the current fiscal year ending next March, government estimates show.
A survey by the Financial Services Agency focused on how negative interest rates impact interest income, derivatives trading, and such retail transactions as sales of asset management products at the three megabanks. Mitsubishi UFJ Financial Group's (NYSE:MTU) profit will fall by 155 billion yen, Sumitomo Mitsui Financial (NYSE:SMFG) will lose between 75 billion yen and 76 billion yen in black ink, and Mizuho Financial Group's profit will retreat by 61 billion yen, the results showed. Narrower interest rate spreads are the chief culprit.
(ZeroHedge) Over the last two years, the Fed Up Campaign has routinely brought a coalition of low-wage workers to Jackson Hole, Wyoming to protest Federal Reserve hike rates amidst the unequal “economic recovery.” The Jackson Hole event is invite only, closed to the public and costs $1,000 per person to attend.
It appears that this year, Janet Yellen and company went out of their way to ensure there would be no such protests diverting the attention of the nation's most esteemed economists.
(ZeroHedge) The failures of government intervention in the economy have made headlines yet again. Recent stress tests by the Federal Housing Finance Agency found something sinister brewing under the surface at notorious mortgage giants Fannie Mae and Freddie Mac. The results show that these puppet companies could need up to a $126 billion bailout if the economycontinues to deteriorate.
That’s right — the two companies that were taken over by the government and that sucked $187 billion from the treasury could be entitled to more taxpayer money. The toxic home loans bought during the last crisis coupled with a lack of liquidity have suddenly become serious risk factors. The so-called “recovery” that has been trumpeted for years by countless politicians and economists is falling apart in plain view. The media will do just about anything to assure the public that this is all isolated and overblown, but the canary in the coal mine has just dropped dead.
(ZeroHedge) Two weeks ago, when looking at the recent surge in short-term funding rates in general, and Libor in particular, we said that this is the result of a scramble by various funds to change their asset ahead of an October 14 deadline for money market reform. Recall that "On October 14, 2a-7 money fund reforms will require some prime money market mutual funds (those that invest in non-government issued assets) to float their net asset value (NAV) or, under certain circumstances, to impose redemption gates and liquidity fees on redemptions. Rather than face these regulatory constraints, many investors have started pulling assets from prime funds, and a number of prime funds have converted to government-only funds (which are exempt from these regulations). Since late-2015 alone, prime fund assets have declined by nearly $450 billion, reducing the supply of dollars that funded private sector short-term liabilities."
(ZeroHedge) After the ECB concluded its latest annual stress test, which as expected found no problems with Europe's largest banks instead scapegoating Italy's well-known troubled banks in results that were widely discredited by the market, yesterday in an unexpected outcome, German economic research institute ZEW found that Germany's largest bank, Deutsche Bank (DE:DBKGn), had the highest potential capital shortfall, as much as €19 billion in a study of 51 European banks using U.S. Federal Reserve stress test methods. The capital gap is greater than DB's entire market cap.
