by Pinchas Cohen
The Week That Was
- Major central bankers showed a united front in optimism on future growth
- The ECB provided mixed signals on their outlook for the end of tapering, sending the euro into a tantrum.
- For the first time since before the financial crisis, all big US banks passed the Fed’s stress test.
- The market declined, led by a tech selloff, while financials advanced.
- Oil advanced $3.51 or 8.25 percent on 7 straight sessions, the longest run of gains in six months, since December 15-28, 2016.
The Week Ahead
Sunday
All times listed below, EDT:
19:50: Japan - Tankan Large Manufacturing Index (Q2) expected to rise to 15 from 12 in Q1. Markets to watch: Nikkei, yen, additional JPY crosses
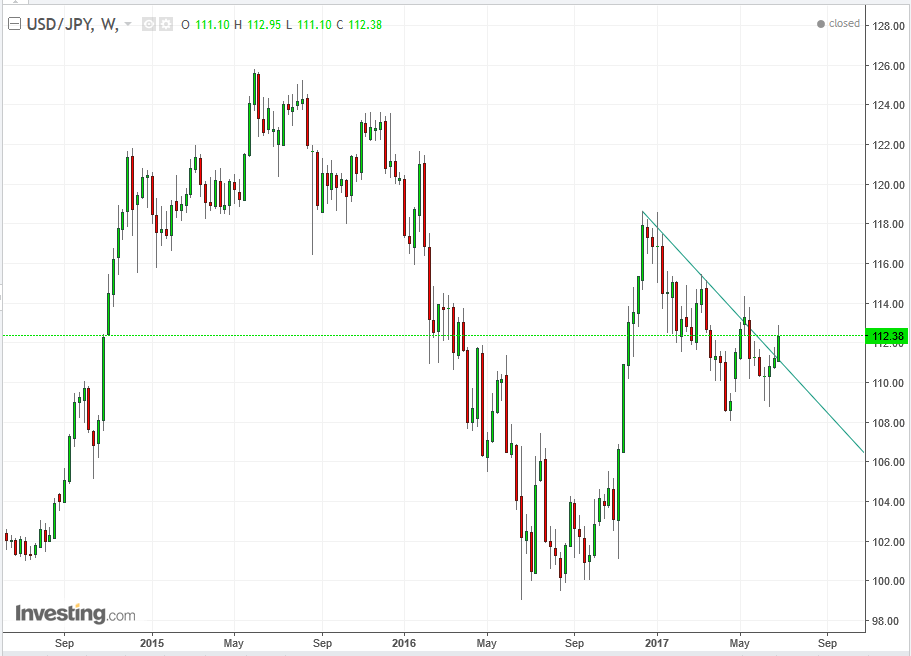
While the euro rose last week both on euro bullishness and dollar bearishness, it's interesting to note that the USDJPY has closed above its downtrend, suggesting a potential breakout for the dollar against the yen. This may suggest that investors are buying into the Fed's and the other major central banks' optimistic outlook on growth.
21:45: China - Caixin Manufacturing PMI (June) forecast to fall to 49.5 from 49.6. Markets to watch: Shanghai Composite, additional China indices, yuan, additional CNY crosses
Monday - US Markets Close Early, 1PM
1:00: Japan - Consumer Household Confidence (June) forecast to rise to 43.8 from 43.6. Markets to watch: Nikkei, yen crosses
4:30: UK - Manufacturing PMI expected to fall to 565 from 56.7. Markets to watch: FTSE 100, FTSE 250, additional UK indices, pound sterling, additional GBP crosses
5:00: Eurozone - Unemployment Rate (May) expected to fall to 9.2% from 9.3%. Markets to watch: eurozone indices, EUR crosses
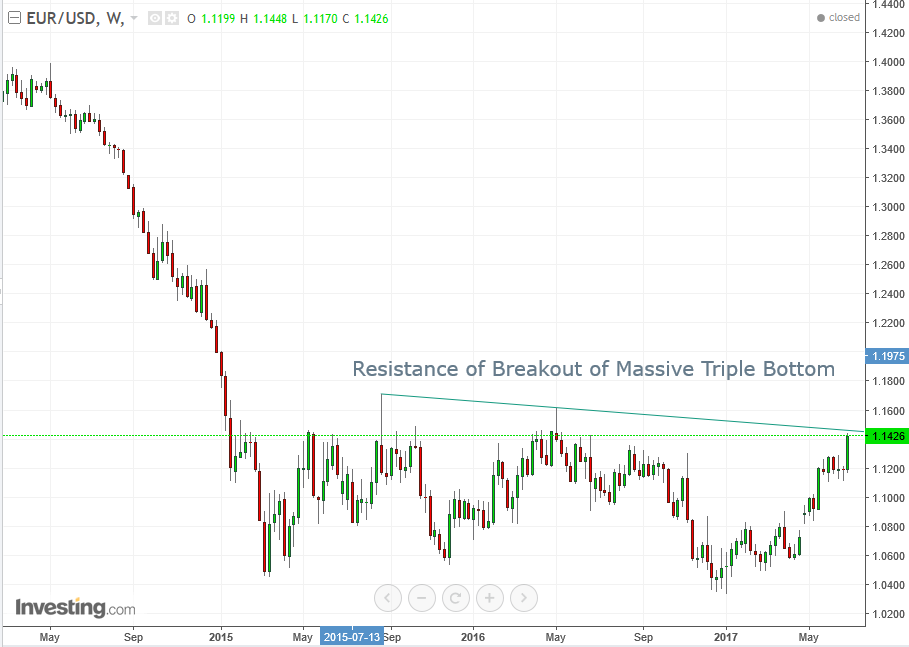
Euro traders have proven to be very bullish. They've disregarded the ECB's attempt to take back their apparent hawkishness. The European economy and its stock markets are outpacing the US. Still, market structure suggests that the euro will have a hard time moving forward, upon reaching its downtrend line since August 2015. On the other hand, if it will cross over, it will have completed a massive triple bottom with implications of a rise to the 1.24 area.
FX traders will focus on the slew of data later in the week, especially the FOMC minutes on Wednesday and Friday's NFP, which may be the impetus that will determine the fate of the pair.
10:00: US - ISM Manufacturing PMI (June): forecast to rise to 55.2 from 54.9. Markets to watch: US indices, USD crosses
EARNINGS
AZZ Incorporated
AZZ Incorporated (NYSE:AZZ) is a provider of galvanizing services, welding solutions, specialty electrical equipment and engineered services to the power generation, transmission, distribution, refining and industrial markets. The company has a market cap of $1.45 billion. AZZ operates via two divisions, an Energy segment and a Galvanizing segment. It has a 23.79 P/E ratio. The Company’s Energy segment provides services and products designed to support industrial, nuclear and electrical applications.
The company will report Q2 2017 earnings before the market opens. Analysts are expecting earnings per share of $0.61. Expected profits could reach $15.92M giving the stock 22.77 P/E in the case that $0.61 earnings per share is reported. After posting $0.44 EPS for the previous quarter, AZZ Inc’s analysts now forecast 38.64 % EPS growth.
The stock advanced by 23.65% on the Trump trade, from the day of the US election results (November 9) through December 7, outperforming the S&P 500’s 4.7 percent gain five-fold, on the expectation that President Trump would be beneficial for infrastructure stocks, one of the key pieces of expected legislation his administration was supposed to deliver. However, it failed to move beyond its March 7 peak and has been declining ever since, with losses up to 21-percent. Right now it’s 17.5 percent lower than the December 7 peak, at the end of the Trump trade. The S&P 500 however, has advanced since that day as much as 9.5 percent, and is now 8.15 percent higher, recently reaching record highs.
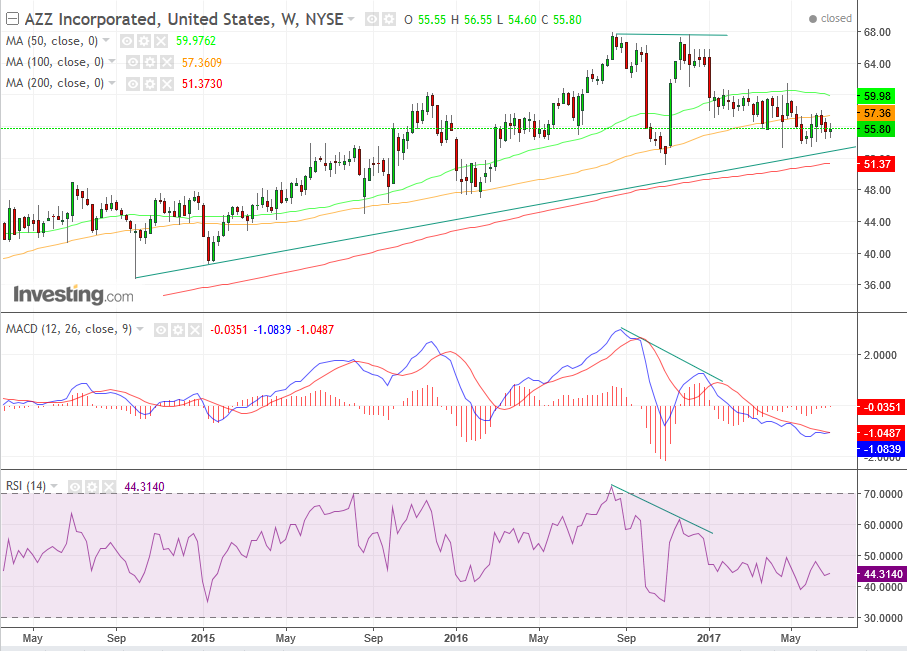
The stock's price has returned to its uptrend line since September 2014. Should it fall beneath, it would be the first signal of a potential double top. Otherwise, it may bounce on its uptrend line and retest the $67-$68 double peak. On the daily chart, the price has crossed below all 3 major moving averages, while in the weekly chart, it has crossed below the 50 and 100 but still above the 200, which is waiting beneath the uptrend line.
The weekly MACD is attempting to climb back up, after having been oversold, and the RSI has provided a negative divergence. While the price peaks of August 2016 and December 2016 are flat, the RSI’s corresponding second peak has fallen much lower, suggesting the price may follow. Fact is, the price fell 20.8% since, but if it completes a double top, it has a long way down.
Tuesday – US Independence Day – US Market Closed
00:30: Australia - RBA Rate Decision no change in policy expected. Market to watch: AUD and additional AUD crosses
4:30: UK - Construction PMI (June) forecast to fall to 55 from 56. Markets to watch: UK indices, GBP crosses
Wednesday
21:45: China - Caixin Services PMI (June) expected to fall to 52.4 from 52.8. Markets to watch: China indices, CNY crosses
4:30: UK - Services PMI (June) expected to fall to 53.4 from 53.8. Markets to watch: UK indices, GBP crosses
5:00: Eurozone - Retail Sales (May) expected to see a rise of 0.3% MoM and 2.6% YoY, from 0.1% and 2.5% respectively. Markets to watch: eurozone indices, euro and EUR crosses
14:00: US - FOMC Minutes this should give a more detailed explanation of the thinking behind the June rate increase. Markets to watch: US indices, USD crosses
8:15: US - ADP Employment report (June) delayed by a day due to the Independence Day holiday. It's expected we'll see 230K jobs created after 253K a month earlier. Markets to watch: US indices, USD crosses
8:30: US - Trade Balance (May) expected to see the deficit narrow to $45 billion from $47.6 billion; Weekly initial jobless claims forecast to fall to 243K from 244K. Markets to watch: US indices, USD crosses
10:00: US – ISM Non-Manufacturing PMI (June): forecast to edge down to 56.6 from 56.9. Markets to watch: US indices, USD crosses
11:00: US - EIA Crude Inventories (w/e 30 June) forecast to see stockpiles rise by 130,000 barrels after a 118,000 barrel increase a week earlier. Markets to watch: Brent, WTI
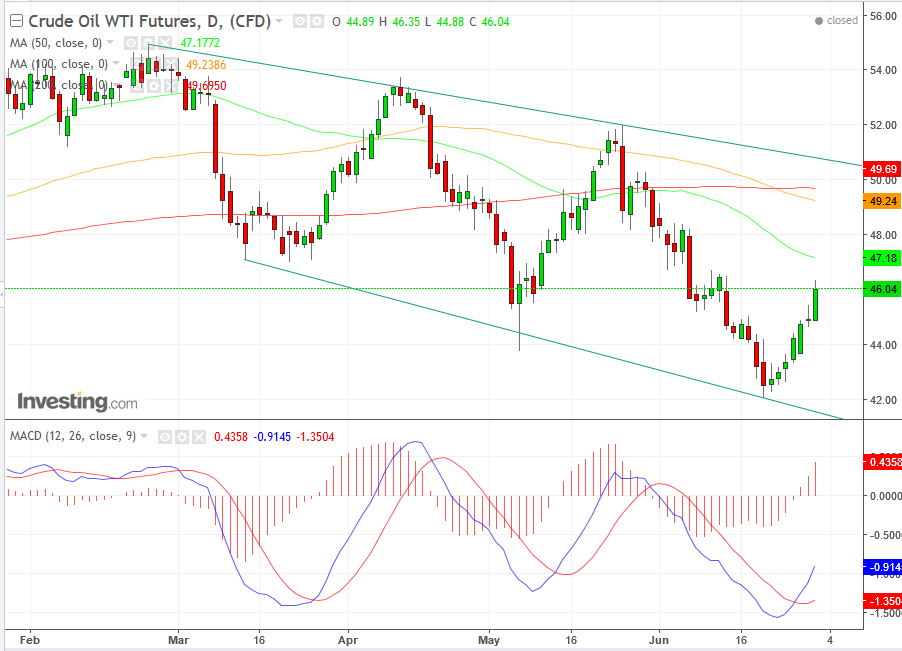
Oil investors have been subjected to a series of unfortunate events, starting with OPEC's disappointing cut extension, followed by record production from Nigeria and Libya—two cartel members who were exempt from the agreement. Add to that continuously rising US production which seems to have been the last straw. Traders panicked, pushing down the price 17.4% in a period of 23 days. Perhaps the selloff was too soon too far, because investors consider these prices a buying opportunity, as they have been pushing the price up for seven straight days. As mentioned above, it's been the longest run of gains in six months, since the end of 2016, when oil's price rose for 10 straight day, but only gained 3% as prices were higher at that time.
If previously any bad news was a trigger to sell, currently, any good news seems to have become a signal to buy. Upon receiving the bottom of the falling channel, oil had started a comeback, as investors' were taking advantage of bargain prices - again - in a panic. US shale explorers paused a record drilling expansion in a sign the boom may be slowing down, as two rigs were closed, bringing the current total rig count to 756, according to Baker Hughes. Before going on an oil buying-spree, the rig count has still more than doubled from a low of 316 in May.
Investors have now turned their attention to the Gulf crisis, which helps the price rise, on concerns of interrupted supply. While the price has been reaching its falling channel's top since February - which, at this angle, is at $49, the three primary moving averages are waiting, with the 50dma at $47.18. Also, the moving averages are in a bearish pattern, as the 50 is below 100, which just crossed recently below 200. The MACD, on the other hand, provided last week a buy signal, though it is a lagging indicator.
EARNINGS
Chase Corporation
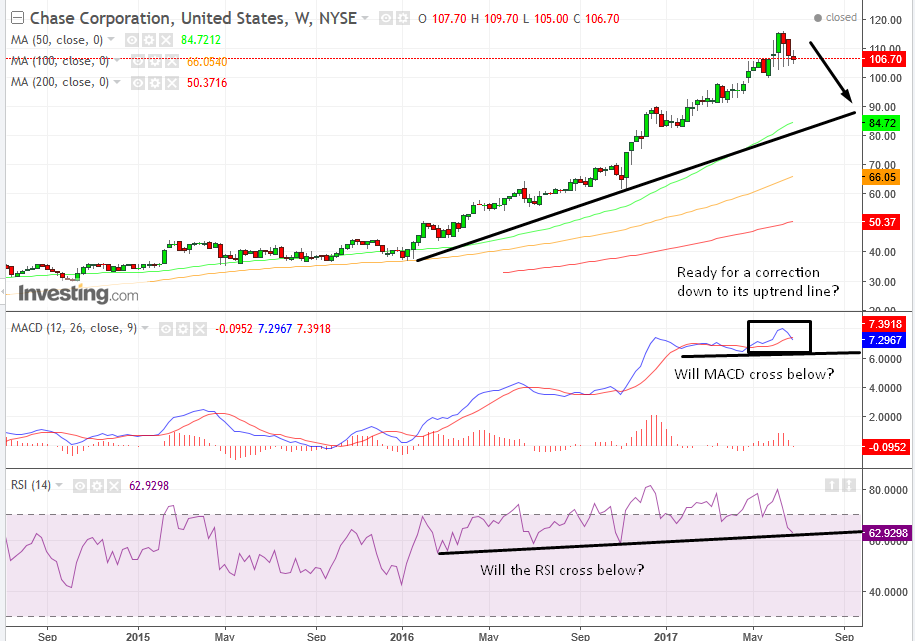
Chase Corporation (NYSE:CCF) is engaged in manufacturing of protective materials for reliability applications. The company has a market cap of $1.02 billion. Its operating divisions include industrial materials and construction materials segments. It has a P/E ratio of 27.07. The industrial materials division produces specified products that are used in, or integrated into, another company’s products. Demand is typically dependent upon general economic conditions.
The company is expected to report Q2 17 EPS of $0.00. Its stock has advanced since June 30, 2016 by 81-percent, outperforming the S&P 500 by 64.36 percent. While the stock is uptrending it has gotten far from its uptrend line. Will the RSI and MACD cross below, providing sell signals?
Friday
4:30: UK - Trade Balance (May) deficit forecast to narrow to £1.8 billion from £2.05 billion. Markets to watch: UK indices, GBP crosses
4:30: UK - Manufacturing Production (MoM) (May) expected to rise to 0.5% from 0.2%. Markets to watch: UK indices, GBP crosses
8:30: US - Employment Data (June) non-farm payrolls expected to see 183K jobs created from 138K a month earlier, while average hourly earnings expected to rise 0.3% from 0.2%; the unemployment rate is expected to remain at 4.3%. Markets to watch: US indices, USD crosses
8:30: Canada - Employment Data (June) forecast to see 19K jobs created, from 54K a month earlier, while the unemployment rate remains at 6.6%. Markets to watch: CAD and additional CAD crosses
10:00: Canada - Ivey PMI (June, seasonally adjusted) forecast to rise to 61 from 53.8. Market to watch: CAD crosses
