Wall Street indexes end holiday-shortened week with gains of around 2% each
U.S. oil futures decreased for a third day in a row to close the month with loss of 17.49% because of the pressure from high oil inventories in the United States and kept investors away from the risk due to the debt crises in the eurozone.
Second reading of the GDP for the first quarter export growth of U.S. economy by 1.9% as analysts predicted the same figure, as the current reading is less than the previous one that pointed to the growth rate of 2.2%.
The second reading of gross domestic product (GDP) measured for the first quarter economic growth by 1.7% which is higher than expected and better than the previous reading, which showed growth of 1.5%.
U.S. jobless claims for the 26th May issued 383 thousand applications where the current reading is higher than analysts' expectations, which indicated about 370 thousand applications. And higher than the previous which was issued by about 373 thousand request
European shares fall to their lowest level in 5 months when registered its worst monthly loss since August because of signs of a weaker growth rate in the United States and the continuing concerns of the debt of the eurozone.
FTSE 100 grew for 9.67 points, or 0.18% to close at 5306.95.
Germany's DAX30 got decreased for 16.42 points, or 0.26% to close at 6264.38.
French CAC 40 got increased for 1.43 points or 0.05% to close at 3017.01.
U.S. stocks got decreased yesterday as the S & P index's got the worst monthly performance since September because of the debt crisis in Europe.
The Dow Jones got decreased for 26.41 points, or 0.21% to close at 12393.45.
The Nasdaq got declined for 2.99 or 0.23% to close at 1310.32. While the decline in the S & P 500 SPX was 10.02 points, or 0.35% to close at 2827.34
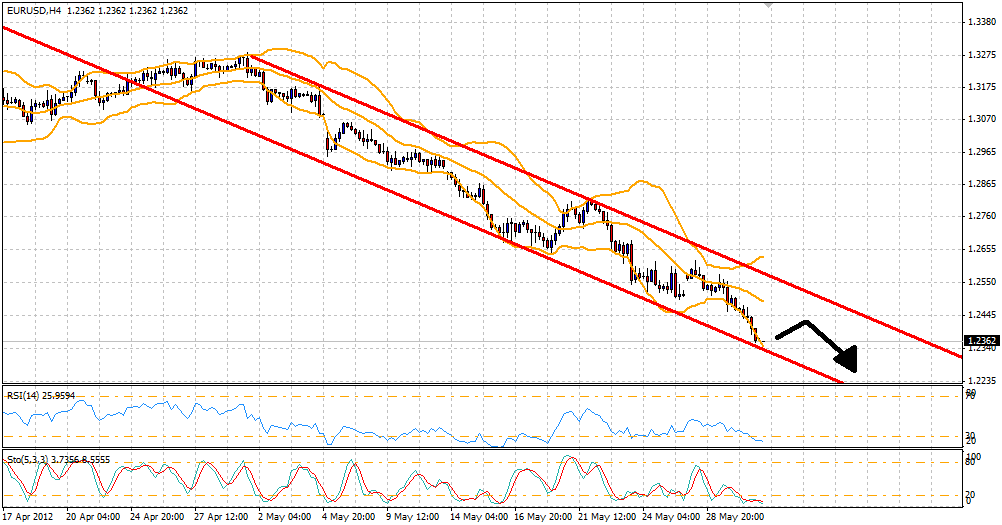
EUR/USD
EUR/USD found new resistance levels at 1.2440, if the price remains below the survival of these levels indicates downward trend.
In trading yesterday, The pair hit the highest level at 1.2427,while the lowest level at 1.2336, to finish the trading session at 1.2364.
 EUR/USD" title="EUR/USD" width="1002" height="525" />
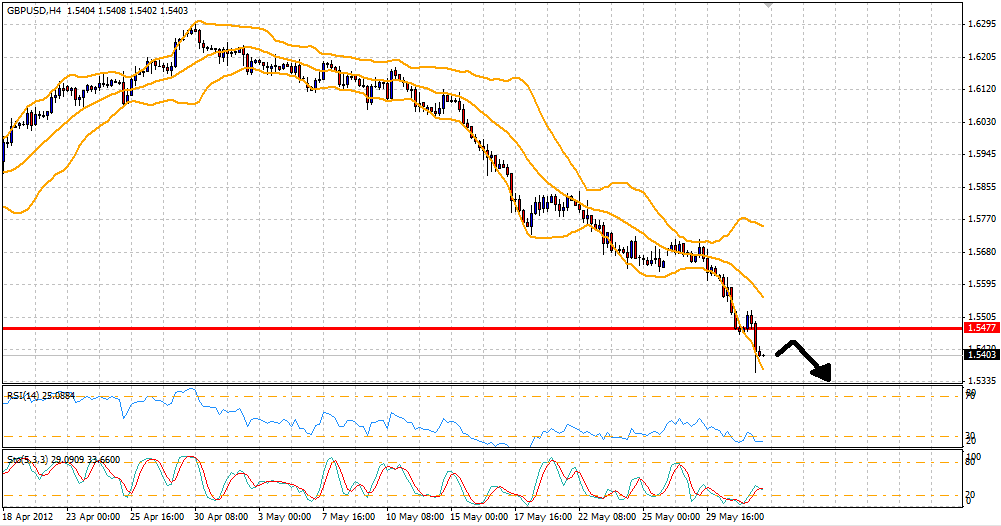
GBP/USD
GBP/USD found new resistance level at 1.5477, if the price remains below the survival of these levels indicates downward trend.
In trading yesterday, the pair reached its highest level at 1.5524 and the lowest level at 1.5359 dollars per pound sterling to close the trading session with a decrease of 71 points at 1.5403.
 GBP/USD" title="GBP/USD" width="1001" height="526" />
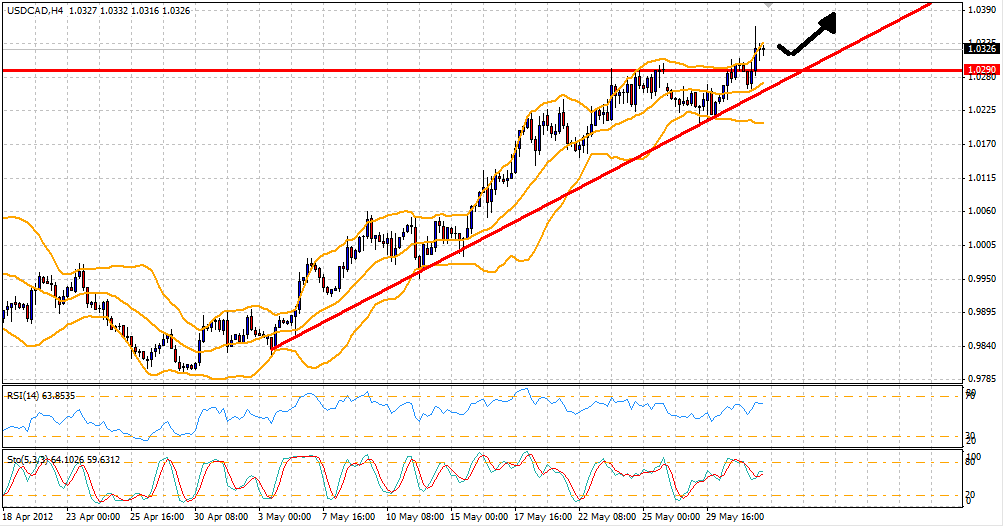
USD/CAD
USD/CAD found new support levels at 1.0290, if price remains above these levels indicates upward trend.
In trading yesterday, the pair reached the highest level at 1.0364, while the lowest level at 1.0260 to finish the trading session with an increase of 27 points at 1.0326.
 USD/CAD" title="USD/CAD" width="1003" height="526" />
WTI
Oil found new support levels at 88.25, if the price is below the survival of these levels indicates downward trend.
U.S. crude futures fell light in the New York Mercantile Exchange (NYMEX) for 0.98$ per barrel to close at 86.48, having fallen from a peak of 88.24 dollars per barrel touching its lowest level at 85.84 dollars per barrel.

Second reading of the GDP for the first quarter export growth of U.S. economy by 1.9% as analysts predicted the same figure, as the current reading is less than the previous one that pointed to the growth rate of 2.2%.
The second reading of gross domestic product (GDP) measured for the first quarter economic growth by 1.7% which is higher than expected and better than the previous reading, which showed growth of 1.5%.
U.S. jobless claims for the 26th May issued 383 thousand applications where the current reading is higher than analysts' expectations, which indicated about 370 thousand applications. And higher than the previous which was issued by about 373 thousand request
European shares fall to their lowest level in 5 months when registered its worst monthly loss since August because of signs of a weaker growth rate in the United States and the continuing concerns of the debt of the eurozone.
FTSE 100 grew for 9.67 points, or 0.18% to close at 5306.95.
Germany's DAX30 got decreased for 16.42 points, or 0.26% to close at 6264.38.
French CAC 40 got increased for 1.43 points or 0.05% to close at 3017.01.
U.S. stocks got decreased yesterday as the S & P index's got the worst monthly performance since September because of the debt crisis in Europe.
The Dow Jones got decreased for 26.41 points, or 0.21% to close at 12393.45.
The Nasdaq got declined for 2.99 or 0.23% to close at 1310.32. While the decline in the S & P 500 SPX was 10.02 points, or 0.35% to close at 2827.34
EUR/USD
EUR/USD found new resistance levels at 1.2440, if the price remains below the survival of these levels indicates downward trend.
In trading yesterday, The pair hit the highest level at 1.2427,while the lowest level at 1.2336, to finish the trading session at 1.2364.
EUR/USD" title="EUR/USD" width="1002" height="525" />GBP/USD
GBP/USD found new resistance level at 1.5477, if the price remains below the survival of these levels indicates downward trend.
In trading yesterday, the pair reached its highest level at 1.5524 and the lowest level at 1.5359 dollars per pound sterling to close the trading session with a decrease of 71 points at 1.5403.
GBP/USD" title="GBP/USD" width="1001" height="526" />USD/CAD
USD/CAD found new support levels at 1.0290, if price remains above these levels indicates upward trend.
In trading yesterday, the pair reached the highest level at 1.0364, while the lowest level at 1.0260 to finish the trading session with an increase of 27 points at 1.0326.
USD/CAD" title="USD/CAD" width="1003" height="526" />WTI
Oil found new support levels at 88.25, if the price is below the survival of these levels indicates downward trend.
U.S. crude futures fell light in the New York Mercantile Exchange (NYMEX) for 0.98$ per barrel to close at 86.48, having fallen from a peak of 88.24 dollars per barrel touching its lowest level at 85.84 dollars per barrel.