Bitcoin price today: rises to $91.5k as Fed cut bets remain firm
Some more interesting moves in the markets last week. Can you recall a time when the market was nearing new highs while REITs, Staples, Health Care and Utilities all outperformed? Meanwhile Energy, Industrials and Financials underperformed. US junk bonds and high grade credit risks are outperforming at the same time that emerging market currencies and lumber prices are jumping off of the high dive. Japanese bond yields continue to rise as the Bank of Japan gets comfortable with higher rates. US economic data remains better than the rest of the world’s economies, which is buoying the Dollar. And inflation datapoints and guidance will continue to push the Fed to raise rates several more times. Maybe now is a good time to talk about the $700-800 billion that the US Government needs to borrow in the last 6 months of 2018. This amount is 50% greater than what was borrowed a year ago. This money will need to come from somewhere and given the current global trade rhetoric, I am guessing that more of it will need to be financed by US sources. This means that other bonds, stocks, real estate, etc. will need to be sold to buy Treasuries. Investors will be watching closely to see what is sold while at the same time the US Treasury will be watching to see what yields it will take to move all of the inventory.
So strong economic data, earnings, and inflation. Are we moving into the later innings of this economic cycle ballgame? If so, it makes perfect sense why investors are beginning to rotate into more defensive names and sectors. Definitely easier to own consumer staple products stocks when they are raising prices 4-6%. Just keep those diaper factories running at 100% and make sure those truck drivers show up to get it to market.
Some great earnings numbers last week. Above average stock price movements tell you that the analysts are having a tough time nailing down the estimates. Just too many moving parts on the cost side of the equation. And now the revenue guesstimate game will get very difficult if entire geographies pause their orders for global trade reasons. Okay, let’s look at some of the more interesting items from last week…
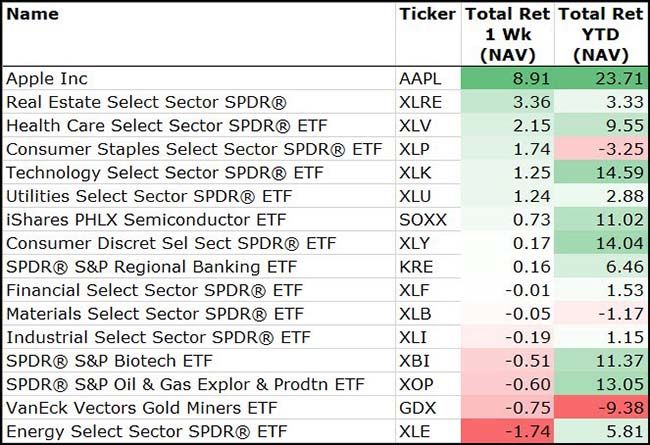
Look at what is leading the market higher right now…
If you are a Growth or High Beta stock investor, you might want to be sitting down right now. It doesn’t get much more Defensive then REITs, Healthcare and Consumer Staples. Take a closer look at the charts of some of the big cap pharma stocks. Maybe now you know where that Facebook (NASDAQ:FB) money has gone to.
Proof that Apple (NASDAQ:AAPL), Inc. is a Defensive stock?
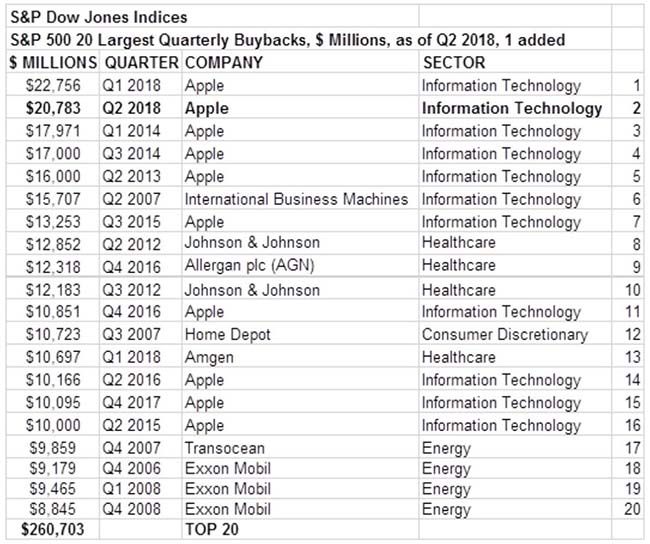
Apartments, drug prescriptions, toilet paper and the iPhone X…clearly you missed the memo. Seriously Apple, nice numbers and excellent stock repurchases.
Speaking of Apple’s repo…
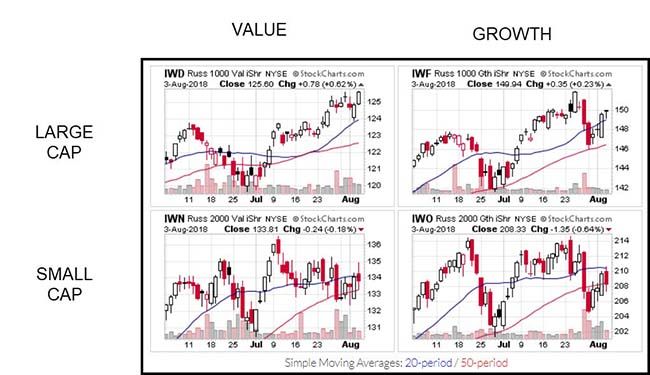
So looking at the charts, I see Large Cap Value breaking out…
But interestingly, no clear leader in Small Cap among Growth or Value. Seems like Small Value should also follow but we will have to keep watching this race.
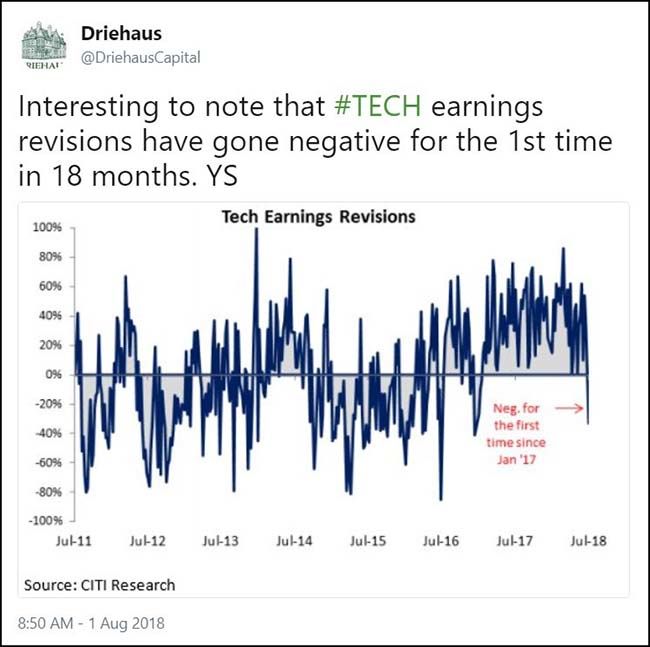
Maybe time for Technology stocks to take a backseat if their earnings revisions are now declining?
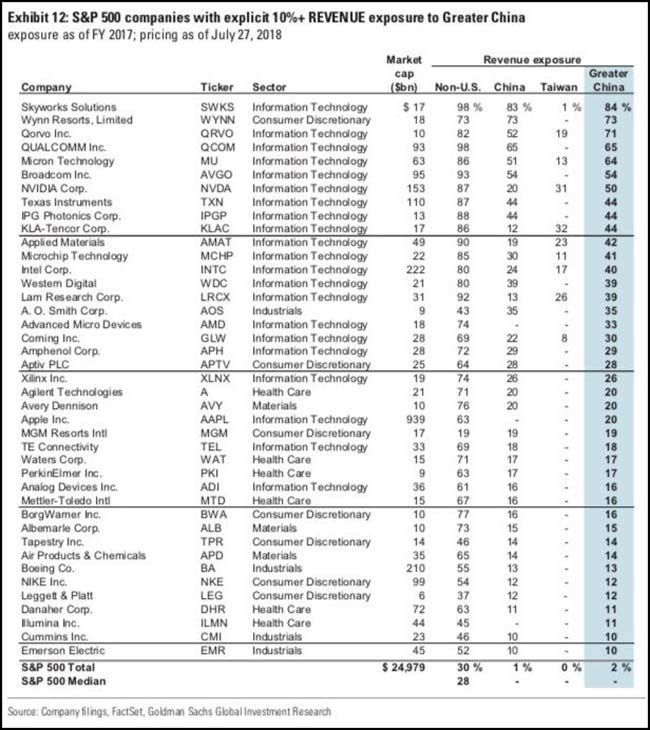
Earnings could get more challenging for the Tech sector if the trade war with China continues…
@sallyshin: S&P 500 companies with exposure to China from @GoldmanSachs
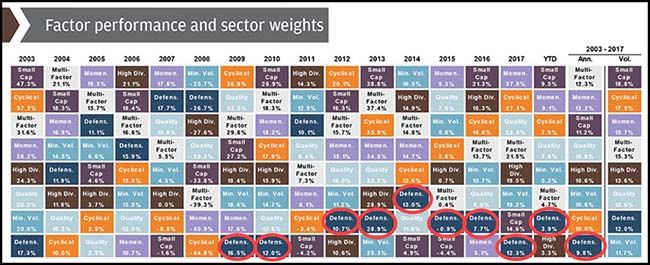
The Defensive Factor is the Cleveland Browns of equity styles…
Near the worst performing factor in 10 of the 11 past years. Reversion to the mean cannot be completely dead, right? Who wants to bet that the Defensive factor can again return to greatness before the Browns make the playoffs?
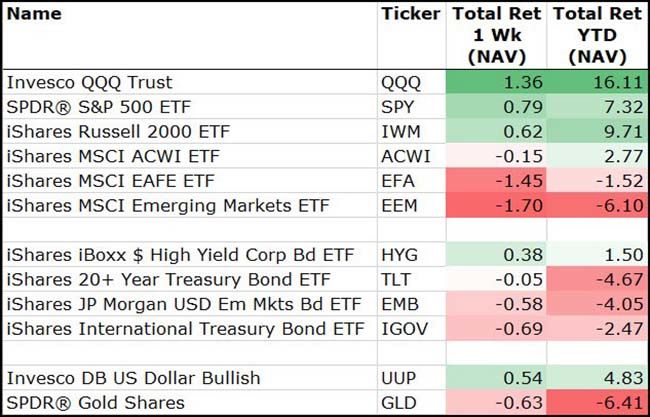
Looking more broadly at the asset classes last week showed Apple and Amazon’s help to the Nasdaq…
Really it was a US Dollar driven market with the International exposures in the red as the Dollar gained a half a percent.
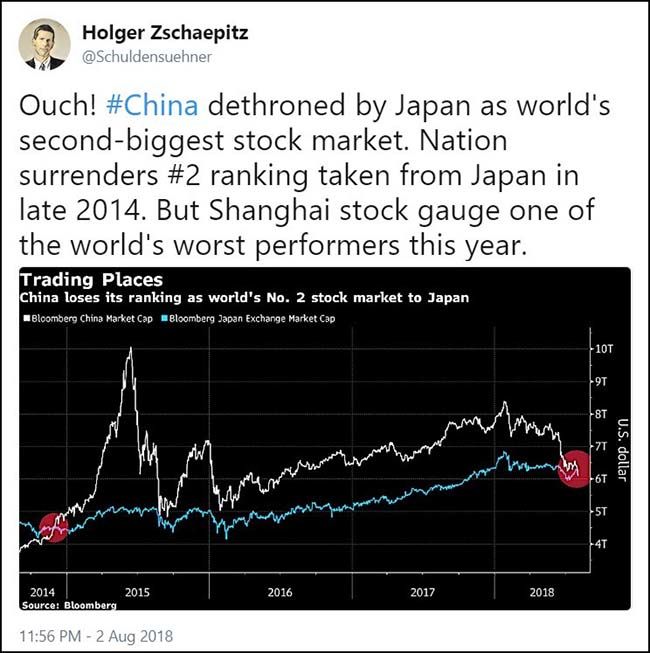
Looking overseas, Japan passed China to retake the #2 slot…
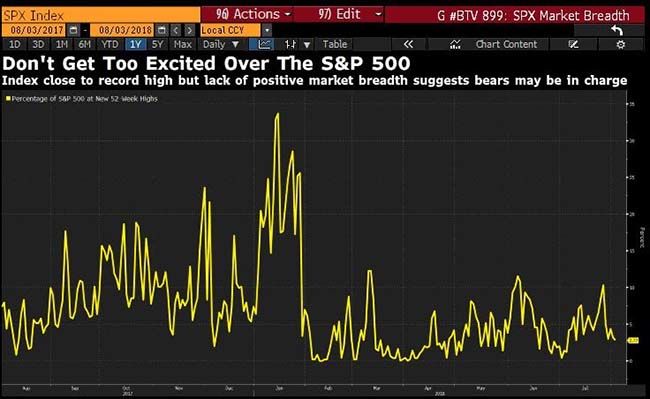
One effect of the Defensive rotation is that fewer stocks are making new highs…
@DavidInglesTV: For those out there who are getting overly excited over the S&P 500, this one’s for you. Less than 3% of the index is at a new 52-week high.
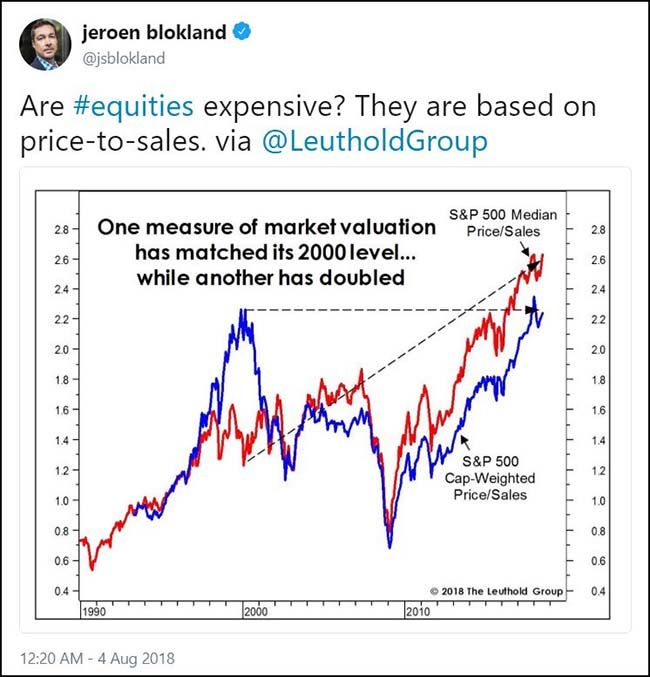
A price-to-sales chart to consider…
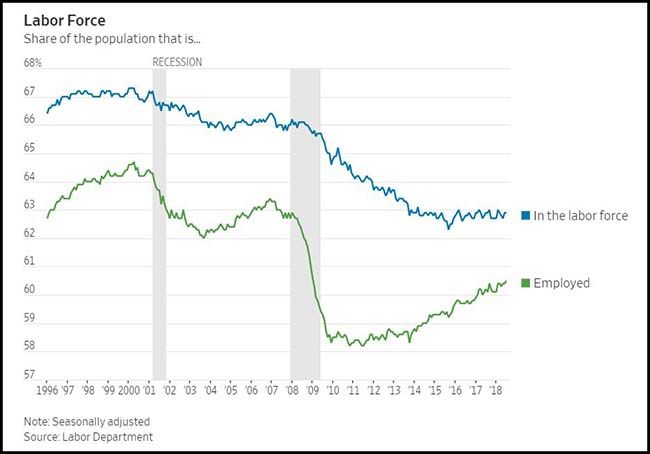
Friday gave us jobs data…
What a great chart this is. Less than 2.5% of Americans are without a job.
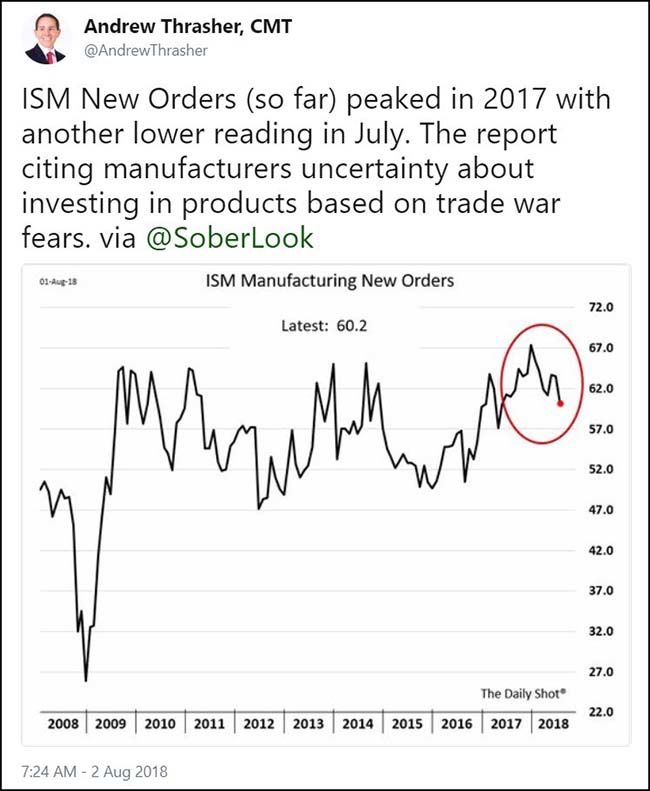
Could the trade wars now be impacting the ISM Manufacturing data?
Several important inflation notes in the ISM Manufacturing Survey detail…
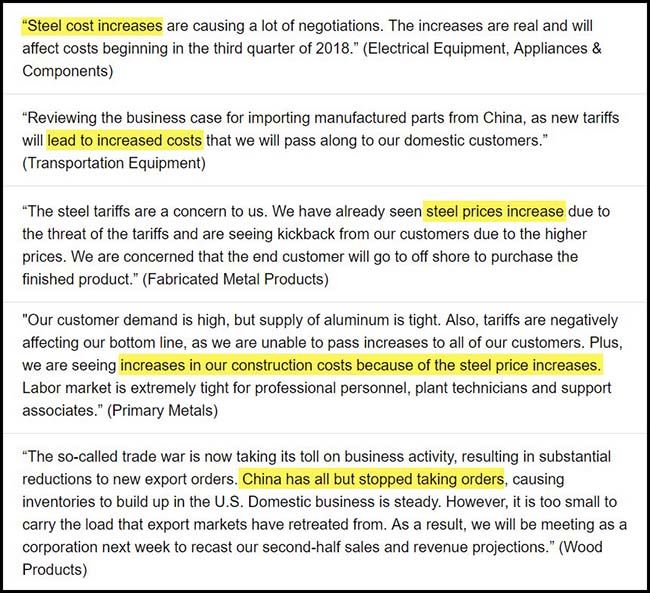
(ISM)
Plenty of inflationary news on the tape from companies raising prices….
Effective September 4, 2018, or as contracts allow, H.B. Fuller North America will implement price increases for all polymer and water-based adhesives product categories. Increases will be between 7 percent and 12 percent. These increases will affect products in the company’s packaging, durable assembly, construction and paper converting segments.- The past 12 months have seen continued increases in raw material feedstock, logistic and labor costs. Raw material inflationary pressure exists globally due to tight supply in a robust demand environment. In North America, the added impact of truck shortages and low unemployment also is affecting costs.
(TradeTheNews.com)
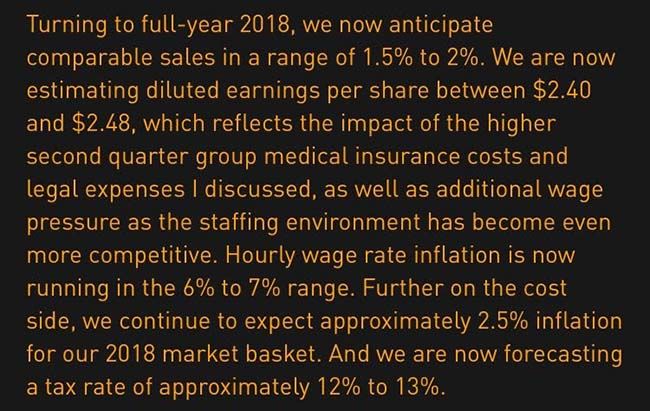
And more strong inflation data in the earnings releases…
@conorsen: Cheesecake Factory’s now seeing wage growth of 6-7%, up from almost 6% last quarter. $CAKE
And of course Procter & Gamble's PG big news last week which helped the Consumer Staples stocks…
P&G, the purveyor of Charmin toilet paper, Bounty towels and Puffs tissues, said on Tuesday that it had recently begun notifying retailers of a 5-percent average price increase on all three brands. The company said it had also started rolling out an average 4-percent price increase on Pampers diapers in North America…
The price of hardwood pulp, an ingredient in tissues and toilet paper, has surged by about 60 percent since late 2016, according to the Pulp and Paper Products Council, which tracks prices based on global customs data. The price of softwood pulp, used in diapers and sanitary pads, jumped by 21 percent during that period.
(Reuters)
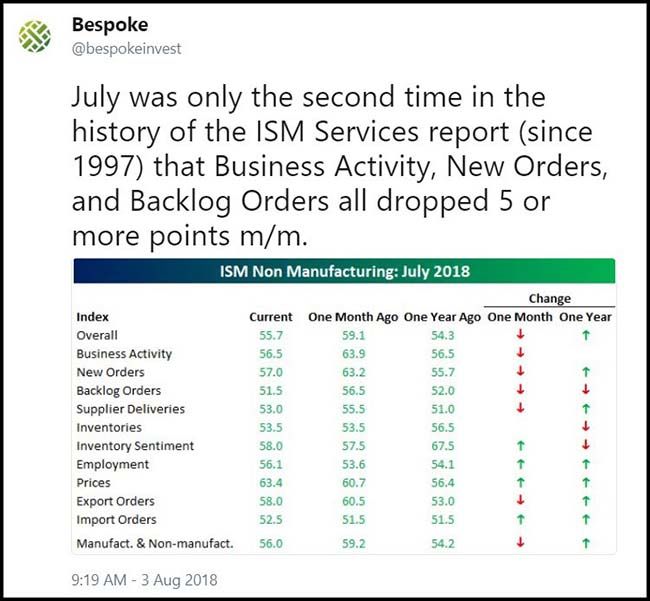
ISM Services survey also showed some weakness…
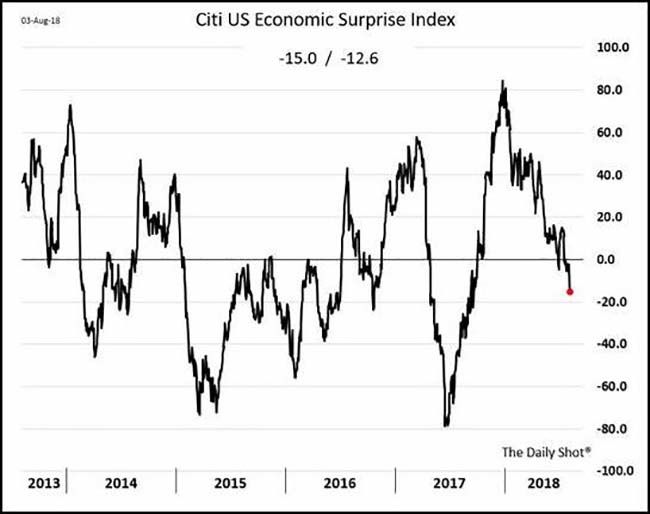
Citi’s US Economic Surprise Index usually has a summer bounce. But not this year…
(WSJ/DailyShot)
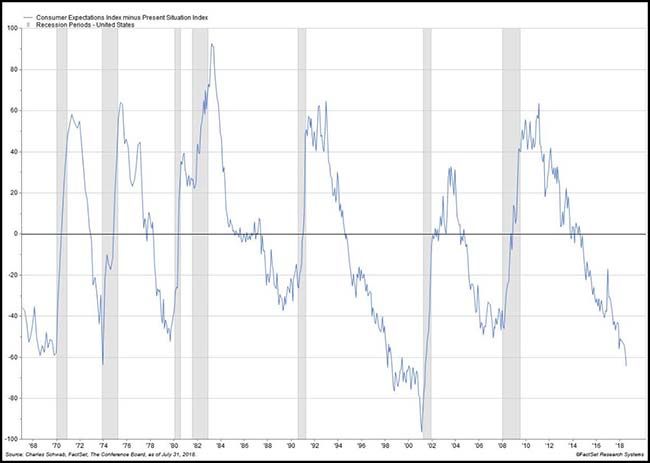
Consumer Sentiment surveys show more interest in the Now than in the Future…
If anyone could perfectly forecast the next 12 months for me, I would be most grateful.
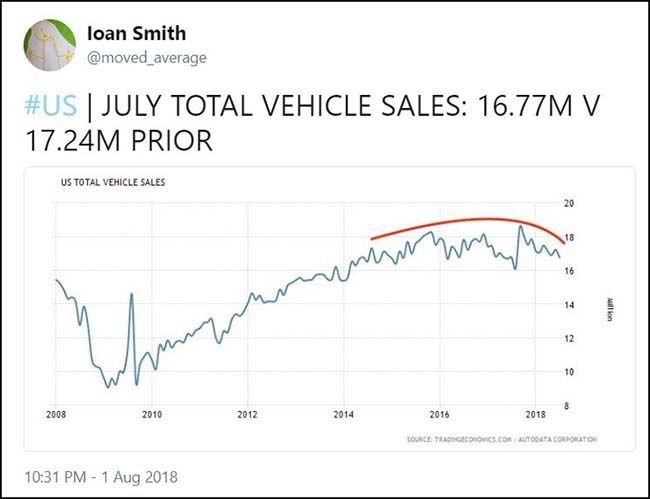
If consumers are living in the Now, then they must be too busy driving their cars than buying new cars…
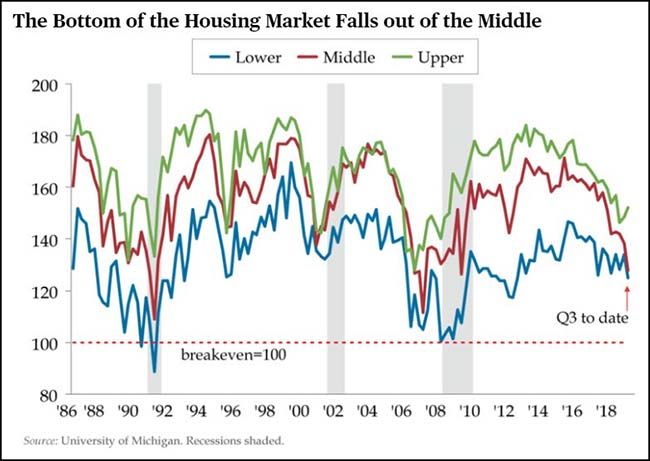
As for houses, affordability is beginning to really bite the middle segment of the US housing market…
Expectations were approaching ebullience heading into this spring’s US home-selling season. The National Association of Realtors entered the year expecting home sales to grow by 3.7 percent in 2018 after last year’s lackluster 1.1 percent increase. But now, the NAR’s chief economist has tempered his call with existing homes changing hands at the slowest pace since September and new home sales having fallen to the lowest level since October 2017…
There are other factors that have hamstrung the housing market in 2018 besides record-high home prices. Mortgage rates for 30-year fixed loans are up by more than 0.8 percentage point on average. Separately, the new tax law limits all state and local income taxes and property taxes that can be deducted to $10,000.
Affordability is even more elusive among middle-tier income earners, who tend to be in the market for move-up homes after they’ve outgrown their starter home. And that’s in second-tier markets. In the nation’s costliest cities, median home prices often exceed the wherewithal of most regardless of how much they make. In San Francisco, average home prices exceed $1.6 million.
Housing data is even slowing in the top tier markets…
Home sales have slowed down this year in the Hamptons, the Long Island beach communities that serve as a summer playground for the wealthy of New York, bringing the median price below the $1m mark.
Second-quarter sales fell 12.8 per cent from 2017 levels, according to data prepared for Douglas Elliman by Miller Samuel Real Estate. The median price dropped 5.3 per cent to a $975,000, compared with $1.03m a year earlier.
The spring selling season is usually the high point of the year in the Hamptons, so the drop is stoking concerns that the resort areas of Long Island’s south shore are succumbing to the pressures depressing property activity in other parts of the US.
Rising mortgage rates are increasing costs for homebuyers of all stripes. Higher-end properties have been affected by the 2016 federal tax reform, which imposed new limits on the deductions of mortgage interest and state taxes — the latter a particular concern in high-tax New York.
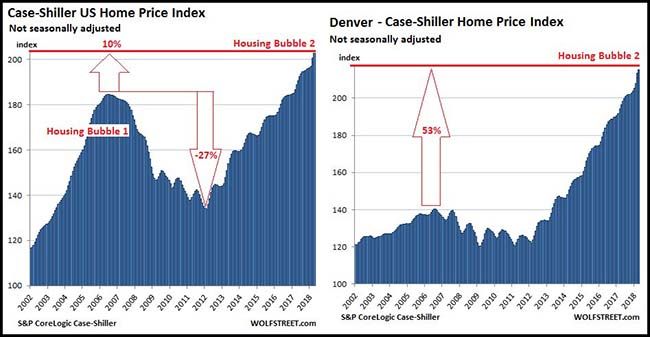
New price data shows the average US home now 10% above the last bubble…
And for all of my Denver readers who have never experienced a housing bear market, you are up 53%.
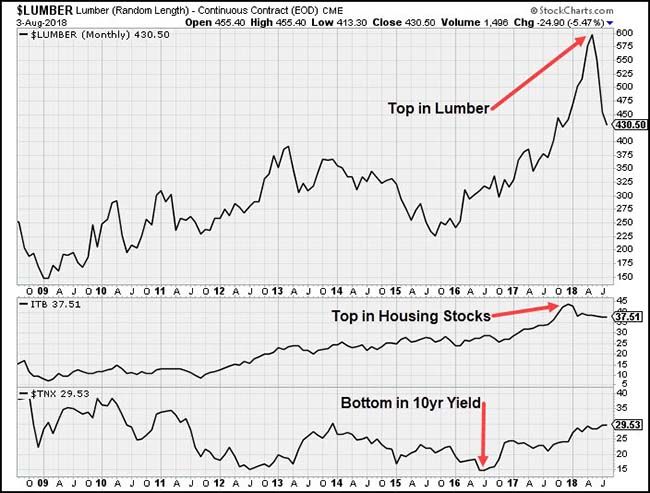
Lumber prices have corrected nearly 30%…
As you might expect, the bottom in treasury yields (and thus mortgage yields) came first. Then housing stocks reacted second.
The tariffs are still hurting many US businesses…
After the US placed tariffs on European steel and aluminum in June, Europe hit back with a tax that, among other things, made American kidney beans 25% more expensive in Europe.
Now, Cindy Brown is running out of room to store the beans. One-ton bags of them cover the floors in her cavernous warehouses. Smaller sacks are piled on wood-pallet shelves. Kidney beans fill tall steel bins that dot the grounds.
Chippewa Valley Bean Co. had been on track to ship to Europe 60% of its beans traded internationally this year, worth $25 million. Now, “we’re just sitting on our hands,” said Ms. Brown, president of the family company.
The Fed didn’t hike at last week’s meeting, but Tim Duy sees at least two and probably three hikes on the horizon…
The US economy performed about as well as might be expected in the first half of 2018, growing at an average pace of 3.15% in a “new normal” world where the longer-term speed limit might be just 1.8%. Indeed, in an otherwise fairly unchanged statement, the Fed hailed the results as a “strong” pace of growth at the conclusion of this week’s FOMC meeting, an upgrade from last meeting’s “solid.”
But that is all in the rear view mirror now. As we all plunge deeper into the second half of 2018, the focus is on a potential slowdown in the wake of trade wars, higher labor and material prices, a moderation in the housing market, and the lagged impact of rate hikes. Will those factors be sufficient to give the Fed room to pause as central bankers approach their estimates of the neutral policy rate? At this juncture, it still looks likely that the Fed delivers rate hikes in September and December and probably into March of next year before they will entertain the notion of an extended pause. Their willingness to entertain that notion, however, will of course be data dependent.


