Sven Henrich of NorthmanTrader is warning, “How can I not talk about the Fed? How can I not talk about the daily jawboning? It is all around us. Every. Single. Day.
And it keeps working.
I feel like I’m being reduced to a loon conspiracy theorist documenting the very reality of it. But I’m not. From my perch I’m doing a public service doing it, because the background motivation for why it is being done reveals a deeper and disturbing truth: They are scared, they are worried and they are desperate to keep the balls in the air.
In my view, it’s disingenuous to not acknowledge the real impact central banks have on markets and assess the risk implications.
Yesterday the Fed went full circus. It was stunning to watch and I suspect they made a couple of mistakes by revealing things they shouldn’t have.
Not a surprise Bullard wants to see cuts, but it was Clarida and Williams who dropped the bombs. Wait for bad data? Nah, just cut preemptively. A full abandonment of the ‘data dependency’ charade. To ‘influence markets’. Stated straight up for all to see. They are no longer even pretending.
And a stunning admission from Williams: “When you only have so much stimulus at your disposal, it pays to act quickly to lower rates at the first sign of economic distress.”
Now, that should instill faith in the Fed.
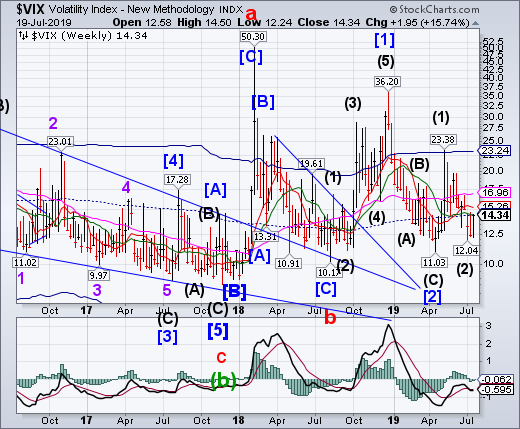
VIX rallied to challenge Intermediate-term resistance and mid-Cycle resistance at 14.40-14.46, closing beneath them. A Master Cycle low was made on July 5, indicting a potential change of trend. A breakout above mid-Cycle/resistance may provide an initial buy signal.
(DailyFX) Volatility could be on its way to a market near you judging by the recent jump in the VIX Index. The VIX Index, which is Cboe’s measure of expected 30-day volatility on the US stock market, now trades above 14.0 and threatens to reverse the post-G20 summit collapse in volatility we highlighted earlier this month. This move to the upside in volatility could indicate turbulence ahead for risk assets like stocks and oil as market uncertainty resurfaces.
Trendline resistance holds, SPX reverses
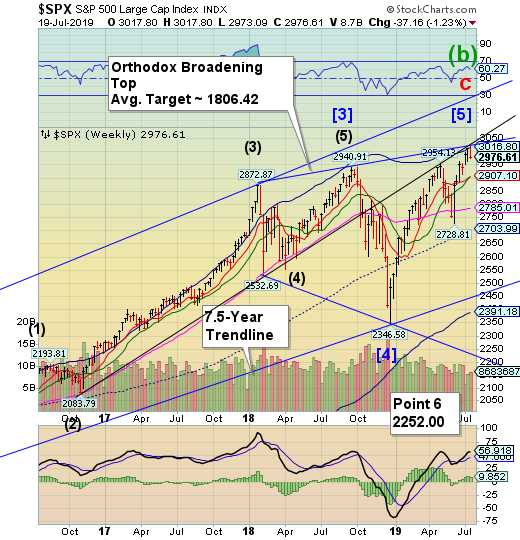
SPX made a new all-time high on Monday at 3017.80 while hitting both the lower Ending Diagonal trendline and the upper Orthodox Broadening Top trendline at their intersection. Few analysts are familiar with trendline support and resistance, but the evidence of double trendline support is there for all to see on December 26, 2018. A new sell signal may be had at a decline beneath Short-term support at 2907.10. “Point 6” remains beneath the December 26 low.
(Bloomberg) U.S. stocks extended weekly losses amid mounting tension in the Persian Gulf and as investors speculated the Federal Reserve will limit a rate cut to a quarter-point. Treasury yields spiked and the dollar rose.
The S&P 500 Index erased gains after reports that Iran’s Revolutionary Guard Corps seized a British oil tanker in the Strait of Hormuz amid soaring tensions in one of the world’s critical energy chokepoints. President Donald Trump said he’ll be “working with the U.K.”
NDX rebuffed at Cycle Top resistance
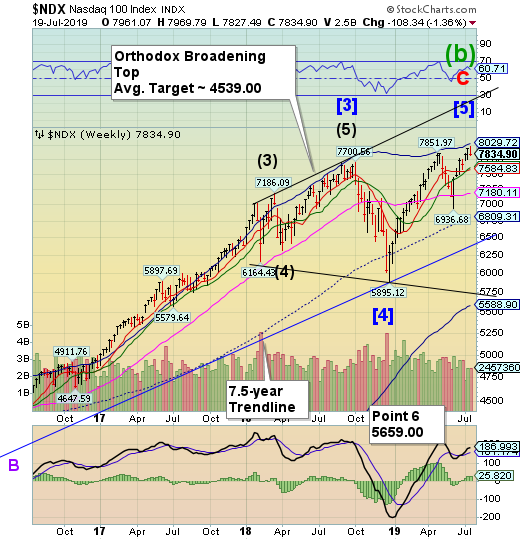
NDX made a new all-time high on Monday as it approached its Cycle Top resistance at 8029.72. The called for Master Cycle reversal arrived on time. The combination of price and time proved to be enough without a catalyst, although Netflix (NASDAQ:NFLX) weighed in later in the week. The FAANGS are losing letters.
(ZeroHedge) Netflix shook markets. It was a “Wake up smell the coffee moment. It’s amazing how folk have woken up to the reality: Netflix is struggling. FANG becomes FAG. Which means Netflix’s days as a market disrupter are over.
It pioneered streaming as a business, but now is facing competitive pressures it can’t hope to beat with its current model. Its high content spending to capture subscribers appeared to be working in a competition free environment, but today’s reality is subscribers have choice where to go for quality content. Netflix’s library of classics are going back to their owners, and even they admit their current production wasn’t good enough to attract new customers. Which means they have a problem going to the market for more money to spend on more content to attract customers – who ae going elsewhere.
High Yield Bond Index stalls
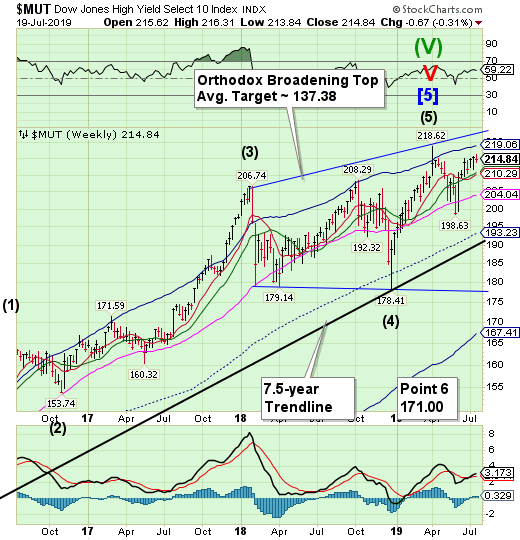
The High Yield Bond Index stalled this week without making a new all-time high. A decline beneath Intermediate-term support at 210.71 may give a sell signal. The Cycles Model warns the next step down maybe a large one.
(MishTalk) The widely discussed “everything bubble” is, in reality, a corporate junk bond bubble on steroids sponsored by the Fed.
The highest grade AAA corporate bonds yield 2.75%. BBB-rated corporate bonds, just one step above junk, 3.5%. BB-rated bonds yield just 4.28%.
The spread between Prime AAA bonds and lower-medium grade bonds (see chart below) is just 0.77 percentage points.
Treasuries bounce at Short-term support
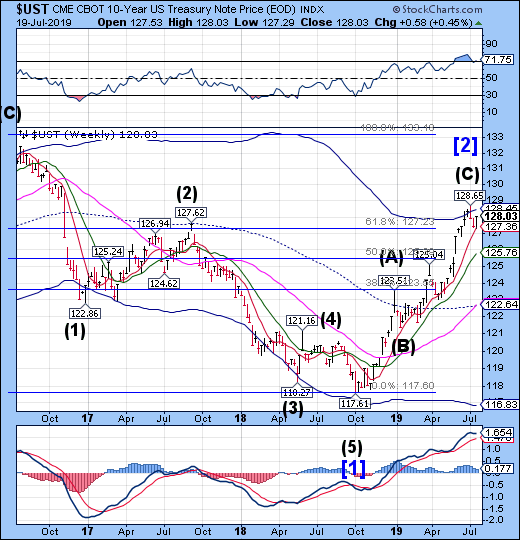
The 10-year Treasury Note Index declined to Short-term support at 127.36, where it bounced. The Cycles Model suggests that the energy in this bounce may come to an end early next week. Its ultimate direction lies in whether it can break out above the July 3 high or not.
(CNBC) U.S. government debt yields rose on Friday but notched weekly declines as fixed-income traders snapped up bonds in anticipation of a Federal Reserve rate cut later this month.
That belief that reinforced Thursday, when New York Fed President John Williams (NYSE:WMB) encouraged preemptive action from central banks when signs economic deceleration start to appear.
At around 4:02 p.m. ET, the yield on the benchmark 10-year Treasury note, which moves inversely to price, was higher at around 2.05%, while the yield on the 30-year Treasury bond was also higher at around 2.578%.
The euro consolidates beneath support
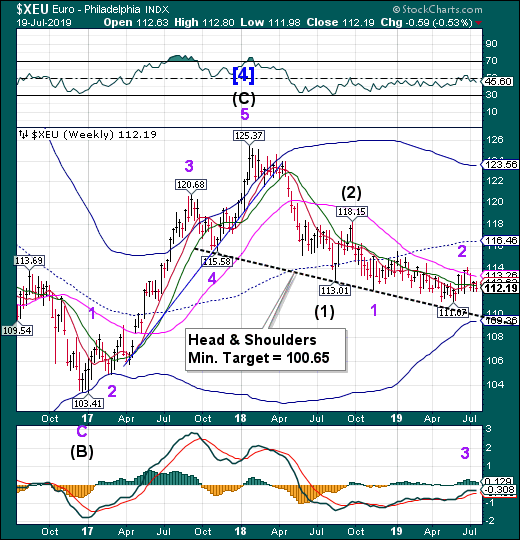
The euro traded within the prior weeks’ range, but closed beneath Long-term support at 112.23. This action produced a sell signal. The Cycles Model suggests a further decline through the end of the month.
(DailyFX) Earlier this month, we highlighted how EUR/USD implied volatility dropped to multi-year lows. Euro implied volatility is showing signs of turning higher, however, as key event risk surrounding pivots in European Central Bank (ECB) and Federal Reserve (Fed) monetary policy begins to unfold.
According to overnight swaps pricing, it is more likely than not that the dovish turn in outlook by the ECB will be confirmed next week with the central bank teed up to cut its policy interest rate by 10 basis points. Although, if the ECB does act to ease monetary policy, it will likely spark Euro currency volatility seeing that the probability of an ECB rate cut at its July 25 meeting is near-split at 51.2% in favor of a cut with the remaining 48.8% priced for a hold.
EuroStoxx in decline
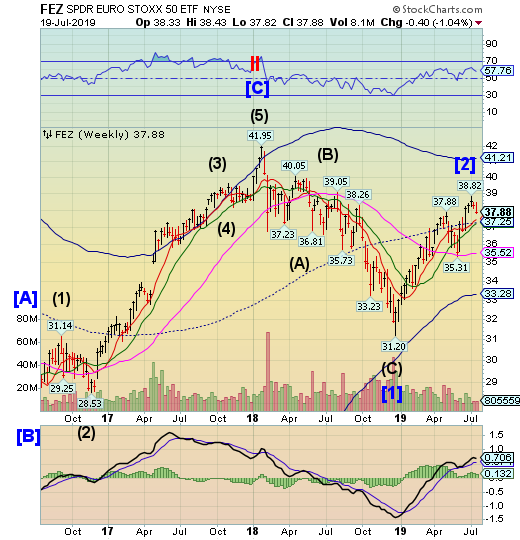
Note: StockCharts.com is not displaying the Euro Stoxx 50 Index at this time.
The EuroStoxx 50 SPDR declined but remains above critical support at 37.25. The sell signal may be triggered beneath the mid-Cycle support, also at that level. The Cycles Model suggests a probable 2 month decline may lie ahead.
(CNBC) European stocks were little changed on Friday as market players awaited news on whether the U.S. Federal Reserve will cut interest rates this month.
The pan-European Stoxx 600 hovered around the flatline during afternoon trade and ended the session up provisionally 0.1% higher with sectors and major bourses pointing in opposite directions. Basic Resources were the strongest performers with a 1.1% climb, while bank stocks were 0.9% lower as Italian banks declined amid tension between the two parties of the nation’s coalition government.
Markets were initially buoyed by comments from a top Fed official on Thursday that suggested the central bank would implement a pre-emptive “insurance” rate cut aimed at averting a major slump in economic growth.
The yen consolidates above support
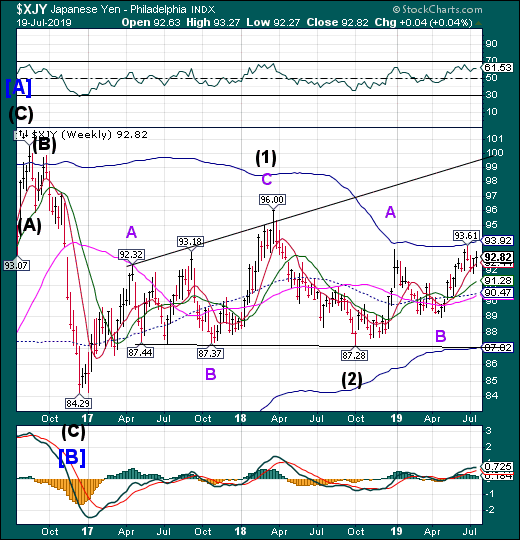
The yen found a foothold at Short-term support at 92.44. It appears to be on a buy signal. The Cycles Model suggests that strength may continue for the next 2-3 weeks. A breakout may propel the Yen to the upper Broadening trendline.
(Bloomberg) The barriers preventing the yen from reaching 100 per dollar, a target that has proved elusive for the past two years, are dropping one by one.
An escalation of the U.S.-China trade war took the haven asset through 110 in mid May. Next to go was resistance at 108.50, which crumbled late last month when President Donald Trump threatened to put a 5% duty on Mexican imports. The threshold of 105 now looks vulnerable as U.S.-Iran tensions worsen and investors await a planned meeting between Trump and Chinese counterpart Xi Jinping at this week’s Group-of-20 summit.
“What’s come out fresh over the past week as a catalyst to push dollar-yen toward 100 is the geopolitical risk over Iran,” said Daisuke Karakama, chief market economist at Mizuho Bank Ltd. in Tokyo. “If war breaks out in the worst case, that would typically push the dollar lower.”
Nikkei makes a very strange round trip
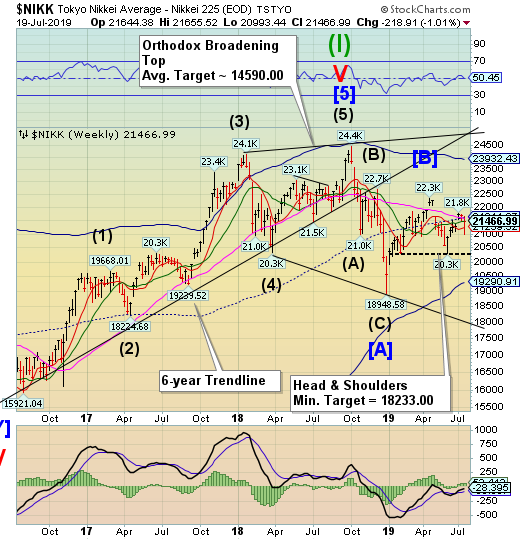
The Nikkei Index declined nearly 3% past all supports until Thursday to 20993.44, completing a probable Master Cycle low. Then it rallied back by over 2% on Friday, closing above Intermediate-term support/resistance at 21454.08. Usually, a 2-3 week rally follows a Master Cycle low. However, the depth of the breakdown and rapidity of the rebound may suggest something different may be at hand..
(Investing.com) – Japan stocks were higher after the close on Friday, as gains in the Paper & Pulp, Railway & Bus and Real Estate sectors led shares higher.
At the close in Tokyo, the Nikkei 225 gained 2.00%.
“On average, Japanese share valuations are fairly cheap, but when you are stock-picking, many of the shares you would like are already quite expensive,” said Hiroyuki Ueno, senior strategist at Sumitomo Mitsui Trust Asset Management.
U.S. Dollar consolidates above Long-term support
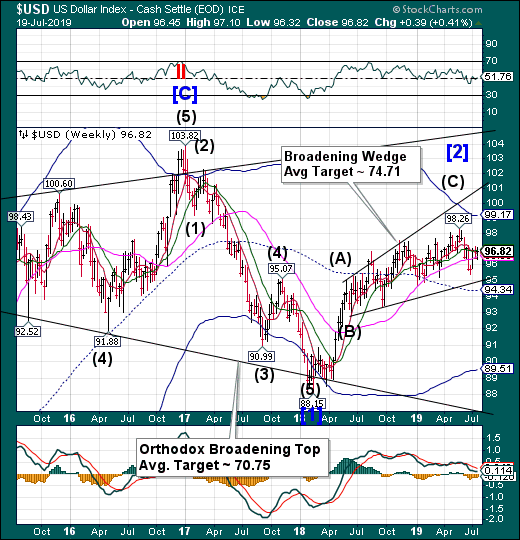
USD decline to challenge Long-term support at 96.50 on Thursday but quickly bounced back above Short-term support/resistance at 96.53. The USD remains on a potential sell signal. Indications show that the decline may resume through the end of the month.
(Reuters) – President Donald Trump wants a cheaper dollar, saying earlier this month the United States should match what he says are efforts by other countries to weaken their own currencies – giving them an unfair trade advantage.
The comments have prompted speculation the president could order sales of the greenback, which is near a multi-decade high and, according to the International Monetary Fund on Wednesday, at least 6% stronger than warranted by economic fundamentals.
“Conditions seem increasingly favorable for the U.S. administration to intervene against perceived (dollar) overvaluation,” Citi economists said in a note Wednesday.
Gold breaks out
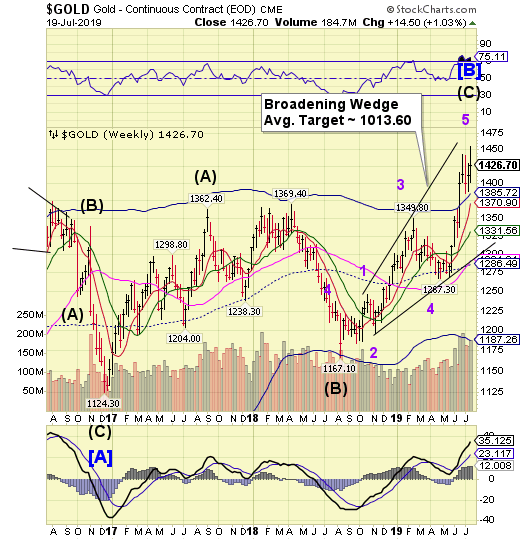
Gold broke out to a new high this week. The breakout suggests a possible 2-3 week extension that may take gold as high as 1500.00. However, a breakdown beneath Cycle Top support at 1386.72 may produce a sell signal.
(CNBC) Gold fell about 1% on Friday as the dollar firmed and investors took profits after prices briefly surpassed $1,450 to hit a six-year peak on dovish signals from the U.S. Federal Reserve and is still on course for a second week of gains.
Spot gold was down about 1.65% at $1,422.2, having touched its highest since early May 2013 at $1,452.60.
Prices have risen about 3% in the last two days and by about 1.2% so far this week, on increased expectations for an interest rate hike by the Fed at its month-end meeting.
U.S. gold futures fell by 0.32% to $1,423.5.
Crude declines through all support
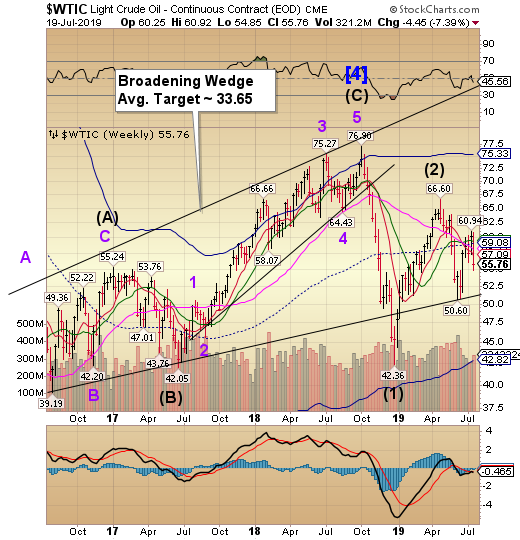
While there was a surge in price early this week, Crude closed consistently lower each day. The July 11 high at 60.94 remains the secondary high. The Cycles Model suggests the Broadening Wedge target may be met by mid-August.
(Bloomberg) Saturday is shaping up to be national air-conditioner day. And while we ordinary humans love a “heat dome” about as much as a “polar vortex,” natural gas bulls should be all over that surge in electricity demand. But they’re nowhere to be seen.
“Cooling-degree days” are a measure of how hot it is relative to normal. Since July 2011, when the data series begins on the Bloomberg Terminal, there have been 22 weeks where the forecast for cooling-degree days was 90 or more (translation: hot). This week, coming in at 93, is one of them. But with natural gas currently hovering at about $2.30 per million BTU, it also scores as the weakest week in terms of pricing.
This summer of more heat than light is a microcosm of the broader problem facing the exploration and production business. And it’s a searing reminder of some salient points as quarterly earnings calls beckon.
Agriculture Prices make a new low
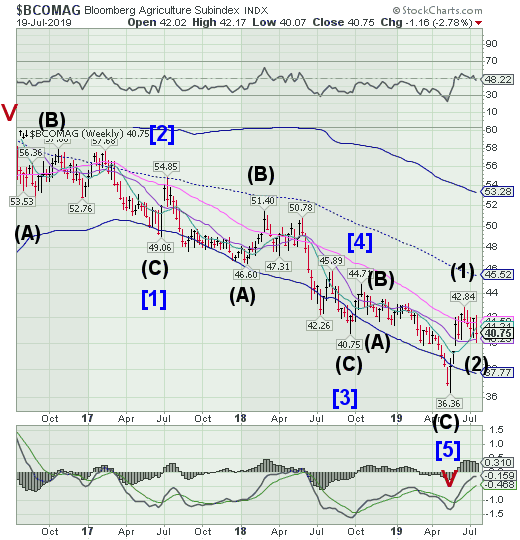
The Bloomberg Agricultural Subindex appeared to be going higher on Monday, then suddenly reversed, making a new low at 40.07 on Thursday. This may have been due to options expiration this week. The Cycles Model suggests that the rally may have legs through mid-August.
(ZeroHedge) I know that this headline is alarming, but it is actually a direct quote from a notice that was recently posted in a Kroger (NYSE:KR) supermarket.
And as you will see below, similar notices are being posted in the canned vegetable sections of Wal-Mart (NYSE:WMT) stores nationwide. I would encourage you to examine the evidence in this article very carefully and to come to your own conclusions about what is happening. At this moment, social media is buzzing with reports of shortages of canned vegetables all around the country. But so far, the mainstream media is being eerily quiet about all of this. Is there a reason why they aren’t saying anything?
Shanghai Index consolidates at Short-term support
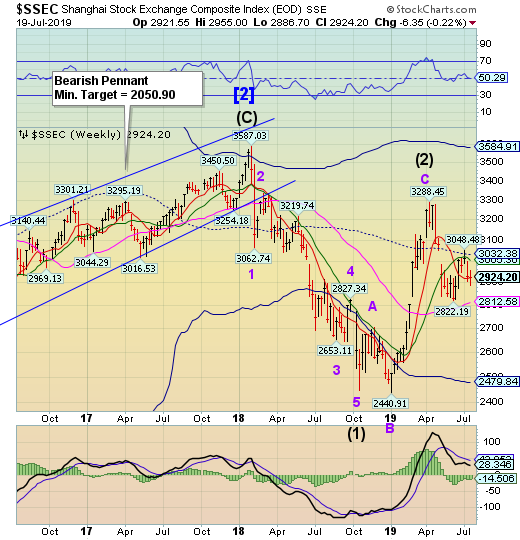
The Shanghai Index consolidated at Short-term support at 2923.13 this week. The Master Cycle high arrived on July 2, setting the stage for a massive decline. A decline beneath Short-term support confirms a sell signal. The loss of strength may persist through late September.
(ZeroHedge) As far back as 2013, China’s macro-economic data has been ‘questionably’ smoothed at best, and outright fake at worst. Whether it is trade data (“never been faker” than in 2016) or aggregate production (2018’s massive GDP distortions), as economist Nouriel Roubini once asserted, China just makes its numbers up.
And, as we pointed out earlier this week, this month was no exception, when following China GDP’s dramatic slowing to just 6.2% YoY – the slowest since record began – there was a delightful surprise to appease those who are wondering whether record credit injections and more easing measures than during the financial crisis had any effect at all. To wit, China retail sales and industrial production rebounded handsomely with the former spiking 9.8% YoY – the most since March 2018.
There’s just one thing though – the entire surge in retail sales (and industrial production) seems to have been triggered by an almost unprecedented sudden surge in auto sales to – who else – the government itself, in the form large, state-owned enterprises. Think Cash for Clunkers on steroids – if the clunkers belonged to the Federal Government, and the new cars purchased were made by the Government.
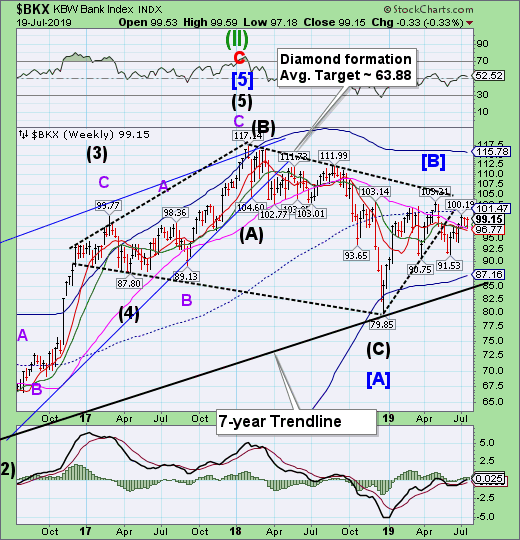
The Banking Index consolidates during options week
