A massive tech selloff weighed on high-flying names on Wednesday, pulling down Facebook (NASDAQ:FB), Apple (NASDAQ:AAPL), Amazon (NASDAQ:AMZN), Alphabet (NASDAQ:GOOGL), Netflix (NASDAQ:NFLX) and many others. Chip makers had their worst day all year with favorites like NVIDIA (NASDAQ:NVDA) getting hammered. Even though the tech selloff was triggered by a broader rotation into financials, it looks like it only lasted one day, although it’s still early.
Selloff Hits FANG
The tech selloff weighed on the NASDAQ and S&P 500, while the Dow Jones Industrial Average closed at a record high. In fact, the selloff was so heavily tech-driven that the S&P 500 ended in the red even though nine of its 11 sectors posted gains. The FANG stocks (Facebook, Amazon, Netflix, Google/Alphabet) all tanked on Wednesday, with Facebook stock off by 4% and Amazon stock down by nearly 3%. Netflix stock declined by more than 5%, while Alphabet was down by more than 2%.
Chip makers led the tech selloff on Wednesday, however, as the PHLX Semiconductor Index declined 4.4%, its worst one-day performance in about a year, according to FactSet data. NVIDIA stock was down by as much as 11% at one point in intraday trading on Wednesday, adding to the previous two days’ losses for its worst three-day selloff in almost two years, according to MarketWatch.
The Great Rotation
Still, it’s not like the tech selloff hit names that were already struggling as most of those affected have been flying high for the last year or more in some cases. Goldman Sachs (NYSE:GS) analysts warned in a note this week that valuations have been stretched for years, so it’s not a matter of if the bull run will end, but when and how fast.
As the tech selloff raged on, the Financial Select Sector SPDR (NYSE:XLF) climbed on Wednesday, and the Dow managed a nearly 80-point gain due to strength in other areas of the market. Meanwhile, some market watchers noted that the “smart money” isn’t buying tech stocks right now.
In a post for MarketWatch, Nigam Arora analyzed market flows by “smart money,” momentum, and short squeeze. It comes as little surprise that the momentum crowd has been gobbling up stocks of late. This is why Tesla (NASDAQ:TSLA) stock, NVIDIA stock, Netflix stock and many others have continued to climb—far past their warranted valuations, many would argue.
Arora also found that smart money flows have been “negative to mildly positive,” with positive flows in large-cap stocks, based on flows into the S&P 500 ETF. He added that smart money isn’t going after small caps, NASDAQ names or popular tech stocks, but it’s not selling either.
On a broader basis, there’s a general rotation into financials going on, and CFRA strategist Lindsey Bell summed up the reasons for this. In a note on Thursday, she upgraded the S&P 500 Financials sector from Marketweight to Overweight on Wednesday due to “expectations that loan growth will slowly improve in 2018, the Federal Reserve will maintain a steady pace of interest rate increases as Jerome Powell takes the helm, and deregulation benefits will become more substantially realized.”
Tech Investors Urged Not To Bail– Yet
The tech selloff seems to have lasted only a day, as Facebook stock, Netflix stock, and other big names are off and running again on Thursday. In a note earlier this week, Oppenheimer analyst Ari Wald highlighted key trends such as these and argued that it’s not time to bail on tech stocks, despite the outsized gains the sector has been posting continuously for a while. He believes that the advance of the tech sector is more consistent with a “healthy grind higher that should continue” rather than a “dynamic blow-off top” which will screech to a halt at some point.
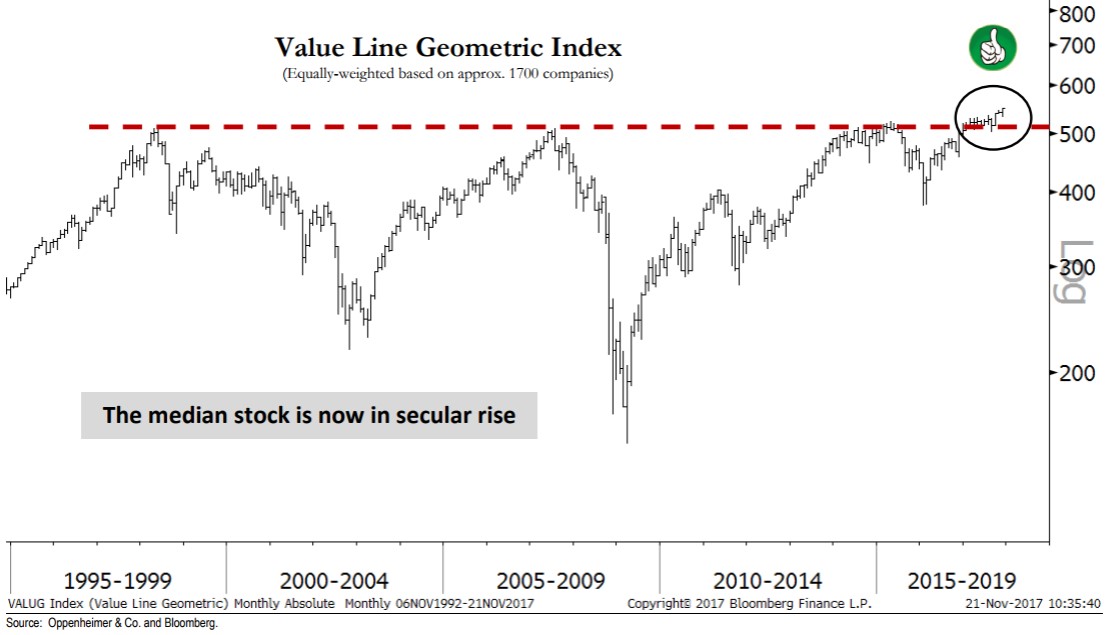
One reason for this is because the market’s advance is more widespread than many are realizing, citing the Value Line Geometric Index’s break above the resistance line going back to 2000. He explained that rallies consisting of many stocks are usually those that continue. The Value Line Geometric Index consists of about 1,700 companies spanning the sectors.
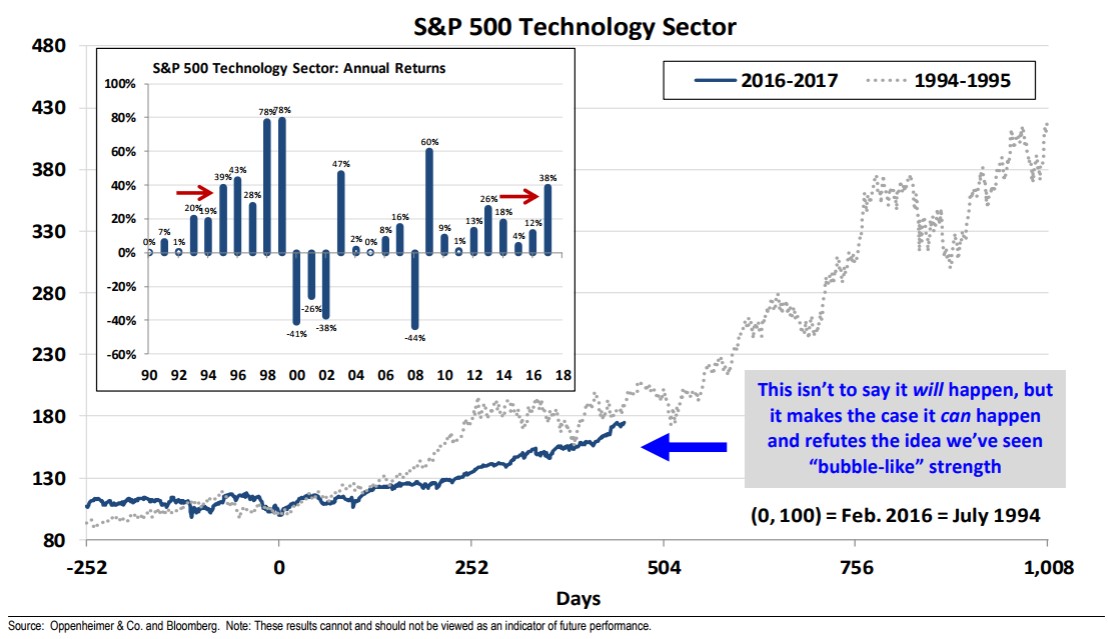
Wald also noted that the RSI rose above 80 for the first time since 1998 and that analogies are being drawn with 1954, 1985 and 1995. However, he added that this year’s rally has been tracking under those years, which is why he thinks we’re seeing just a steady climb higher rather than a sudden blow-up.
The Oppenheimer analyst also pointed out that technology is up 38% year to date now and compared it to the 39% gain posted in 1995. He expects tech to continue moving steadily higher, and at least for now, he’s right because the tech selloff was over fast. Wald believes tech could even be the sector to lead stocks higher in the coming quarters due to his analysis of the price breakout since 2000, broad participation across markets, caps and industries, and tech’s resilience at a time of fluctuating interest rates.


