Over the next few days MrTopStep is going to take the back seat to some of its partners by letting them do the Opening Print. Today is Stewart (@ChicagoStock) of ChicagoStockTrading.com. Tomorrow it will be Tim from Top Notch Trading (@FuturesTNT), and on Friday William Blount. I love writing but I also like to get a look at what some of MrTopStep’s top traders have to say. We learn a lot from each other.
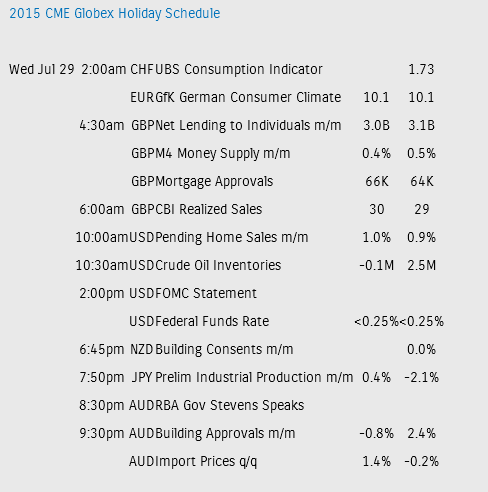
In Asia, 7 out of 11 markets closed higher (Shanghai Composite +3.44%), and in Europe 11 out of 12 markets are trading higher this morning. Today’s economic calendar starts with the MBA Mortgage Applications, Pending Home Sales Index, EIA Petroleum Status Report, 5 Year T-Note Auction, and the FOMC Meeting Announcement.
WHERE HAVE THE CHINA BEARS GONE
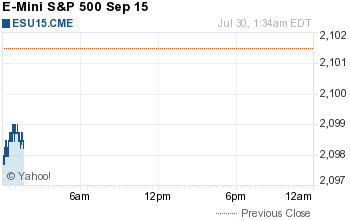
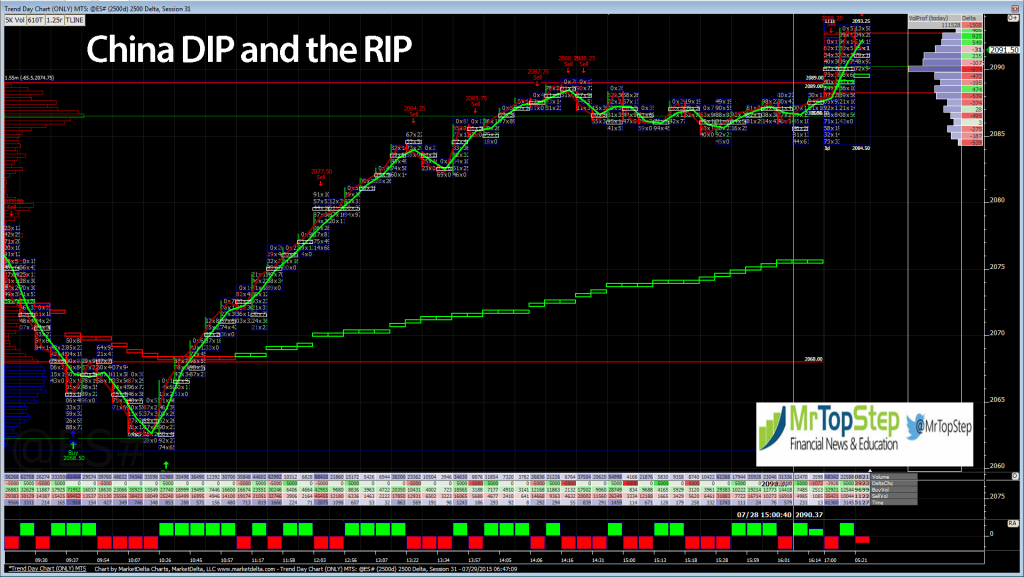
Our View: All I have to say is .. what a blow out. Up 8 days in a row, down 5 in a row, and up yesterday. My heart of hearts says this is just a big “water in the bathtube” trade, but I have to admit, moving from one extreme to the next makes it very hard to project. At the end of the day the S&P 500 is doing exactly what it’s been doing for the last 4 years—catching people short and running back up. The ES made a low at 2061.50 yesterday and now it’s trading to 2093.25. Thirty-two points in about 32 hours. Where have all the China bears gone? Our view is again to sell the rallies, and buy weakness, 1 up day after 5 days means there should be a few more up days coming our way.
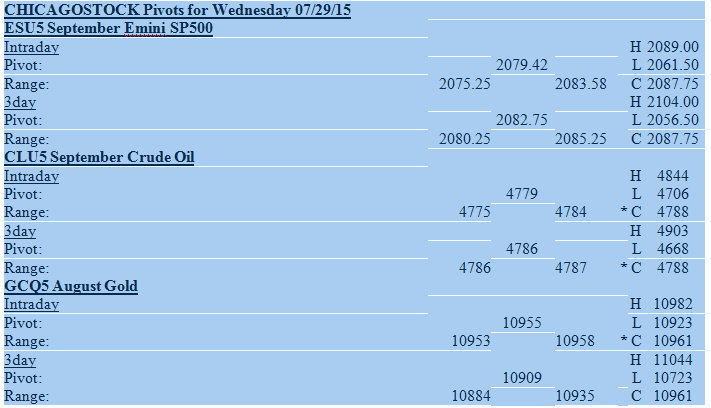
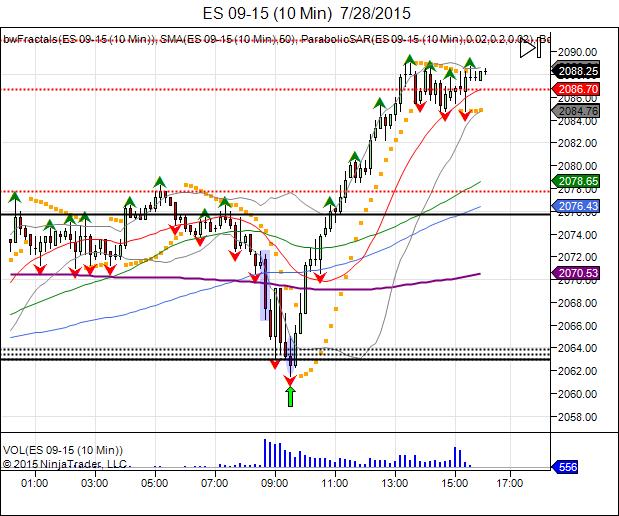
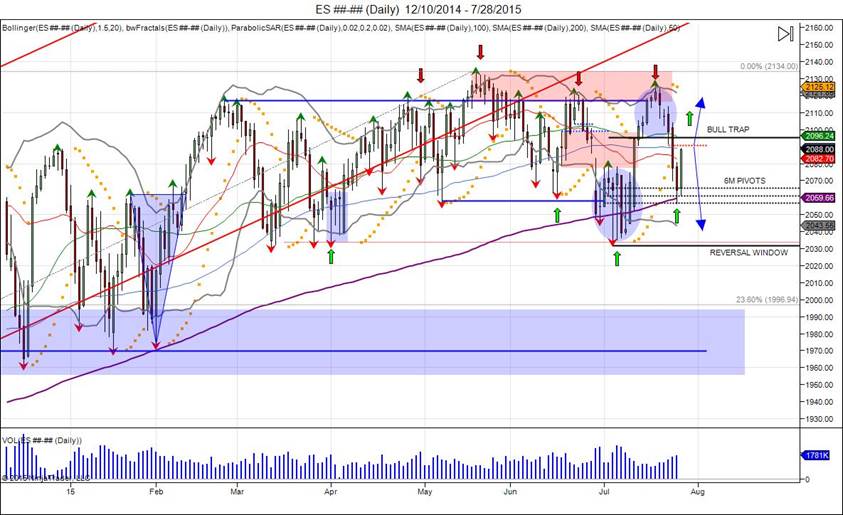
For Wednesday, the market has reached a major infliction point as it waits for the FOMC statement. Tuesday saw downside pressure continue on the open with the market trading down to 206150, only to find support at the lower vol window/pivots. Bear trap was set with breach of 2063 that failed to expand lower, seeing the market reverse back through the vol window and squeeze shorts through the cash open which gave way for a breach of the upper vol window. With buyers coming into buy the market above the upper vol window, a bullish bias was established, giving way for the market to expand another 10, into 2089 before settling at 208775. For Wednesday, the intraday pivot range comes in as first range of support, within 208358-207525. Major support is seen down to 2065 to retest Tuesday’s cash low, with sell stops below. As we see on the daily chart, the market has now bounced off it’s 6 month pivots, giving way to test upside resistance levels. First major resistance is met against 2091 as Thursday’s low, followed by 2097 and 2100. Buy stops are seen above 2104 for shorts to be squeezed, giving way into next level of stops, above Thursday’s 211375 high, which sees next resistance against 2116 with stops above the July highs. With the bullish bias being established for the 2nd half of the year, buyers must be able to recover the upper vol window at 2095 to attempt to overcome resistance, save trapped longs above, and expand higher. Failure to recover through 2095 gives room back to retest current lows. Failure to hold the 6 month pivot support give room to target the reversal window at 2030 which coincide with the July lows. Breach of the July lows are needed to confirm failed breakout and top in markets as longs become trapped and the 6 month bullish bias turns into a reversal bias.
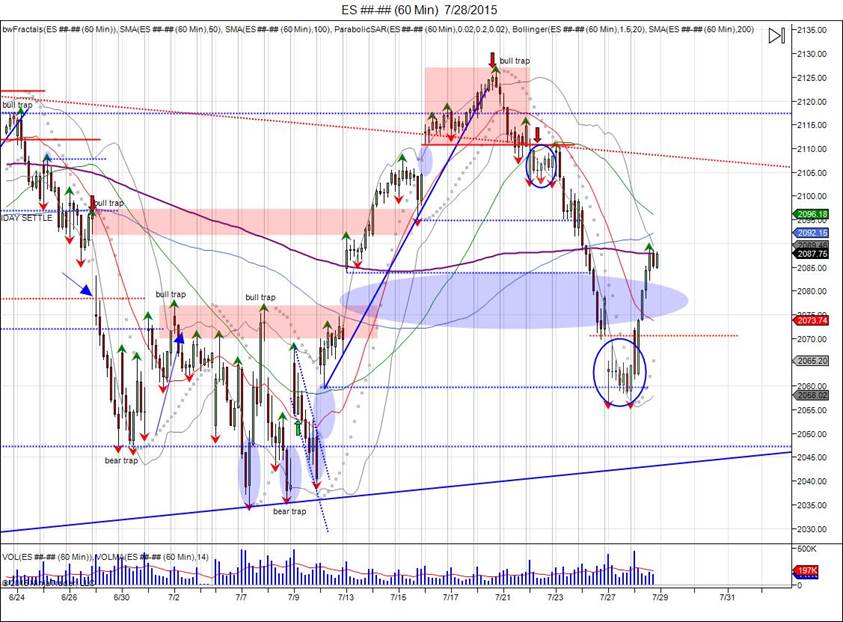
Tuesday saw the cash market open above 206975, leaving shorts from Monday trapped. The market pulled into search for support, finding it at 206150, as sellers failed to break Monday’s lows, giving room for them to be used as fuel to squeeze through 2070 and get back to the 200day MA against 2086 . Going forward, a cash open above 2090 gives room into next resistance at 2095, with stops above 210150 to see next MAJOR resistance against 2103-2104 as last Wednesday’s lows, prior to seeing the floor drop out on Thursday. In order to reverse this downside momentum, this resistance must be squeezed, with stops above 211050.
In Asia 7 out of 11 markets closed higher : Shanghai Comp. +3.44%, Hang Seng +0.47%, Nikkei +0.38%
In Europe 11 out of 12 markets quoted are trading higher : DAX +0.37%, FTSE +0.60%, CAC 40 +0.39%, MICEX +0.58%, at 6:00 am CT
Fair Value: S&P -6.69, NASDAQ -8.81 , Dow -81.52
Total Volume: 1.7mil ESU and 5.5k SPU traded
Economic calendar: MBA Mortgage Applications, Pending Home Sales Index, EIA Petroleum Status Report, 5 Yr-Note Auction, FOMC Meeting Announcement..
E-mini S&P 5002098.75-2.75 - -0.13%
Hang Seng 24627.65+8.20 - +0.03%
Nikkei 22520539.43+236.52 - +1.16%
DAX 11211.85+37.94 - +0.34%
FTSE 1006631.00+75.72 - +1.16%
Euro 1.0977
