
EU and US equities traded in the red yesterday, as investors may have decided to lock some profits ahead of the first Trump-Biden presidential debate. There was no clear winner and thus, the financial markets did not react.
Sentiment improved somewhat during the Asian session today, but this was due to China’s better than expected PMIs. As for today, we get Eurozone’s inflation data for September. It would be interesting to see whether the bloc remained in deflation, and whether this would raise speculation for more easing by the ECB.
The First Presidential Debate Results In No Market Reaction
The US dollar continued trading lower against the majority of the other G10 currencies on Tuesday and during the Asian morning Wednesday. It gained only versus CAD and GBP, while it was found virtually unchanged against JPY. The main gainers against the greenback were SEK, EUR, and AUD in that order.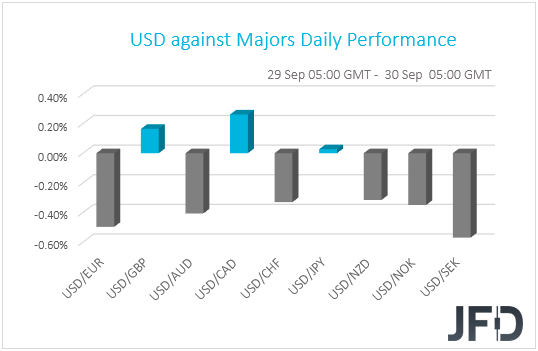
The relative weakness of the dollar and the yen, combined with the strengthening of the Aussie, suggests that financial markets continued trading in a risk-on fashion.
However, turning our gaze to the equity world, we see that major EU and US indices were a sea of red, with investors’ appetite improving somewhat during the Asian session today. Although Japan’s Nikkei 225 and China’s Shanghai Composite slid 1.58% and 0.46% respectively, Hong Kong’s Hang Seng and South Korea’s KOSPI are currently up 0.29% and 0.86%.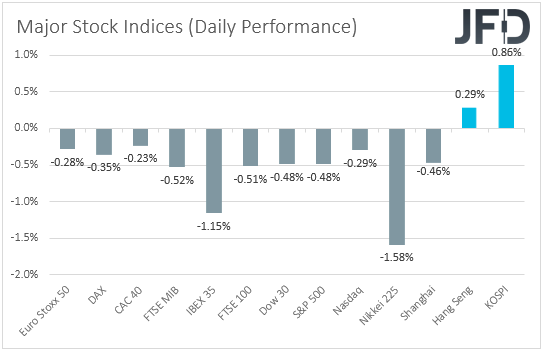
It seems that after Monday’s rally, EU and US traders may have decided to lock some profits ahead of the first debate between presidential candidates Donald Trump and Joe Biden. The debate did not move the needle in betting markets, as there was no clear winner, and as a result, the financial markets did not react.
The two frontrunners battled over Trump’s response to the coronavirus pandemic, the economy, and taxes, with the discussion marked by multiple interruptions and aggressive personal attacks. The improvement in the broader sentiment during the Asian session was not the result of the debate, rather of data suggesting that the Chinese economic recovery is well on track. The nation’s official manufacturing PMI rose to 51.5 from 51.0, beating estimates of a more moderate increase to 51.2, while the non-manufacturing index increased to 55.9 from 55.2. There was no forecast for the non-manufacturing index.
With all that in mind, even if equities continue to recover somewhat following China’s encouraging data, we remain reluctant to call for a long-lasting recovery. Coronavirus infections continue to rise at a fast pace around the globe, while, as we get closer to the US election day, markets may begin to be more responsive to headlines, debates, and polls on that front.
Generally, a Trump reelection may be positive for the equity world, as the incumbent President is likely to keep the 2017 corporate tax cuts in place, while Biden has pledged to increase taxes in corporations and high-income individuals. According to national polls, Biden is leading Trump by 50%-43%.
S&P 500 Technical Outlook
The S&P 500 cash index initially moved higher yesterday, however after the US opening bell, the price drifted a bit lower and ended up closing the day slightly in the red. Looking at the cash index this morning, we can see that the small decline continues, however, let’s not forget that the S&P 500 is still balancing above the short-term tentative downside resistance line, which it broke on Monday. This may still keep the bulls interested, especially if the price remains above that line. For now, we will take a cautiously bullish approach.
A small decline might bring the index back to the 3279 hurdle, marked by the inside swing high of Sept. 24, or to the aforementioned downside line to test it from above. If that whole area provides decent support, the bulls could take advantage of the lower price and step in. If so, the S&P 500 might rise back to yesterday’s high, at 3373, a break of which would confirm a forthcoming higher high and open the way to the 3429 zone, or even the 3448 level, marked by the highs of Sept. 16 and 8 respectively.
In order to shift our attention to lower areas, a price-drop back below the previously discussed downside line would be needed. Also, a move below the 3252 hurdle, might strengthen the downside case. The index may then slide to the area between the 3209 and 3217 levels, marked by the lows of Sept. 25 and 24 respectively. The index may stall there for a bit, but if the bears are still feeling comfortable, a break of that territory would confirm a forthcoming lower low and could open the door towards the 3174 obstacle, or even the 3128 level, which is the low of July 14.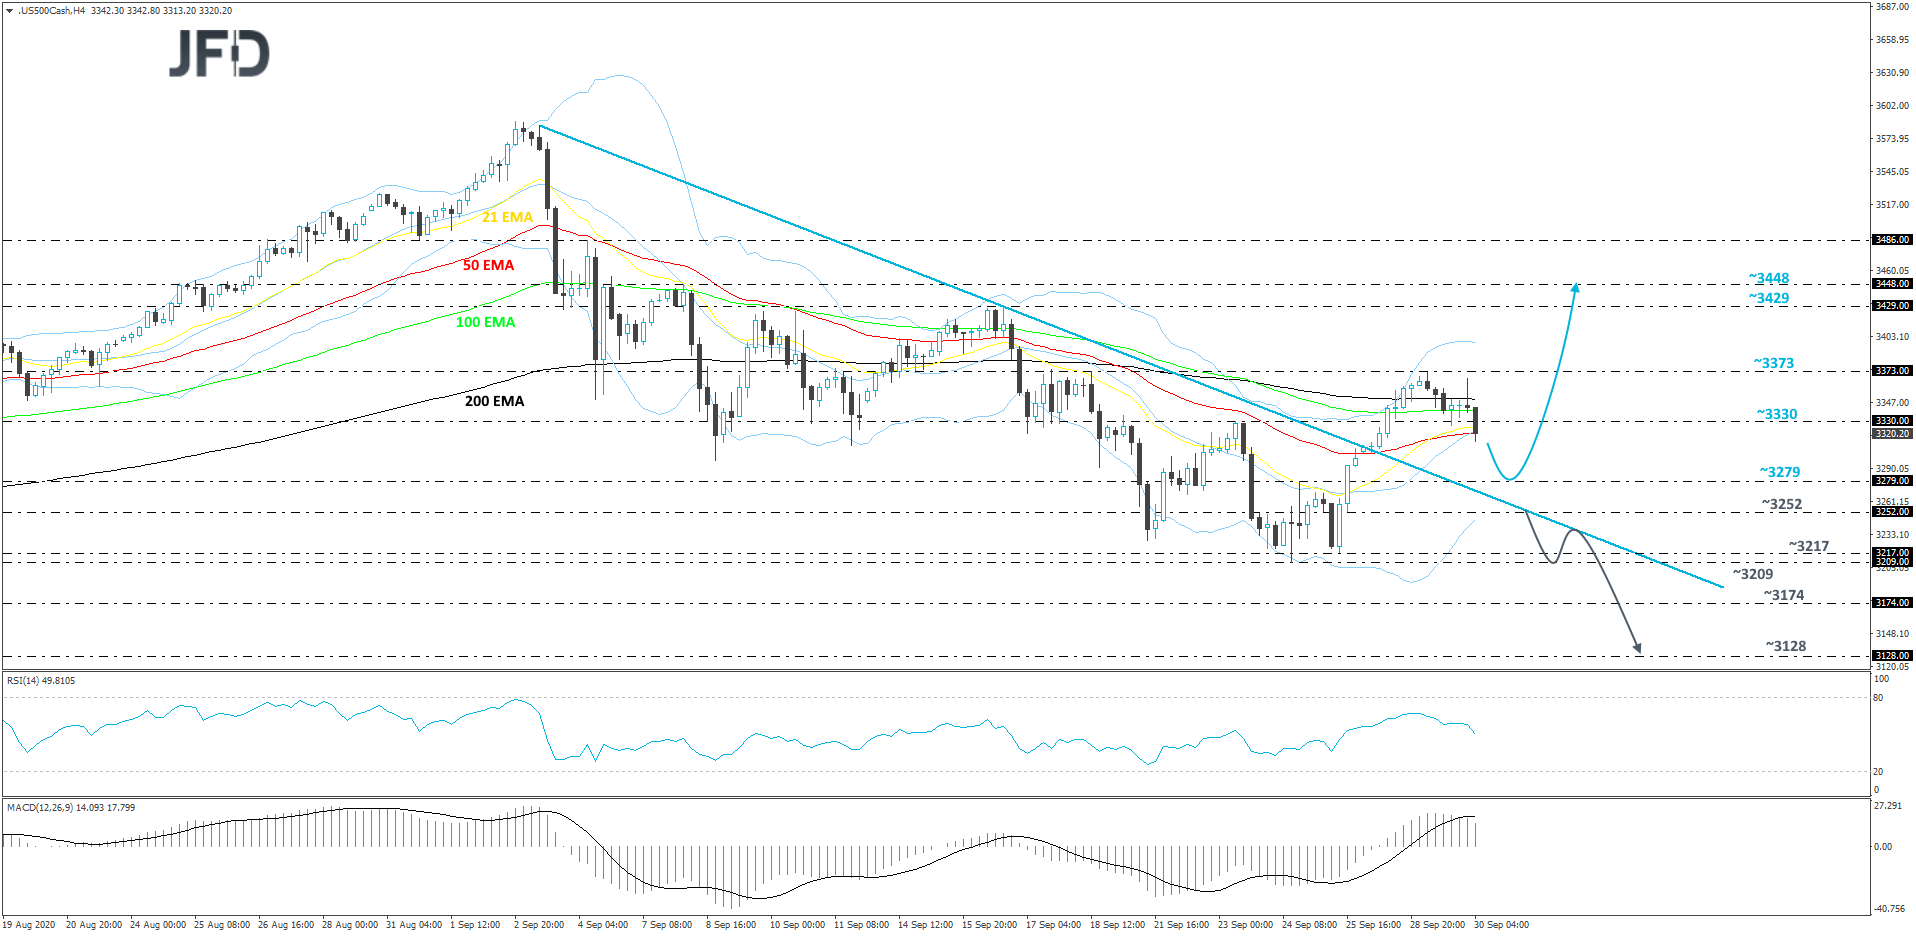
Will Inflation In The Eurozone Fall Further Into Negative Water?
Back to the currencies, the euro was among the main gainers against the greenback, with its traders perhaps waiting for the preliminary Eurozone inflation data for September, due out today. The headline rate is forecast to have held steady at -0.2% yoy, while no forecast is available for the core one. That said, the HICP excluding food and energy metric is expected to have accelerated to +1.1% yoy from +0.6%. Bearing in mind that both the German CPI and HICP rates slid by more than anticipated, entering negative waters, we see the risks surrounding the block’s headline rate as tilted to the downside.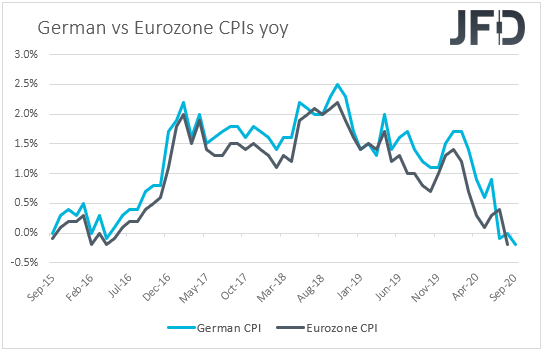
At the prior ECB meeting, policymakers kept monetary policy untouched, reiterating that they stand ready to adjust all their instruments, as appropriate, to ensure that inflation moves towards its aim in a sustained manner. Following the worse-than-expected PMIs for September, with the services sector slipping into contraction, a further decline of the headline CPI into the negative territory may increase speculation for additional stimulus by the ECB.
However, the fact that the core HICP rate is expected to have accelerated means that the weak headline CPI rate may be the result of declines in energy and food, which may allow policymakers to wait for a while more before they decide to push the easing button. They may prefer to wait and see whether the deflationary rate is something temporary or not.
As for the euro, it could slide in case the headline CPI slides further and the core HICP print misses its estimates. However, the opposite may be true if the core HICP metric accelerates more than forecasted, despite the headline CPI rate staying negative.
EUR/NZD Technical Outlook
From around mid-September, EUR/NZD was seen drifting higher, until it found resistance near the 1.7875 barrier, from where the pair corrected lower. Now, the rate keeps moving in an undecisive manner, forming a symmetrical triangle. Until one of the sides of that triangle is broken, we will remain neutral.
If the rate accelerates and crosses above, not only the upper side of the triangle, but also above the 1.7833 barrier, marked by the current high of this week, that could spark interest in the eyes of more buyers, inviting them to join the action. EUR/NZD might then travel to the 1.7875 obstacle, a break of which may clear the path to the 1.7949 zone, which is the low of Aug. 19. The pair could get halted around there for a bit, however, if the buying is still strong, the next possible resistance target might be at the psychological 1.8000 level, marked by the low of Aug 24.
Alternatively, if the rate slides below the lower side of the aforementioned triangle and also falls below yesterday’s low, at 1.7735, that could open the door for further declines. EUR/NZD might travel to the 1.7708 obstacle, a break of which may clear the way towards the 1.7670 hurdle, marked by the high of Sept. 21. The rate could stall there for a bit, or even correct back up a bit. That said, if the pair struggles to get back above the 1.7708 barrier, another round of selling might be possible. EUR/NZD could slide to the 1.7670 area, a break of which may set the stage for a push to the 1.7584 level, marked by the lows of Sept. 22 and 23.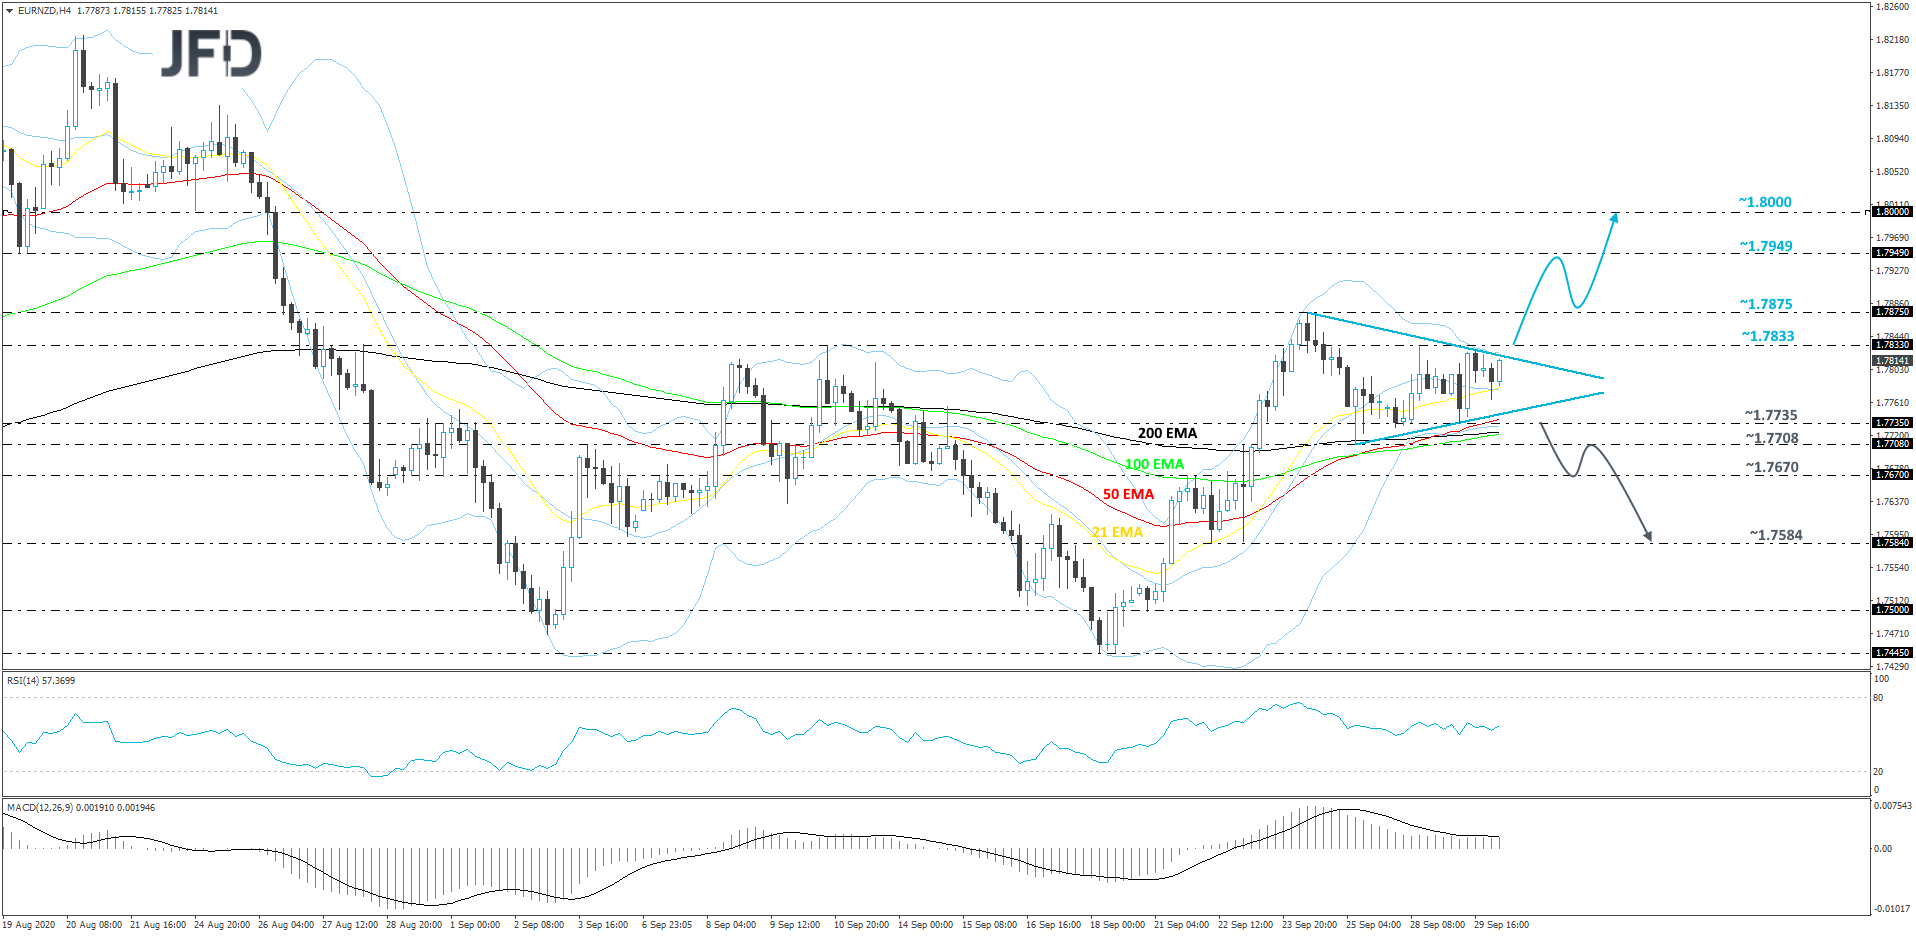
As For The Rest Of Today's Events
During the early European morning, we already got the UK’s final GDP for Q2, which revealed an upside revision to -19.8% qoq from -20.4% qoq.
Later, from the US, we get the ADP employment report for September. The forecast suggests that the private sector has gained 605k jobs after adding 428k in August.
This may raise speculation that the NFPs, due out on Friday, may come slightly below their own forecast, which is at 875k. That said, we repeat for the umpteenth time that the ADP number is far from a reliable predictor of the NFP print. Even last month, when the ADP revealed a 428k additional jobs, the NFP came in at 1.027mn.
The final GDP for Q2 and pending sales for August are also coming out. The final GDP is expected to confirm its second estimate, while pending home sales are forecast to have slowed to +3.2% mom from +5.9%.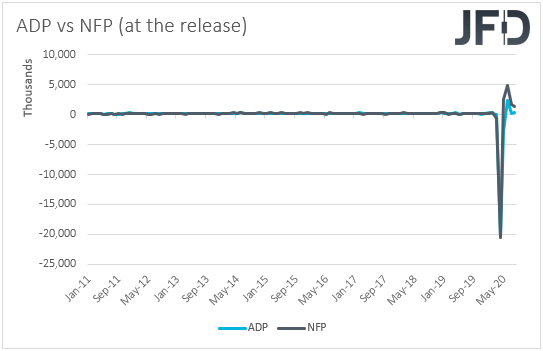
From Canada, we get the monthly GDP for July, which is expected to reveal a slowdown to +3.0% mom from 6.5%. However, this would still be a historically strong monthly rate, which combined with the little changed CPIs for the month of August, is very likely to allow BoC policymakers to sit comfortably to the sidelines for a while more. At their latest meeting, they kept policy unchanged, reiterating that they stand ready to adjust their programs if market conditions change.
With regards to the energy market, we get the EIA (Energy Information Administration) report on crude oil inventories for last week, and the forecast points to a 1.569mn increase after a 1.639mn decline the week before. However, bearing in mind that, yesterday, the API report revealed a 0.831mn slide, we would consider the risks surrounding the EIA forecast as tilted to the downside.
As for tonight, during the Asian session Thursday, Chinese markets will be closed due to the Mid-Autumn Festival. In Japan, the Tankan survey for Q3 is due to be released. Both the large manufacturers and non-manufacturers indices are forecast to have risen to -23 and -9 from -34 and -17 respectively.
We also have five speakers on today’s agenda: ECB President Christine Lagarde, ECB Chief Economist Philip Lane, BoE Chief Economist Andy Haldane, Minneapolis Fed President Neel Kashkari, and Fed Board Governor Michelle Bowman.