Asian equity markets are seeing follow-through buying after yesterday’s bullish move, although the good-will seems to have been limited to equities, as iron ore futures are 4% lower, with decent downside moves in rebar and coking coal futures too.
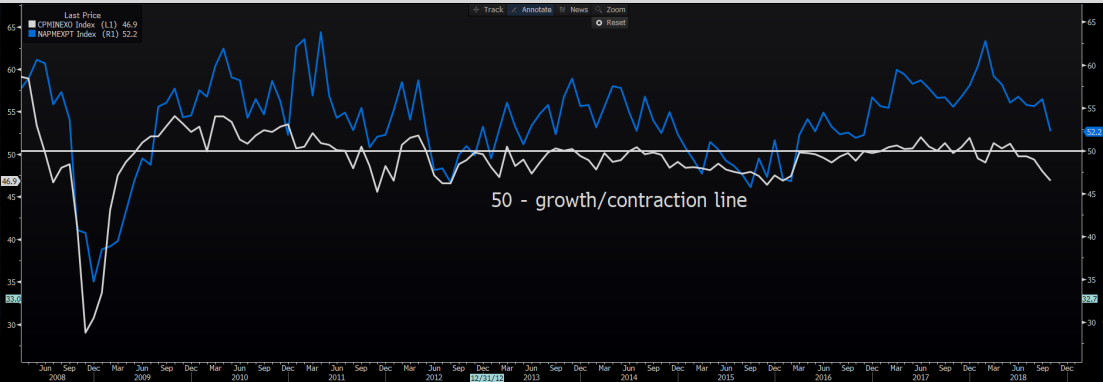
Without going into the raft of stimulus measures announced, the market sees the stock market as the only real beneficiary here. When you see the Hang Seng and CSI 300 gaining 1.9% and 2.4% respectively, one questions if liquidity is being sucked out of the commodity complex and re-positioned into stocks. When we look the global manufacturing PMI series, we have to take a look back at China’s official PMI numbers and see the new export orders pushing into a worrying level of contraction, while new orders are barely in growth territory. This is clear fodder for the bears, who will draw parallels with the weakness cropping up in bulks and base metal futures.

We can extend the manufacturing PMI data to a more global position and see the new orders sub-component, perhaps the best inward indicator on domestic demand, and see contractionary reads in Turkey, the UK, Germany, Taiwan, Malaysia and Indonesia. We don’t need to be a bear to see the ruthless moves in US and Brent crude, with US crude notably trading through my short-term target of $64.43 and the news of increased Saudi output, to the highest level since 1962, just providing those short further ammunition, at a time when the wind is already to their backs.
We have even seen follow-through selling through Asia in the barrel, and the close through the neckline of the double-top ($64.43) puts a move into the 200-day MA at $52.06 into play. As we can from the Bloomberg chart, the orange line portrays US 10-year ‘Breakevens’, or the markets expected inflation rate over the coming 10-years and naturally this is highly correlated with oil. This is a tradeable instrument for market participants, and the worrying aspect here is that inflation expectations are now breaking key levels and this requires close attention.

We can take this expected inflation measure and subtract it from the US 10-year Treasury to derive the ‘real’ 10-year treasury yield and see this now at 1.11% - the highest level since 2011. This is a worry, as the combination of higher real yields, vulnerabilities in US housing and manufacturing are never a good mix for risk sentiment. Especially when libor rates sit at 2.55% and the highest since 2008, and this represents another tightening of US financial conditions on the grounds of higher funding charges.
If the Fed doesn’t start to show some acknowledgement and a slight increase in concern during next Fridays (06:00aedt) FoMC meeting, then we could be staring at another pick-up in volatility. Recall, at the prior meeting the Fed labelled economic activity and job creation as ‘strong’, so it seems a little early for them to materially deviate from this stance.
As mentioned, these dynamics haven’t manifested into worries in equity markets, with the Nikkei 225 +0.6%. That said, the ASX 200 closed up 0.1% and has been influenced by the S&P 500 and to a lesser extent Nasdaq futures, which, as I type are finding strong buyers on headlines Trump is drawing up plans for a trade deal. Watch this space, as this positive story seems to overlook all the bearish themes I mentioned earlier.
Apple (NASDAQ:AAPL) detailing a relatively soft outlook, resulting in a 6.5% sell-off in post-market trade will never be taken well, and it worries that Amazon (NASDAQ:AMZN), Google (NASDAQ:GOOGL) and Apple, three absolute giants of the market, have disappointed to such an extent. The positive tape in China is supporting the Aussie index to a degree, although financials are doing their best to see the market finish in negative territory.
I don’t see Asia showing any concerns of holding risk positions around tonight’s US payrolls (23:30aedt), and G10 FX has been fairly calm through Asia, and I would put this down to a largely stable read in USD/CNH, despite a chunky 299-point move lower in the CNY ‘fix’ (the biggest strengthening of the CNY since 28 August). That said the Trump trade news is promoting CNY buyers here and this cross rate requires close attention as it is the mac-daddy of currency pairs right now and so influential on broad USD moves. Its no surprise AUD/USD has pushed higher on this development after yesterdays chunky 3.5 standard deviation move.
When it comes to payrolls, there is only one game in town, and that is the average hourly wage data. If we do have to look at jobs, the consensus call has increased a touch of late to 200,000 jobs, and that is very much in line with the six-month and two-year average of 209,000 and 192,000 respectively. So, even if weather patterns distort this jobs print I feel the market shouldn’t react too much to a miss or beat. A growth rate in wages sub-3% will not be taken well by USD longs though, while on the other side of the argument a wage print above 3.3% should re-invigorate USD Longs. The playbook is set and once this is out the way its all eyes on the mid-week Midterm elections.
