Today we get more rate talk from the ECB, however, do not expect it to be as exciting as the Fed’s Janet Yellen comments yesterday.
The Fed Chair indicated that with near full employment and inflation headed to the +2% target, it makes sense to “raise interest rates.” The overwhelming consensus for the ECB is that they will hold rates steady and for quiet sometime (07:45 am EST). Yellen and her Board of Governors sees multiple interest hikes likely through 2019, until the target of +3% Fed Fund rate is reached.
For Draghi, questions on potential further changes to the ECB’s QE should be the most important aspect of today’s monetary policy meeting. He is expected to be rather dull to minimize any impact on markets. Don’t be surprised if he points to energy prices as the main and temporary driver of current higher inflation.
Nevertheless, recent stronger growth and growth outlook, higher inflation and inflation expectations could mean some awkward questions during the obligatory press conference (08:30 am EST).
The reality is that the ECB is not ready to signal a “normalization” of its extremely loose monetary policy yet, in contrast to the Fed.
1. Equities mixed, waiting for ECB direction
Asian stocks are mostly little changed overnight ahead of President-elect Donald Trump’s inauguration. The outlier was Japanese equities which found support from a rebounding USD.
Japan’s Nikkei rallied +0.9% on the back of a weaker yen (¥114.69) lifting the export-heavy index. Shares elsewhere in Asia have edged lower, with Hong Kong’s Hang Seng down -0.4% and the Shanghai Composite Index off -0.4%.
In Europe, equity indices are trading generally lower ahead of the ECBs interest rate decision. Markets continue to digest Fed Yellen’s comments made yesterday to gauge near to medium term rates outlook. Financials trade mixed on the Eurostoxx 600, while the FTSE 100 is weaker on energy stocks trading lower as oil markets consolidate after yesterdays large sell-off in crude.
U.S futures are expected to open in the red (-0.2%).
Indices: Stoxx50 -0.3% at 3,284, FTSE -0.6% at 7,202, DAX -0.1% at 11,586, CAC 40 -0.3% at 4,838, IBEX 35 -0.6% at 9,332, FTSE MIB -0.5% at 19,260, SMI -0.5% at 8,274, S&P 500 Futures -0.2%
2. Oil prices bounce on IEA comments
Oil is attempting a rally from yesterday’s one-week low supported by comments from the International Energy Agency (IEA) this morning stating that the global oil markets are “tightening with demand rising” as market focus turns toward cuts promised by OPEC and non-OPEC producers.
Note: Sentiment in oil markets has been torn between expectations of a rebound in U.S production (particularly shale) and hopes that oversupply may be curbed by output cuts announced by OPEC.
The IEA said it has kept demand estimates for OPEC crude oil for this year steady at +32.9m bpd as compared with production of +33.09m bpd in December.
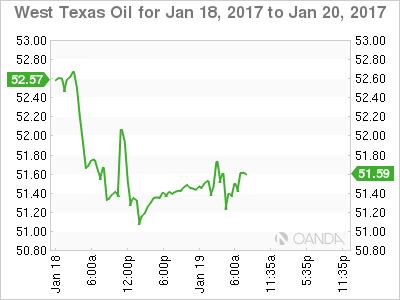
Brent crude futures have rallied +58c, or +1.1% to +$54.50 a barrel after closing down -2.8% yesterday. U.S. West Texas Intermediate (WTI) is trading up +53c at +$51.60 per barrel, having dropped to a one-week low on Wednesday at +$50.91.
Investors will seek direction from today’s U.S EIA inventory report – It’s been delayed by a day due to Monday’s MLK holiday.
Data from the yesterday’s API showed U.S. crude stocks fell by -5.04m barrels in the week to Jan. 13.
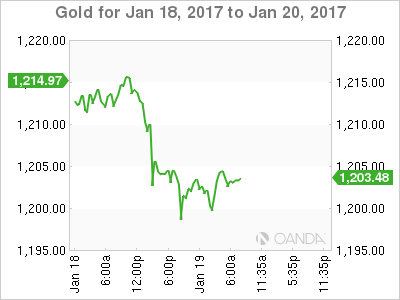
Gold prices (+$1,203.11) continue to hold on to their losses from yesterday’s session, when they fell -1% on a strong dollar, after the Fed’s Janet Yellen advocated lifting interest rates gradually.
The bullion hit a two-month high of +$1,218.64 on Tuesday, and expect the markets uncertainty over Trump’s policies ahead of his swearing-in tomorrow to keep the metal underpinned.
3. Sovereign yields find support from a ‘hawkish’ Fed
Naturally, the pace of rate divergence is moulding the shape of sovereign yield curves. Fixed income dealers are currently focusing on the Bund/Treasuries swaps where the ECB is not ready to signal a “normalization” of its extremely loose monetary policy yet, in contrast to the Fed.
Yields in Europe are playing catch-up with Treasuries, which sold off yesterday after the Fed’s Yellen ‘hawkish’ comments stated that the U.S economy is strong enough to warrant higher interest rates.
Yields on 10-year German bunds have backed up +3bps to +0.38%, while U.S. 10's trade steady at +2.43%.
Elsewhere, the U.S TICS flows data indicate that China continues to reduce its holdings of U.S debt for the sixth consecutive month and by the biggest margin in five-years (+$1.05T vs. $1.12T). Japan remains the top holder of U.S debt for second straight month (+$1.11T vs. +$1.13T).
4. The “Big” dollar finds support from Hawkish Yellen
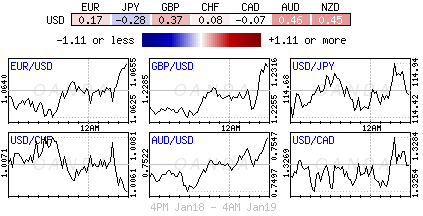
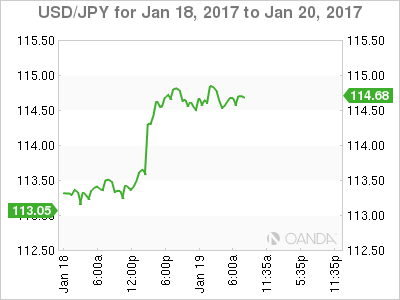
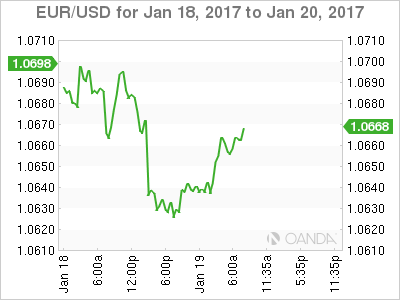
The dollar continues to hold firm against most of its major rivals (€1.0655, ¥114.67, £1.2335) ahead of the U.S open supported by Fed Chair Janet Yellen comments Wednesday by promising a “few” rises in U.S interest rates this year.
The greenback gained as much as +2% yesterday, two-days after the biggest drop in the dollar since last June on comments from the U.S President elect that the dollar was “too strong.” Yellen’s speech yesterday seems to have turned investors back to the narrative of strong growth and rising inflation.
However, despite this week’s dollar correction, the greenback is still in the middle of its worst four-week performance in five months on concerns that Trump may prefer a weaker dollar and worry on geopolitical uncertainty.
Note: Which currencies would likely lose from U.S “protectionism”? China’s offshore yuan, the loonie, MXN and proxy currencies like the AUD and NZD as well as EM units in Asia.
5. Aussie net employment rises for third month
Data overnight showed that Australia’s employment data for December proved somewhat of a mixed bag. Their unemployment rose to its highest level in six months, but employment also grew modestly (+13.5k – third straight increase).
The jobless rate edged up for a second-straight month, hitting a higher-than-expected seasonally adjusted +5.8% vs. +5.7% in November.
For the RBA, this only increase doubts over the likely strength of a hoped rebound from the country’s first contraction in over five-years.
The AUD (A$0.7551), like most interest and commodity sensitive currencies, continues to battle ‘hawkish’ Fed headwinds and Trumponomics.
