As we said last week:
“As shown, there is a significant amount of overhead resistance between 2780 and 2800 which may present a challenge in the short-term to a further advance. However, I suspect any weakness next week will likely provide a decent opportunity to increase equity exposure modestly. This idea aligns with the updated the ‘pathway analysis.’
We had previously given pathway #1, #2a and #2b a 70% probability of coming to fruition. The tracking of pathway #1 also negates pathway #3 entirely for now.
More importantly, the market is sitting at the critical juncture of either a continuation of pathway #1 toward all-time highs, or a correction of some sort to retest support and confirm this past week’s breakout. A corrective retest that provides a better entry point to increase exposure is the most preferable of outcomes.”
I have updated the S&P 500 analysis through Friday’s close.
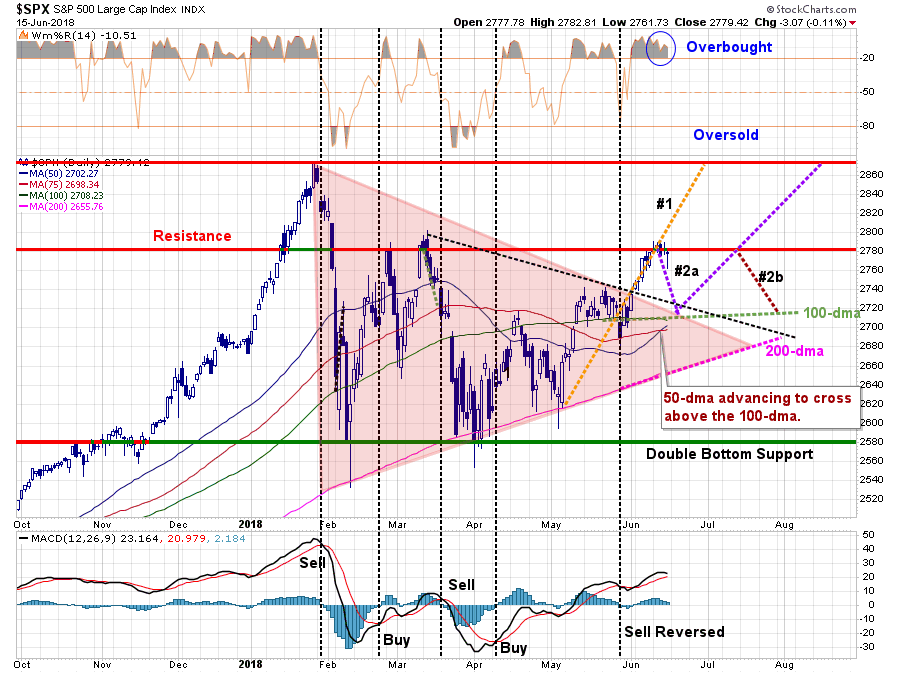
For the week, the market finished mostly unchanged (+0.01%) as resistance at 2780 proved to be formidable for the markets first attempt to move higher.
With the Federal Reserve, ECB and the White House’s “Chinese Tariffs” in the rearview mirror, the strength of the “bulls tenacity” to hold their ground was evident this past week. As I stated previously:
“For now, the market has ‘priced in’ most of the ‘known’ risks to some degree. What hasn’t been ‘priced in’ is unexpected economic weakness, a credit related event, or a new geopolitical risk currently not on the horizon. These things happen, and while the current backdrop is very positive for stocks currently, not paying attention to the risks has very negative consequences.”
I believe that still to be the case. The longer-term picture remains concerning for investors currently as many of the more important risks remain as the Fed continues to tighten monetary policy, along with the ECB, by lifting rates and reducing liquidity. As noted by Upfina this past week:
“We’re getting close to a point where the Fed’s policy could be considered contractionary which means the bull market is close to ending. That’s why investors need to be focusing their attention on changes in the inflation data, which becomes the most important late business cycle metric.”
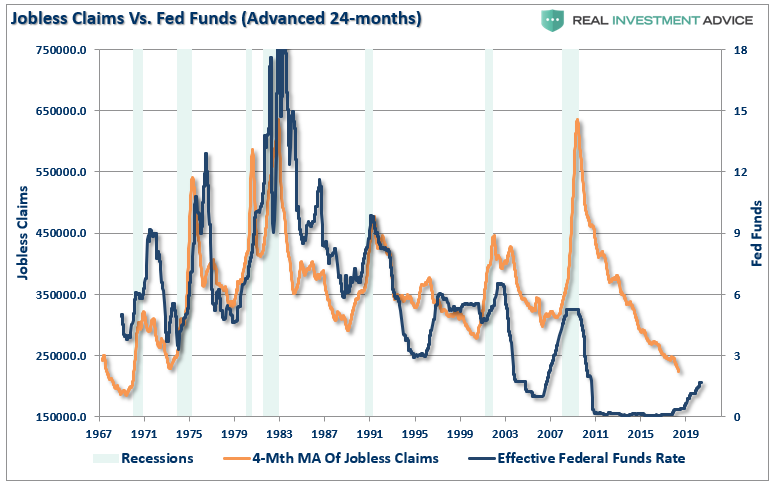
That is absolutely correct. While the mainstream continues to cheer each print of the economic data points, it is worth remembering that recessions always begin from where “everything is as good as it gets.” It is also not surprising to see an economic “up-tick” just prior to the onset of a recessionary spat. For example, just take a look at what happens, historically speaking, when jobless claims are at historic low points as the Federal Reserve is tightening monetary policy. (Fed Funds lagged by 24-months)
As I noted last week, the market cleared the 61.8% Fibonacci retracement from the recent lows which removes a major barrier in reaching previous market highs. It also managed to hold above that previous resistance level this past week as well.
The market has continued to remain within its bullish trend channel from the 2015 lows which is why we only mildly reduced our overall equity exposure in February of this year. On a very short-term basis, the market is overbought so we will look for weakness next week to add further exposure to portfolios.
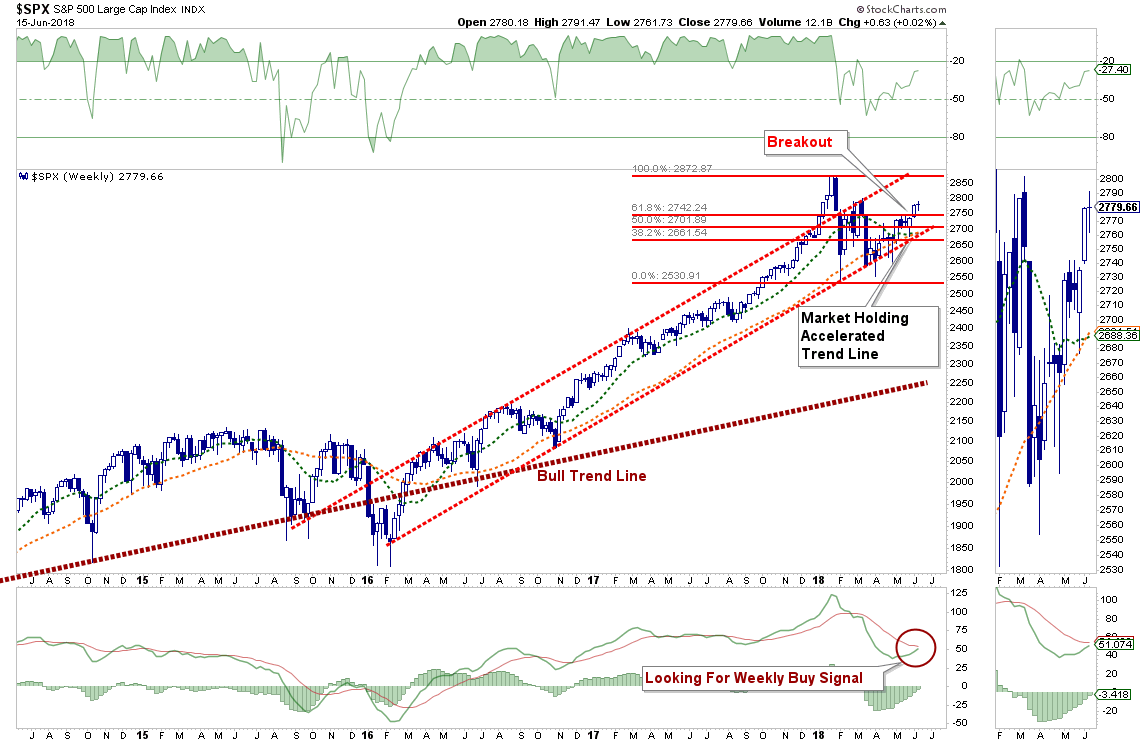
This is particularly the case given the weekly “buy signal” is close to triggering and any further market strength, or consolidation, will likely trigger that signal by the end of next week. In accordance with our discipline, such a trigger will require opportunistically increasing equity exposure back to target levels.
However, while our discipline and strategy require us to act accordingly, we do so with some trepidation given the ongoing deterioration of participation in the market. The chart below is a monthly chart of the number of stocks in the S&P 500 index trading above their respective 50 and 200-day moving averages.
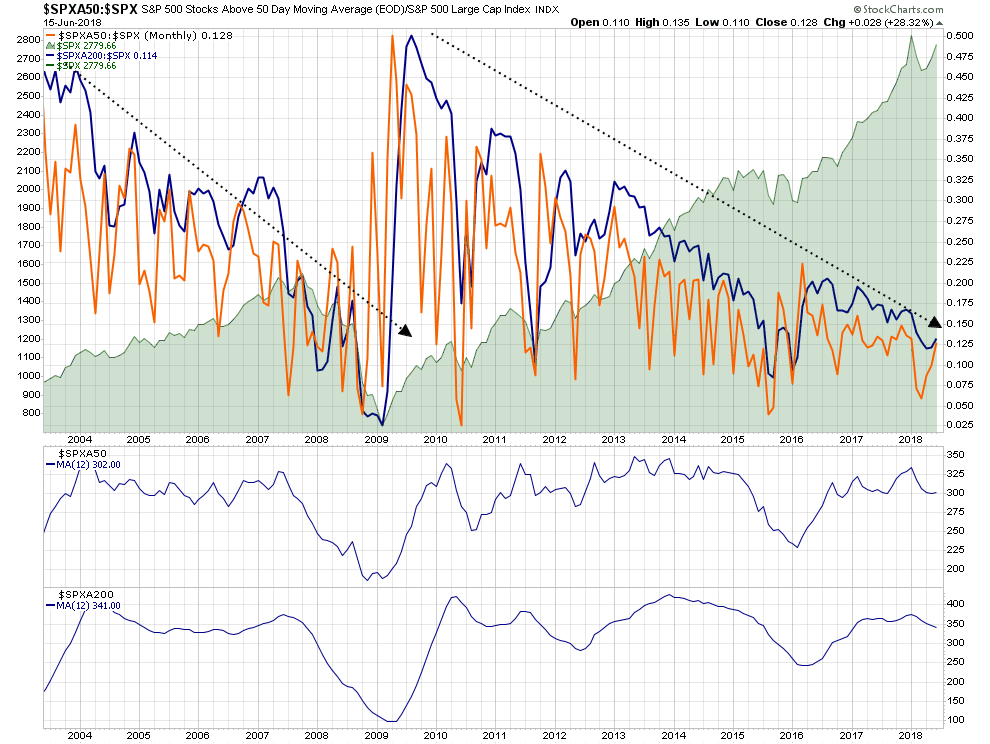
Note the similarity of the declines in participation during the 2003 to 2008 peak versus the current advance.
Let me restate from last week:
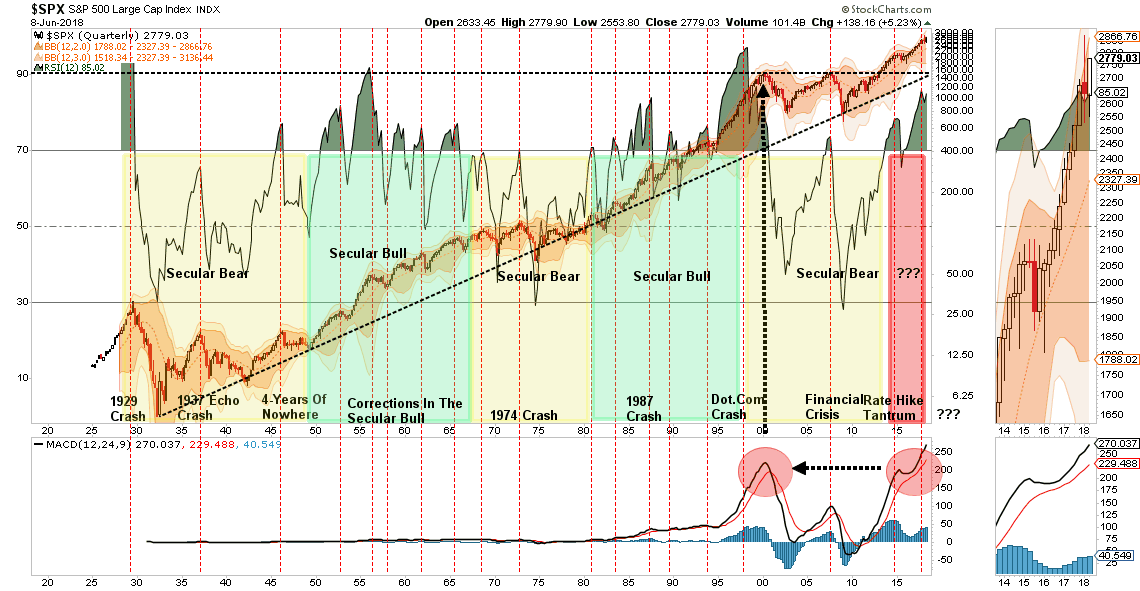
“There is a more than reasonable risk the markets could well rally to all-time highs only to fail once again.
While the ‘bulls’ will be quick to suggest the markets are set to run indefinitely higher, the reality is that we remain very late in the current cycle, rates are rising, liquidity is being extracted and valuations are elevated. While any one of those issues has proved problematic for stocks in the past, the combination of all of them are a toxic brew longer-term. This is particularly the case with a market that is at extremes rarely seen in market history.”
“While we will begin slowly increasing our exposure to equities back to target allocations starting next week, we do so with a risk-management process in place.
We encourage you to do the same.
If you don’t have one, it might be time to develop one.”
Oil Provides Some Clues
Along with our concerns on the longer-term fundamental and technical backdrop, we are also watching interest rates and oil prices very closely as they are sending signals that do not “jive” with the more bullish mantras.
There is a decent correlation between the direction of energy prices and the markets. This is not without reason as higher energy prices, in the short-term, push inflation, retail sales, and other economic data higher. However, in the longer-term, higher energy prices are a tax on the consumer and contributes to a drag on corporate earnings, economic growth and ultimately the market.
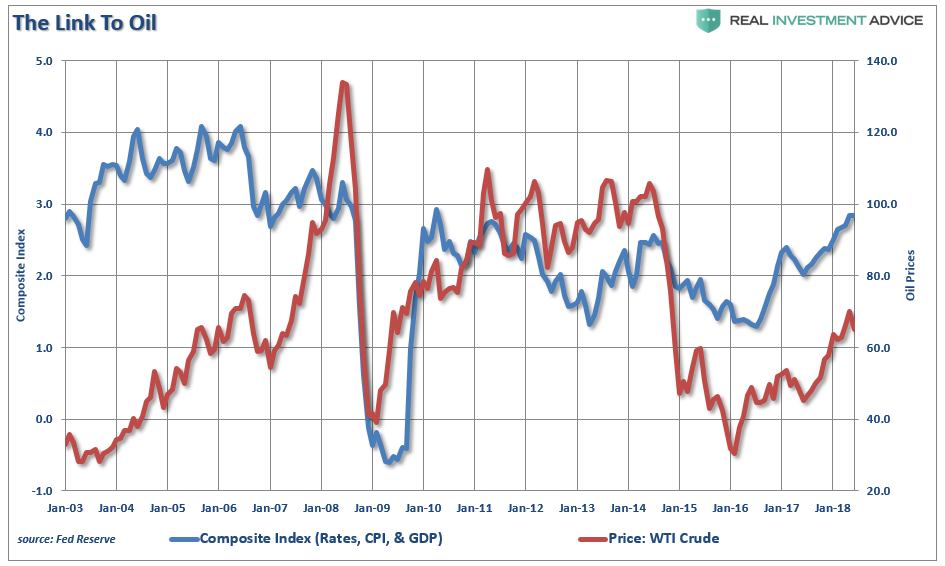
The chart below shows oil prices as compared to a composite index of real GDP, interest rates and the consumer price index (CPI). As shown, the recent uptick in economic growth, inflation, etc. coincides with the recent surge in energy prices.
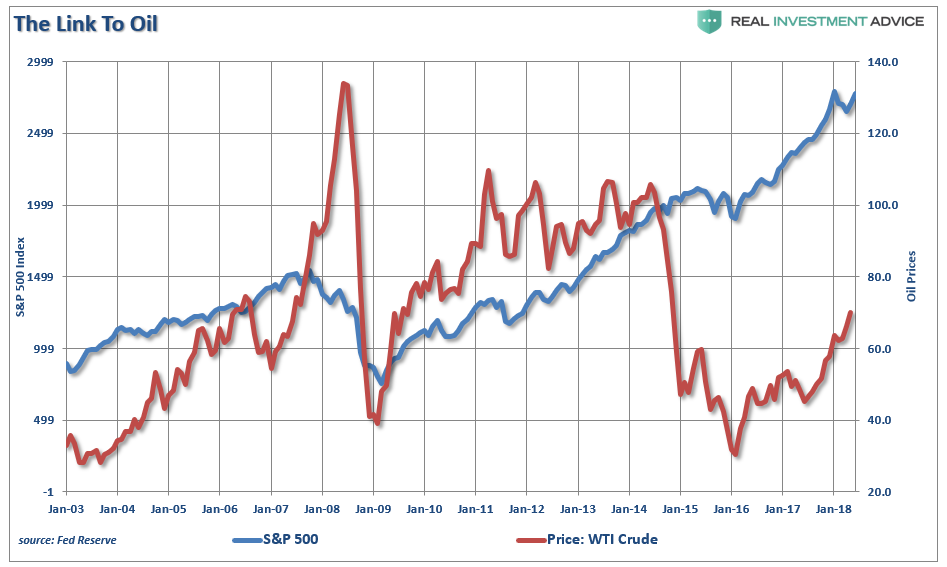
There is also a very high correlation between the direction of oil prices and the S&P 500 index. This is particularly the case since the 2016 lows as oil prices have made up a bulk of the surge in corporate earnings during that time.
There are four threats to oil prices in the near term:
- A surge in the U.S. dollar which would likely coincide with a “trade war.”
- A reversal by OPEC countries to start sharply increasing production.
- A continued surge in supply (shale) in the midst of global economic weakness.
- More rhetoric from the current Administration that “oil prices are too damn high.”
With commodities traders all crowded on the “same side of the boat” a reversal could be sharp. All that is really needed is a technical breakdown that spooks oil traders to flee for the exits. The last few times “sell signals” have been registered in combination with extreme overbought and overly exuberant positioning, the outcomes have not been good.
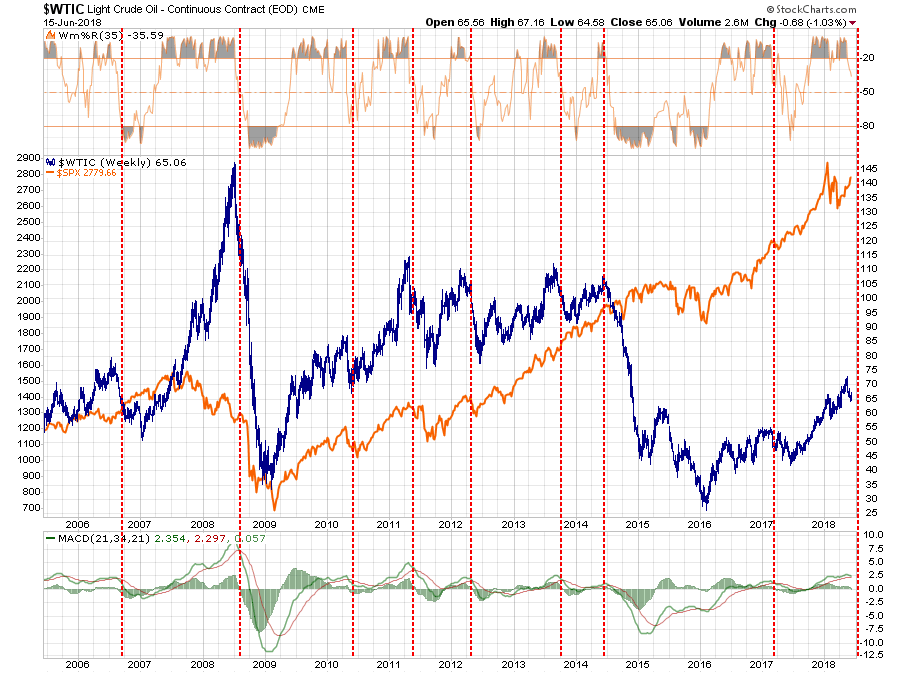
For us, oil prices are the key to watch for right now. The recent breakdown in oil prices has not accelerated to the point of concern just yet, but a break of $60/bbl is likely going to be a sign to begin de-risking portfolios.
Last week, we recommended getting an investment strategy if you don’t have one. This week, my friend Doug Kass reminds us of the timeless lessons from one of the great investors of our time.
Kass: Farrell’s 10-Investment Rules
by Doug Kass
It is time to dust off Bob’s 10 Rules of Investing:
“This tight consensus, envisioning such benign outcomes, recently moved not one, but two sage market observers — David Rosenberg, Gluskin Sheff chief economist and strategist, and Doug Kass, head of Seabreeze Partners — to invoke Rule No. 9 of Bob Farrell, Merrill Lynch’s legendary former market guru: ‘When all the forecasters and experts agree, something else is going to happen.'”
— Barron’s: “Everyone’s Optimistic About the Markets. Is It Time to Worry?“
Over the weekend, in Barron’s, I quoted my long-standing pal, “Uncle” Bob Farrell, who has written in the past about his 10 Rules of Investing.
For those that are new to the business, Bob is a Wall Street legend. A graduate of Columbia Business School who initially was fundamentally inclined, he turned to technical analysis and led Merrill Lynch’s technical analysis department for years.
His 10-Rules are an outgrowth of his long career in following the investment markets.
Here is a great summary of Bob’s rules, courtesy of StockCharts:
1. Markets tend to return to the mean over time.
Translation: Trends that get overextended in one direction or another return to their long-term average. Even during a strong uptrend or strong downtrend, prices often move back (revert) to a long-term moving average. The chart below shows the S&P 500 over a 15-year period with a 52-week exponential moving average. The blue arrows show several reversions back to this moving average in both uptrends and downtrends. The indicator window shows the Percent Price Oscillator (1,52,1) reverting back to the zero line.
2. Excesses in one direction will lead to an opposite excess in the other direction.
Translation: Markets that overshoot on the upside will also overshoot on the downside, kind of like a pendulum. The further it swings to one side, the further it rebounds to the other side. The chart below shows the Nasdaq bubble in 1999 and the Percent Price Oscillator (52,1,1) moving above 40%. This means the Nasdaq was over 40% above its 52-week moving average and way overextended. This excess gave way to a similar excess when the Nasdaq plunged in 2000-2001 and the Percent Price Oscillator moved below -40%.
3. There are no new eras — excesses are never permanent.
Translation: There will be a hot group of stocks every few years, but speculation fads do not last forever. In fact, over the last 100 years we have seen speculative bubbles involving various stock groups. Autos, radio and electricity powered the roaring 20s. The nifty-fifty powered the bull market in the early 70s. Biotechs bubble up every 10 years or so and there was the dot-com bubble in the late 90s. “This time it is different” is perhaps the most dangerous phrase in investing. As Jesse Livermore puts is:
A lesson I learned early is that there is nothing new in Wall Street. There can’t be because speculation is as old as the hills. Whatever happens in the stock market today has happened before and will happen again.
4. Exponential rapidly rising or falling markets usually go further than you think, but they do not correct by going sideways.
Translation: Even though a hot group will ultimately revert back to the mean, a strong trend can extend for a long time. Once this trend ends, however, the correction tends to be sharp. The chart below shows the Shanghai Composite ($SSEC) advancing from July 2005 until October 2007. This index was overbought in July 2006, early 2007 and mid 2007, but these levels did not mark a top as the trend extended with a parabolic move.
5. The public buys the most at the top and the least at the bottom.
Translation: The average individual investor is most bullish at market tops and most bearish at market bottoms. The survey from the American Association of Individual Investors is often cited as a barometer for investor sentiment. In theory, excessively bullish sentiment warns of a market top, while excessively bearish sentiment warns of a market bottom.
6. Fear and greed are stronger than long-term resolve.
Translation: Don’t let emotions cloud your decisions or affect your long-term plan. Plan your trade and trade your plan. Prepare for different scenarios so you will not be taken by surprise with sharp adverse price movement. Sharp declines and losses can increase the fear factor and lead to panic decisions in the heat of battle. Similarly, sharp advances and outsized gains can lead to overconfidence and deviations from the long-term plan. To paraphrase Rudyard Kipling, you will be a much better trader or investor if you can keep your head about you when all about are losing theirs. When the emotions are running high, take a breather, step back and analyze the situation from a greater distance.
7. Markets are strongest when they are broad and weakest when they narrow to a handful of blue-chip names.
Translation: Breadth is important. A rally on narrow breadth indicates limited participation and the chances of failure are above average. The market cannot continue to rally with just a few large-caps (generals) leading the way. Small and mid caps (troops) must also be on board to give the rally credibility. A rally that lifts all boats indicates far-reaching strength and increases the chances of further gains.
8. Bear markets have three stages – sharp down, reflexive rebound and a drawn-out fundamental downtrend.
Translation: Bear markets often start with a sharp and swift decline. After this decline, there is an oversold bounce that retraces a portion of that decline. The decline then continues, but at a slower and more grinding pace as the fundamentals deteriorate. Dow Theory suggests that bear markets consist of three down legs with reflexive rebounds in between.
9. When all the experts and forecasts agree – something else is going to happen.
Translation: This rule fits with Farrell’s contrarian streak. When all analysts have a buy rating on a stock, there is only one way left to go (downgrade). Excessive bullish sentiment from newsletter writers and analysts should be viewed as a warning sign. Investors should consider buying when stocks are unloved and the news is all bad. Conversely, investors should consider selling when stocks are the talk of the town and the news is all good. Such a contrarian investment strategy usually rewards patient investors.
10. Bull markets are more fun than bear markets.
Translation: Wall Street and Main Street are much more in tune with bull markets than bear markets.
Market and Sector Analysis
Data Analysis Of The Market and Sectors For Traders
S&P 500 Tear Sheet
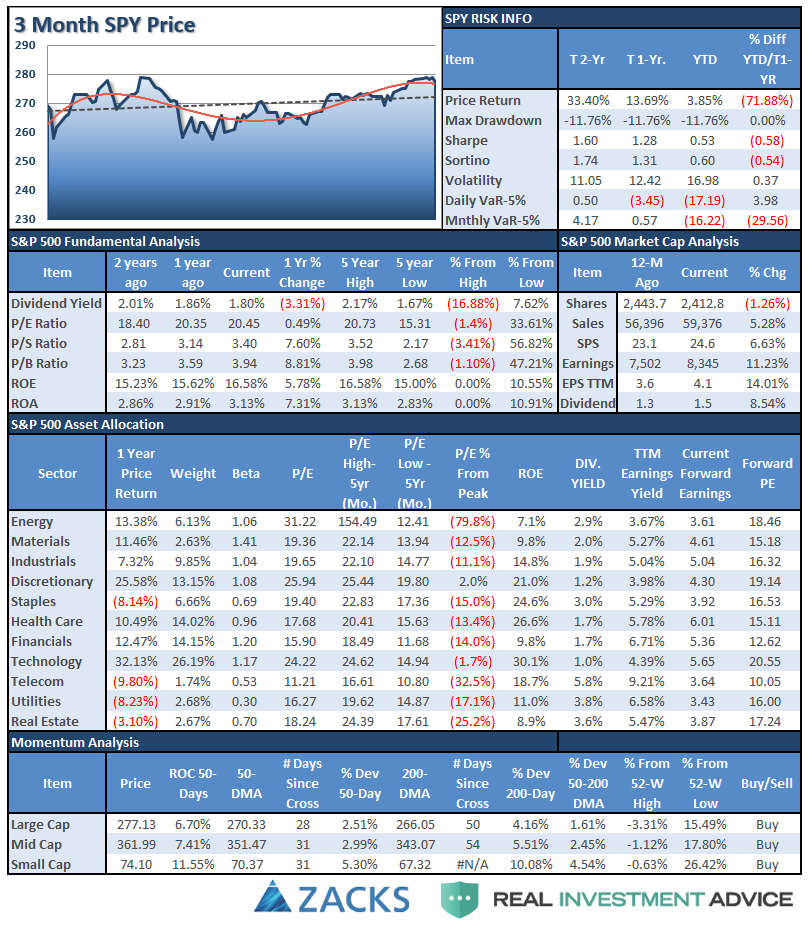
Performance Analysis
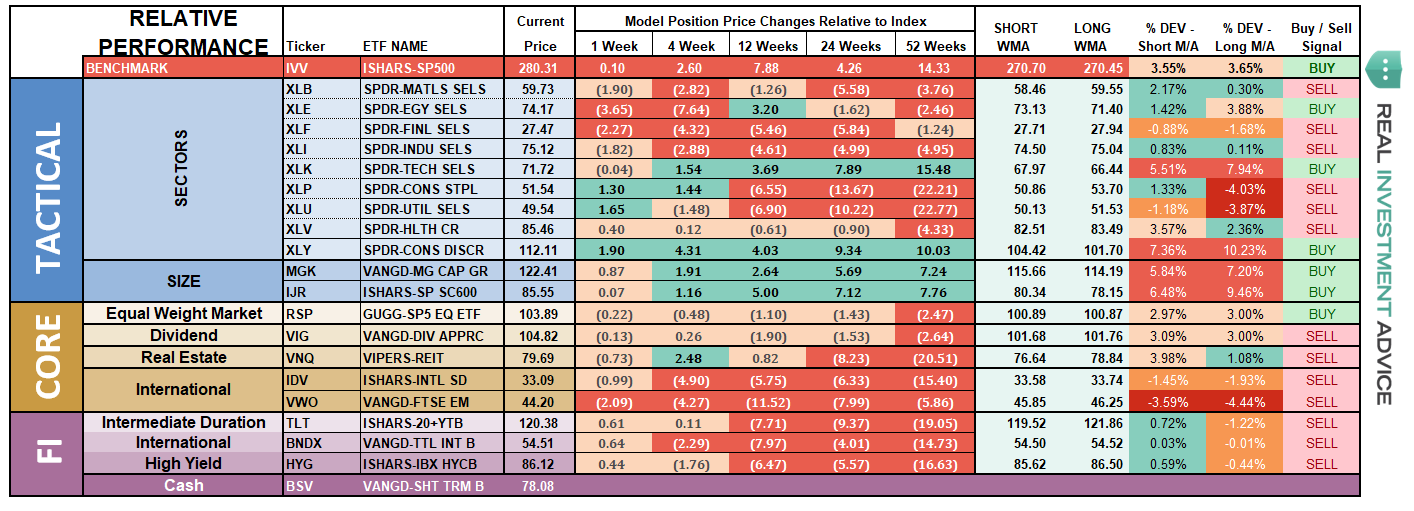
ETF Model Relative Performance Analysis
Sector and Market Analysis:
As earnings season comes to its conclusion, the market will turn its focus to the economic and geopolitical backdrop which has been a mixed bag as of late. We remain invested but our caution levels remain elevated.
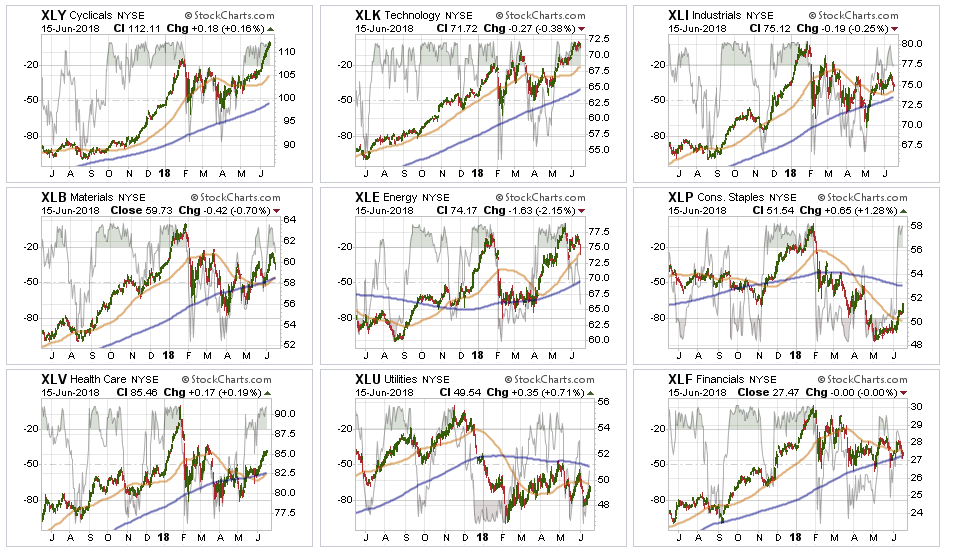
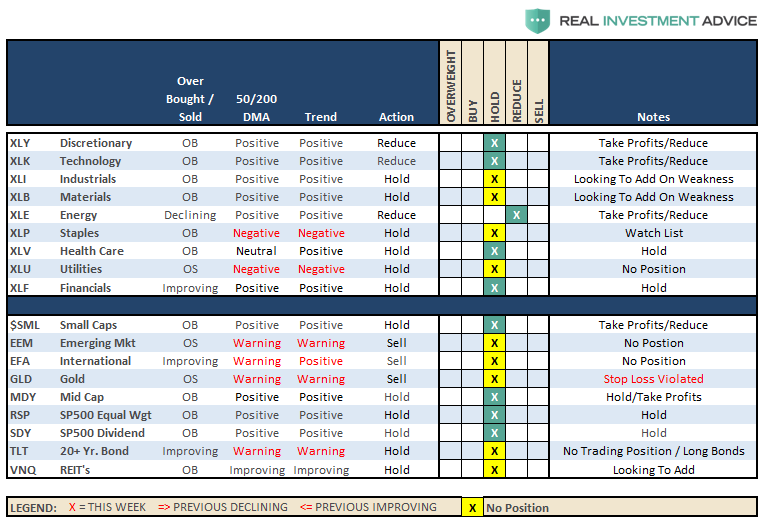
Discretionary the near vertical escalation in the discretionary sector is a result of the breakout of the consolidation we discussed three weeks ago. However, that ramp-up in prices is not healthy and with the sector extremely overbought, take profits and reduce back to portfolio weight for now. A correction is highly likely and will coincide with a broader market decline.
Technology also advanced nicely after breaking out to new highs but, like discretionary, is very overbought. Take profits and rebalance exposures here as well.
Healthcare, Staples, and Utilities also picked up in performance last week as money rotated towards very beaten up sectors in a sector rotation move. However, we will need to see some further improvement before becoming more aggressively exposed to these sectors. Remain underweight these sectors for now.
Financial, Energy, Industrial, and Materials stocks, after a brief spurt of excitement, have all slipped backward. While trends remain in place, for now, remain underweight holdings for now until performance improves.
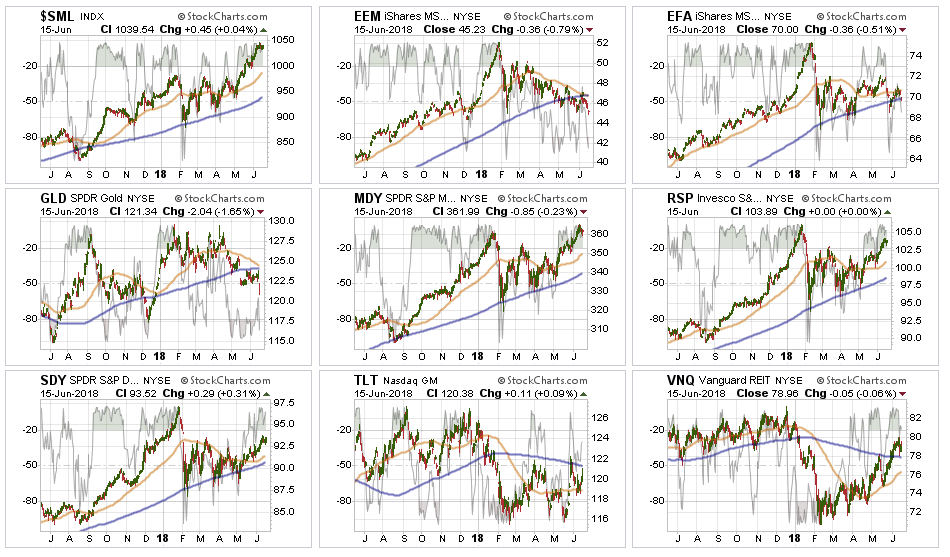
Small-Cap and Mid-Cap continue to lead performance overall. After small caps broke out of a multi-top trading range, we now need a pull-back to add further exposure. Mid-cap stocks also followed through last week breaking out to all-time highs as well. Any pullback that doesn’t violate support will also provide a better opportunity to increase exposure. After a strong push over the last few weeks, rebalance back to core weightings and look for a more opportunistic entry point in the future.
Emerging and International Markets remain lackluster in terms of performance currently. We previously removed our holdings in these markets and remain domestically focused at the moment. We will continue to monitor performance for an opportunity if it presents itself. Emerging markets, in particular, continue to lag due to a rising dollar and weak economic growth globally. Industrialized International is performing better, but not by much. Remain domestically focused to reduce the drag on overall portfolio performance.
Dividends and Equal Weight continue to hold their own and we continue to hold our allocations to these “core holdings.”
Gold we previously suggested to “Take profits on positions, and lower your stop to last week’s bottom at $122.” Again, we see no reason currently to own gold in your portfolio, however, if you do, the $122 stop was violated and all precious metals positions should be closed out for now. There is no “fear” in the financial markets currently to cause a flight to safety and the “inflation fears” are transient as they are directly tied to the surge in oil prices as noted in the main body of this missive. There will come a time to own gold, and when there is, we will add it heavily to portfolios. Now is not the time.
Bonds and REITs – Bonds continue to hold there own and remain a flight to safety when things “blow up,” as we saw with Italy recently. This is WHY we own bonds. While “exuberance” has overtaken “risk” in the short-term, the longer-term problems clearly remain. We remain out of trading positions currently, but remain long “core” bond holdings mostly in floating rate and shorter duration exposure. REIT’s are much more interesting now with a break back above their 200-dma. With the sector back on a “buy signal” short-term we will look for an opportunity to add REIT’s back into our portfolios.
The table below shows thoughts on specific actions related to the current market environment.
(These are not recommendations or solicitations to take any action. This is for informational purposes only related to market extremes and contrarian positioning within portfolios. Use at your own risk and peril.)
Portfolio/Client Update:
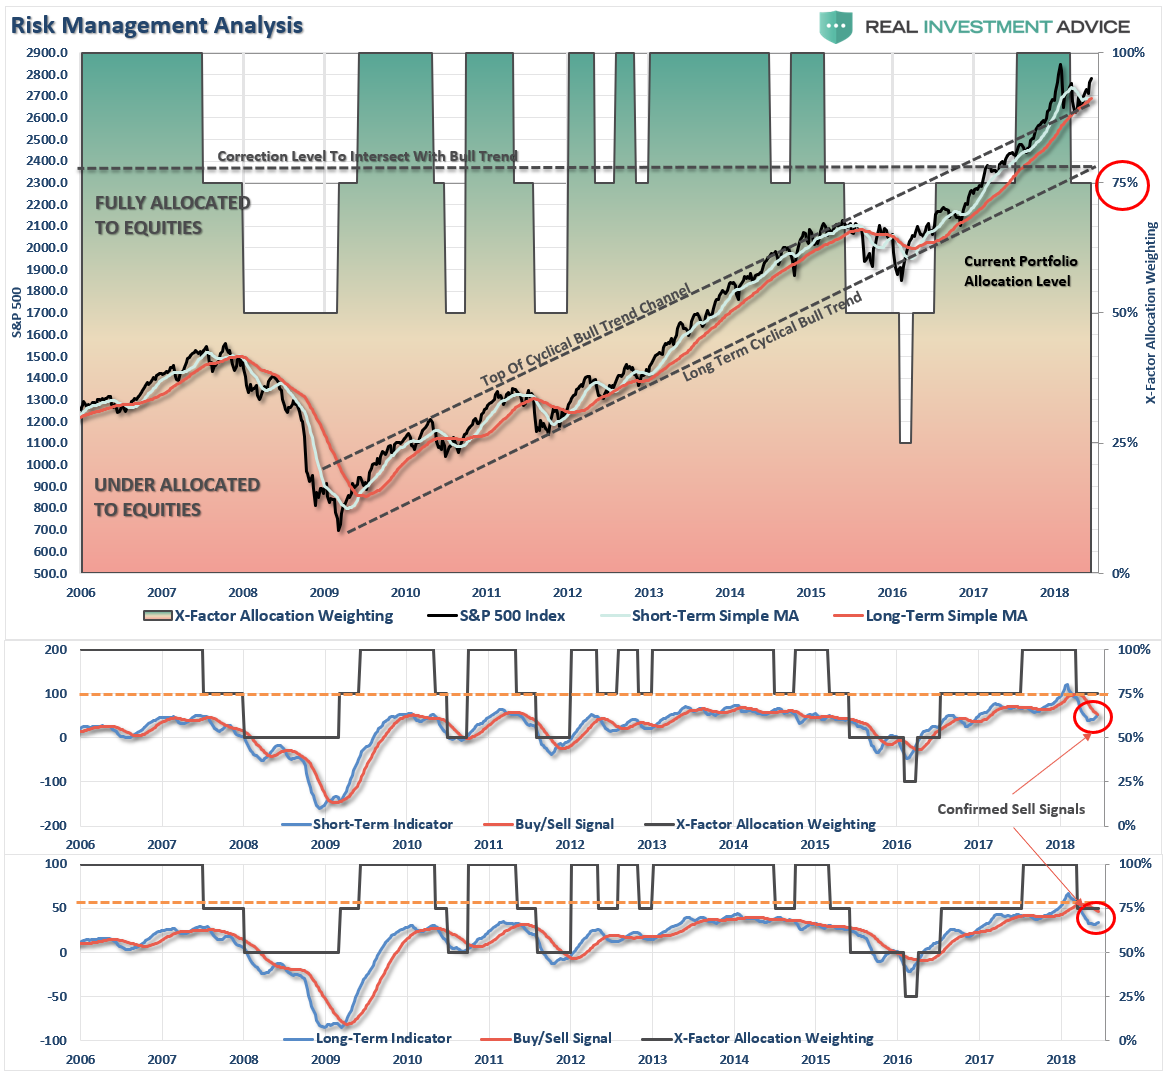
The break out of the consolidation last week provides us with the ability to opportunistically step up our equity allocations across all models. As I noted several weeks ago, we increased exposure in all models when the market initially broke out above the 100-dma. With the breakout above consolidation previously, we will now look for an entry point to add to portfolios.
- New clients: Will will look to buy 50% of target equity allocations for new clients.
- Equity Model: We previously added 50% of target allocations. Those positions will be “dollar cost averaged” opportunistically. (By the way, this is the proper way to “dollar cost average.”)
- Equity/ETF blended models will be brought closer to target allocations. We will add to “core holdings” to replace international and emerging markets deletions.
- Option-Wrapped Equity Model will be brought closer to target allocations and collars implemented.
We will do this opportunistically and continue to work to minimize risk as much as possible. While market action has improved on a short-term basis, we remain very aware of the long-term risks associated with rising rates, excessive valuations and extended cycles.
The actions we are taking currently are simply to take advantage of the current bullish reversal. We will also unwind these positions either by reducing, selling, or hedging if the market environment changes for the worse.
