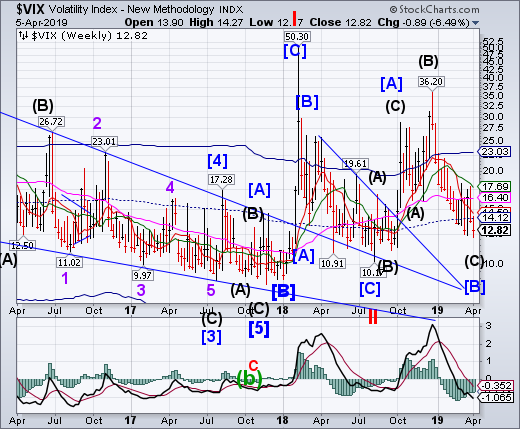
After a 2-week foray above mid-Cycle support at 14.12, VIX retreated to a new 6-month low.A buy signal may be attained above Short-term resistance at 14.58.The Cycles Model suggests a 3-week rally that may take investors by surprise.
(Bloomberg) Equity bulls cheered as the S&P 500 Index closed at its highest since October, but there may still be a small fly in the ointment -- volatility. The Cboe Volatility Index has yet to confirm the equity rally as it hasn’t formed a lower low to match the U.S. stock benchmark’s higher high, according to Tom McClellan, editor of the McClellan Market Report . While it shouldn’t be too difficult for the VIX to move lower, this type of divergence doesn’t come along very often and can be “problematic,” he wrote.
SPX consolidates beneath a lower high.
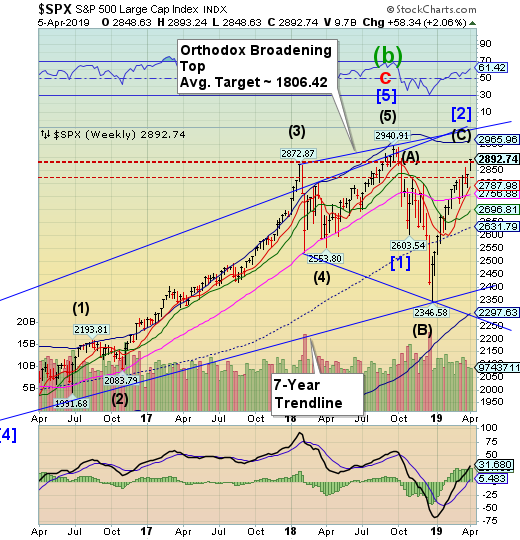
S&P 500 may be making a final exhaustion rally by challenging the January 26, 2018 high. In doing so, this top may be referred to as “Point 5” in the Orthodox Broadening Top formation. “Point 6” lies beneath the December 26 low.
(BostonHerald) Wall Street closed out another solid week of gains Friday as the stock market hit its longest winning streak in a year and a half.
Health care, energy and technology companies accounted for much of the broad rally, which extended the S&P 500’s consecutive run of gains to seven days. The benchmark index also ended the week with its second straight weekly gain. Small company stocks did better than the rest of the market.
A strong rebound in hiring, which eased worries that the U.S. economy is slowing too sharply, helped put traders in a buying mood.
NDX retraces 94% of last year’s decline.
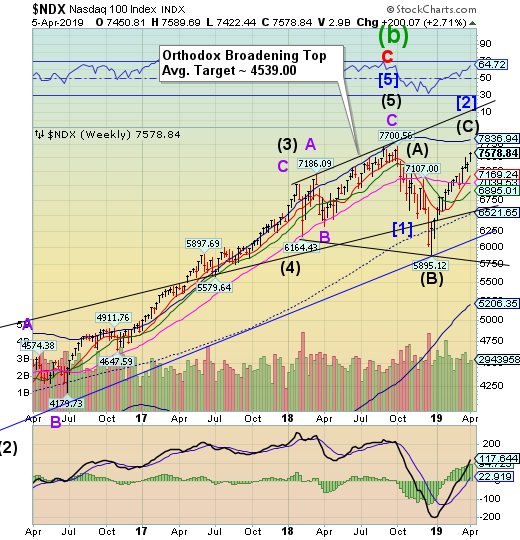
Nasdaq 100has also arrived at a potential “point 5” of an Orthodox Broadening Top formation. Be aware that this formation occurs at a Primary Degree level which involves some very large moves, as we have already seen.Asell signal awaits beneath Short-term support at 7169.24.
(Bloomberg) Technology stocks have reclaimed record highs, making them one of the first groups to put last year’s carnage behind them. But everywhere else you look in the industry, bad news is overwhelming the good.
Profits are shrinking at an alarming pace, valuations are reflating and politicians want to break the companies up. Semiconductor orders have slumped, and spending on infrastructure to support the cloud is off. And yet the addiction won’t break. Shares are up more than 30 percent since Christmas.
High Yield Bond Index makes an “exhaustion” peak.
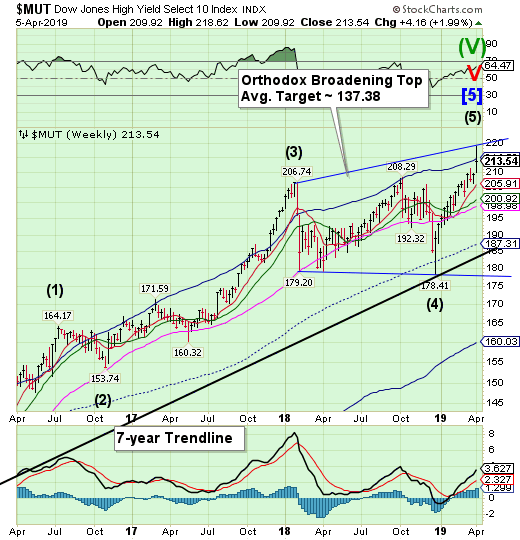
The High Yield Bond Index made a new all-time high, but could not maintain it, closing beneath its Cycle Top resistance.This completes a probable point 5 of an Orthodox Broadening Top. Point 6 may be the Cycle Bottom at 160.03. The Cycles Model warns of a probable month-long decline to follow.
(Bloomberg) One night in 1982, a group of bankers from Drexel Burnham Lambert gathered at the Quilted Giraffe, a nouvelle cuisine restaurant in New York frequented by Warren Beatty and Jackie Onassis.
The financiers were there to celebrate a junk-bond deal that got away. They’d worked with Sparkman Energy Corp. for months, but the natural gas pipeline company had stopped returning their calls. Contractual terms that Drexel was proposing for the bond, particularly investor protections known as covenants, had been deemed too strict, says Vince Pisano, an attorney who worked on the deal.
Treasuries pull back at a Fibonacci level.
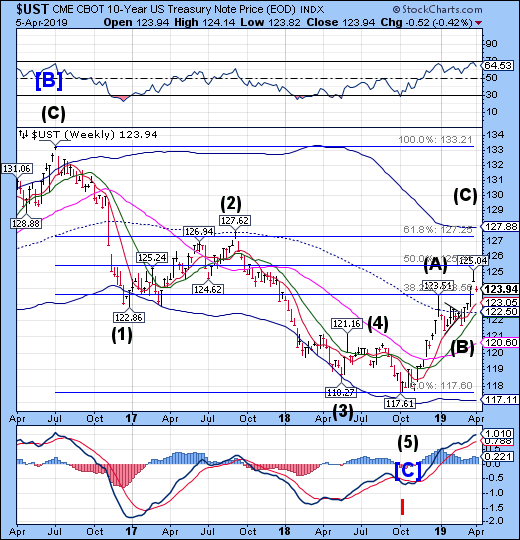
The 10-Year Treasury Note Indextested the 50% Fibonacci retracement level at 125.41, then pulled back.That said, it remains on a buy signal with a potential target at the Cycle Top resistance at 127.88. The Cycles Model suggests a continued rally through mid-April.
(Bloomberg) The bond market remains confident after the latest U.S. jobs data that the Federal Reserve’s next move will likely be to lower rates. But traders are scratching their heads when it comes to President Donald Trump’s suggestion that policy makers should restore quantitative easing.
Traders see about a 70 percent chance of a quarter-point Fed cut in 2019, even as a report Friday showed U.S. hiring in March rebounded more than analysts expected. But that doesn’t mean the market views the economy as weak enough to justify Trump’s call less than two hours later for the Fed to open the monetary floodgates.
The Euro makes a potential low.
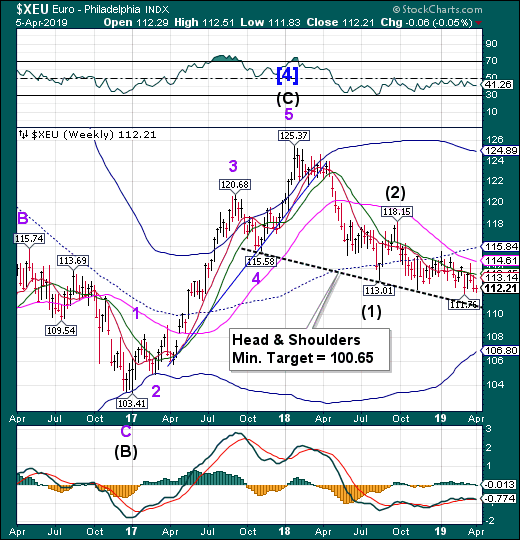
The euro may have reached a Master Cycle low last week. However, the Cycles Model does not support at rally at this time, suggesting a more extensive decline. This favors the Master Cycle low being extended up to two weeks.
(Reuters) - The euro will rebound from its worst start to a year since 2015 to gain over the coming 12 months, according to a Reuters poll of analysts, although they warned that risks to that view were skewed to the downside.
Having lost nearly 4.5 percent against the dollar in 2018, the euro has not fared any better so far this year, falling more than 2 percent in January-March — its worst first-quarter performance in four years.
That was mostly driven by weak growth and inflation prospects for the region, which pushed the European Central Bank to rule out any rate hikes this year and announce new long-term cheap loans, known as TLTROs.
EuroStoxx challenges mid-Cycle Resistance.
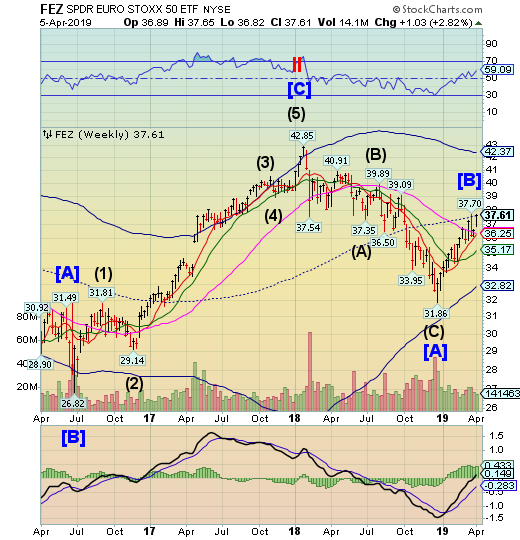
Note: StockCharts.com is not displaying the Euro Stoxx 50 Index at this time.
The EuroStoxx50 SPDRchallenged mid-Cycle resistance at 37.59, but closed beneath it and its March 20 high as well.A failure to make a new high is telling. The Cycles Model suggests a month of decline may lie ahead.
(Reuters) - European shares snapped a four session winning run on Thursday, as bank stocks drew close attention after sources said Italy’s UniCredit was interested in buying Germany’s Commerzbank (DE:CBKG).
The pan-European STOXX 600 index fell 0.3 percent, as most sectors ended in negative territory, giving back a sliver of the 3.2 percent gained largely on strong Chinese economic data and hopes of a U.S.-China trade deal during the past four sessions.
Banking stocks were among the rare gainers on the day with a 0.2 percent rise.
.The Yencloses beneath Long-term support.
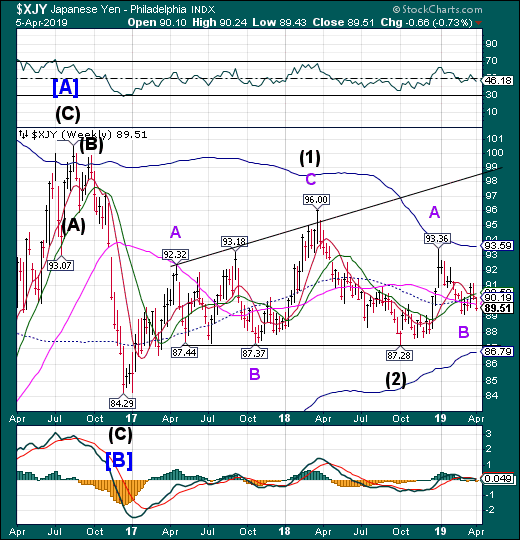
The Yenpulled back beneath Long-term support at 89.81 to make a new Master Cycle low on Friday as mentioned last week.While making it difficult for the recent investors, the structure of the uptrend has not been violated. The Cycles Model suggests a rally in strength through the end of April.
(Bloomberg) Bank of Japan Governor Haruhiko Kuroda’s epic challenge has been as much about changing the way people think as it has been the intricacies of interest rates and the money supply.
So one assumes it had to sting a little when the central bank’s latest quarterly survey of households found that 50 percent of respondents "have never heard of" Kuroda’s historic monetary stimulus program. That’s the highest level since the question was introduced in September 2013, six months after Kuroda took over at the BOJ.
It might help explain why Kuroda’s goal of uprooting Japan’s deflationary mindset isn’t exactly going according to plan. Kuroda has repeatedly said in recent years those expectations have proved more entrenched than he first thought.
Nikkei glances off Long-term resistance.
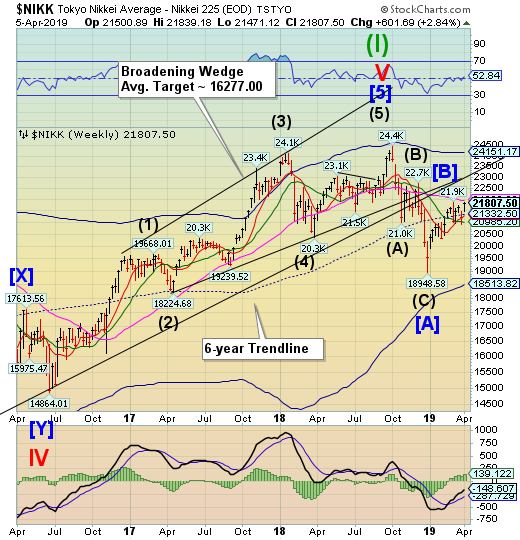
The Nikkei glanced off Long-term resistance at 21968.02, closing beneath it and failing to test the March 4 high at 21860.39. This may indicate maximum resistance.The Nikkei may quickly decline back beneath mid-Cycle support at 21332.50, creating a sell signal.
(ZeroHedge) In recent years, thanks to central bank intervention in virtually every asset class, writing about capital markets in the context of some valuation or fundamental analysis framework has become a laughable, surreal, and self-defeating exercise, and here is a perfect example why.
For one reason or another, overseas investors dumped the most Japanese stocks in 31 years in the fiscal year ended Sunday, according to official market data: specifically, market participants abroad unloaded about 5.63 trillion yen ($50 billion) worth of shares on a net basis, the Tokyo Stock Exchange reported Thursday, for a second straight year of net selling and the highest sell-off since 1987.
And yet this barely caused a ripple in asset prices for one simple reason: the Bank of Japan's asset purchases absorbed all the bleeding, exposing the central bank's outsize role in the market. Indeed, as the Nikkei adds, this near-record liquidation was matched nearly yen for yen by the BOJ's pumping of money into the economy through asset purchases, with the central bank buying 5.65 trillion yen worth of equity!
.U.S. Dollarretraces 77% of its losses.
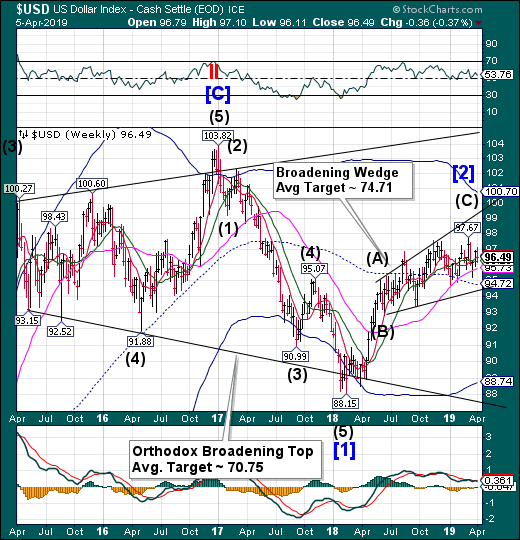
USDretreated after retracing 77% of its recent decline, closing just beneath Short-term support at 96.53.A continued decline may bring a sell signal to the USD.Once back beneath Intermediate-term support/resistance at 96.23, it may confirmthe sell signal.
(Bloomberg) The best days for the dollar this year are over, according to MorganStanley.
The greenback is poised to weaken 6 percent through year-end as slowing relative U.S. growth and a dovish Federal Reserve weigh on the world’s biggest reserve currency, strategists led by Hans Redeker wrote in a note Tuesday.
Reserves held in U.S. dollars fell to $6.62 trillion, or 61.69 percent of allocated reserves, in the fourth quarter, from $6.63 trillion, or 61.94 percent, in the third quarter.
Gold on a sell signal.
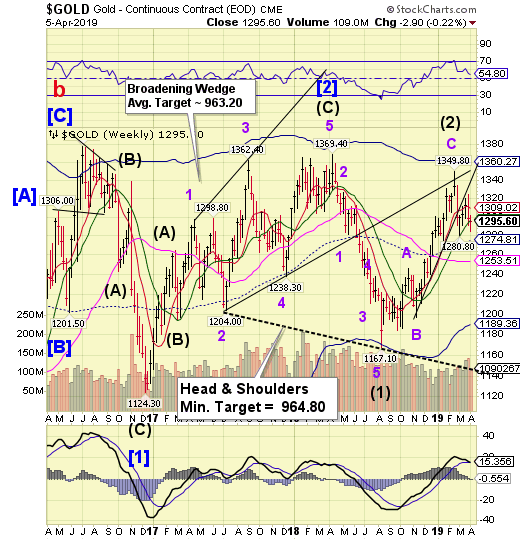
Goldtested the rising trendline but reversed to challenge Intermediate-term support at 1294.05, closing above it.The Cycles Model suggests there may bea probable month of decline ahead.The Head & Shoulders formation matches targets with the already existent Broadening Wedge formation.
(CNBC) Gold eased on Friday as Wall Street gained on data pointing to a rebound in jobs growth in the United States, but bullion’s losses were limited by a simultaneous slowdown in wage growth.
Spot gold slipped 0.2 percent to $1,289.61 per ounce, after touching its lowest since Jan. 25 at $1,280.59 on Thursday. The metal was down about 0.1 percent so far for the week.
Cruderetraces nearly 61% of its losses.
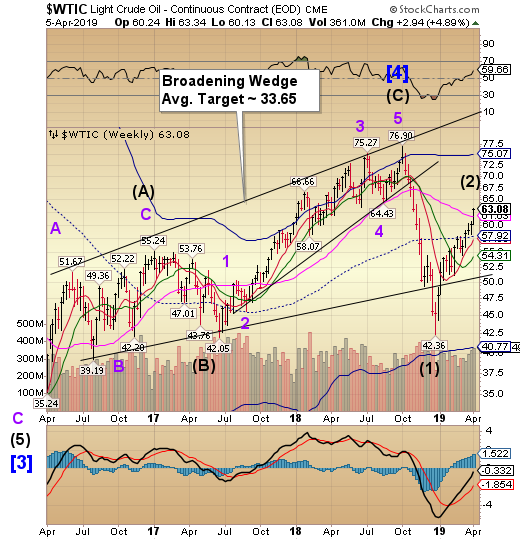
Crudemade a new retracement high, retracing nearly 61% of its losses in 2018.However, the Cycles Model suggests this is a bear market rally.Excitement among investors is peaking. The reversal is overdue…
(CNBC) Oil prices rose more than 1 percent on Friday on bullish U.S. employment data that tempered fears about a decline in global crude demand and on expectations that an escalating conflict in Libya could tighten oil supplies.
settled 98 cents higher at $63.11 a barrel on Friday, rising 1.6% to a new five-month closing high. WTI posted its fifth consecutive weekly gain, rising 4.9% over the last five days.
Brent crude futures rose 94 cents, or 1.4%, to $70.34 a barrel, marking the first time the international benchmark has settled above $70 in five months. Brent finished the week 2.9% higher.
Both contracts hit new five-month highs after Friday’s settle.
Shanghai Index 100 points above Fibonacci level.
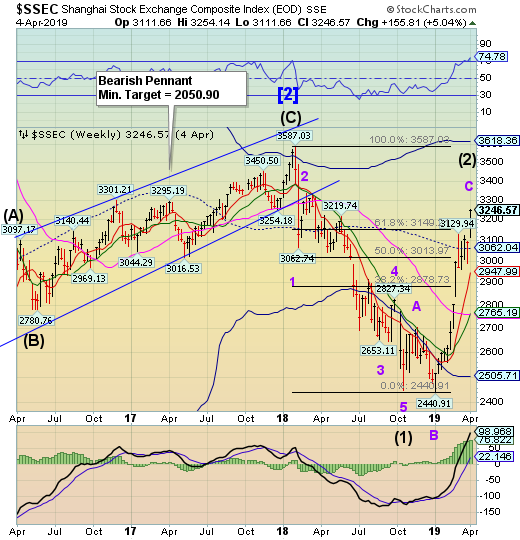
The Shanghai Indexsmashed 100 points above the 61.8% Fibonacci level at 3149.21.This move may have been aided by Cyclical strength that may be exhausted over the weekend.A decline back beneath 3062.04 may give a sell signal that may last up to two months.
(IBD) China stocks are coming back from a dismal 2018, during which the biggest ETFs tracking Chinese equities lost between 11% and 36%.
Worries about the country's economy, as well as the U.S.-China trade war, were among chief reasons for the declines. But some of those concerns have faded as China delivered bullish data for March, and the two countries appear close to striking a trade deal.
On April 1, China's official manufacturing purchasing managers index for March climbed to 50.8 from 49.9. That marked the first increase in four months, sparking a 2.6% jump in both the Shanghai Composite and the Shanghai Shenzhen CSI 300, which tracks China A-share stocks. The Shanghai Composite hit a 10-month high and the CSI 300, a one-year high.
The Banking Indexstalls at Short-term resistance.
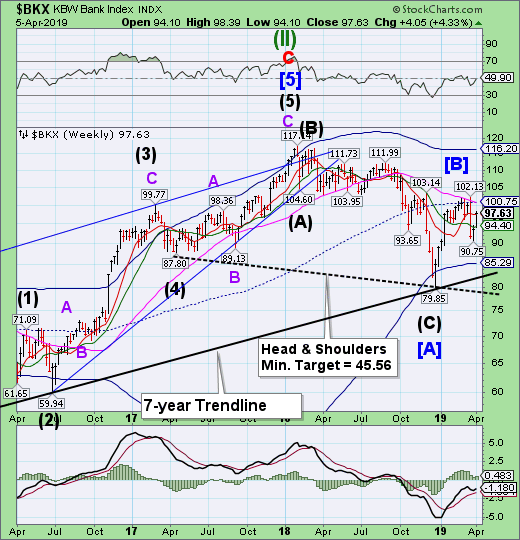
--BKX continued its rally, challenging Short-term resistance 97.36,closing above it. The retracement appears to be capped at 67%. The Cycles Model suggests a probable 5 weeks of decline.
(MetroUSA) Investors will focus on falling profits, a more dovish Federal Reserve and lower interest rates as major U.S. banks kick off what analysts expect to be the first quarter of contracting corporate earnings since 2016.
On Friday, April 12, JPMorgan Chase & Co (NYSE:JPM) and Wells Fargo (NYSE:WFC) & Co will post results to begin the earnings season in earnest. Citigroup Inc (NYSE:C) and Goldman Sachs Group Inc (NYSE:GS) will report the following Monday, followed by Bank of America Corp (NYSE:BAC) and Morgan Stanley (NYSE:MS) on Tuesday.
In the wake of the Federal Reserve's cautious shift due to signs of softness in the U.S. economy and the subsequent drop in 10-year Treasury yields, S&P 500 banks are seen posting year-on-year first-quarter earnings growth of 2.3%, down from 8.2% forecast six months ago, according to Refinitiv data.
