- English (UK)
- English (India)
- English (Canada)
- English (Australia)
- English (South Africa)
- English (Philippines)
- English (Nigeria)
- Deutsch
- Español (España)
- Español (México)
- Français
- Italiano
- Nederlands
- Polski
- Português (Portugal)
- Português (Brasil)
- Русский
- Türkçe
- العربية
- Ελληνικά
- Svenska
- Suomi
- עברית
- 日本語
- 한국어
- 简体中文
- 繁體中文
- Bahasa Indonesia
- Bahasa Melayu
- ไทย
- Tiếng Việt
- हिंदी
Scidev Ltd (SDV)
Scidev Ltd stock price live, this page displays ASX SDV stock exchange data. View the SDV premarket stock price ahead of the market session or assess the after hours quote. Monitor the latest movements within the Scidev Ltd real time stock price chart below.
What Is the Scidev Ltd Stock Price Today?
The Scidev Ltd stock price today is 0.130.
What Is the Stock Symbol for Scidev Ltd?
The stock ticker symbol for Scidev Ltd is SDV.
Is SDV the Same as $SDV?
$SDV is a common way to refer to the Scidev Ltd ticker symbol in social media, forums, and online discussions. The dollar sign is a shorthand convention used to indicate that it is a stock ticker symbol
What Stock Exchange Does Scidev Ltd Trade On?
Scidev Ltd is listed and trades on the Sydney stock exchange.
Is Scidev Ltd a Good Stock to Buy?
Determining whether Scidev Ltd—or any stock—is a good buy requires comprehensive analysis. To evaluate its potential, users can sign up to InvestingPro, where they can assess the current Scidev Ltd share price compared with the fair value and other essential metrics.
You can find more details by visiting the additional pages to view historical data, charts, latest news, analysis or visit the forum to view opinions on the SDV quote. (ISIN: AU000000SDV5)
0.130
-0.005(-3.70%)
Delayed Data·
Fair Value
An estimate of a stock's true price based on valuation models like discounted cash flow, peer valuation multiples, and dividend discount models.
Day's Range
0.130
0.130
52 wk Range
0.086
0.510
SDV is not included in our AI-picked strategies. See which stocks are.
Fair Value
An estimate of a stock's true price based on valuation models like discounted cash flow, peer valuation multiples, and dividend discount models.
Day's Range
0.1300.130
52 wk Range
0.0860.510
Key Statistics
Edit
Prev. Close
Open
Volume
Average Vol. (3m)
1-Year Change
Fair Value
Fair Value Upside
Market Cap
Shares Outstanding
Revenue
Net Income
EPS
EPS Growth Forecast
Next Earnings Date
N/A
(N/A)
Dividends Payment Streak
P/E Ratio
Return on Assets
Return on Equity
Gross Profit Margin
Price/Book
EBITDA
EV/EBITDA
Beta
Book Value / Share
SDV Scorecard
Company’s Health
Assesses a company's financial position by analyzing its market value, financial ratios, industry benchmarks, and competitors.
UnlockFair Value
An estimate of a stock's true price based on valuation models like discounted cash flow, peer valuation multiples, and dividend discount models.
Unlock PriceTechnical Analysis
Neutral
Price Target
0.300
Upside
+130.77%
Members' Sentiments
Bearish
Bullish
ProTips
Tips that distill complex financial data into concise, actionable investment insights.
Trading at a low revenue valuation multiple
Technical Analysis
Summary
Strong Sell
Sell
Neutral
Buy
Strong Buy
Strong Sell
Technical Indicators
Strong Sell
Moving Averages
Sell
Analyst Ratings
1 Buy
0 Hold
0 Sell
Ratings:
1 analysts
Overall Consensus
Buy
Analysts 12-Month Price Target:
Average 0.300
(+130.77% Upside)
Scidev Ltd Earnings Call Summary for H1/2026
- SciDev revenue declined 4% YoY to AUD 47.9M in H1 FY2026; underlying EBITDA reached AUD 1.1M amid energy services disruption.
- Energy division suffered AUD 3.6M EBITDA hit from key customer's frack schedule delays; stock plunged 31.88% post-announcement.
- Process Chemistry division surged 16% in revenue and 58% in EBITDA, driven by multi-year tunneling and infrastructure contracts.
- Company implemented AUD 700K cost reductions; recurring revenue now represents 54% of total, up from previous periods.
- Management expects positive Q2 cash flow trend to continue in H2; Rum Jungle project to deliver majority of contract value next half.
Last Updated: 02/25/2026, 05:38 PM
Read Full TranscriptScidev investor slides for H1/2026
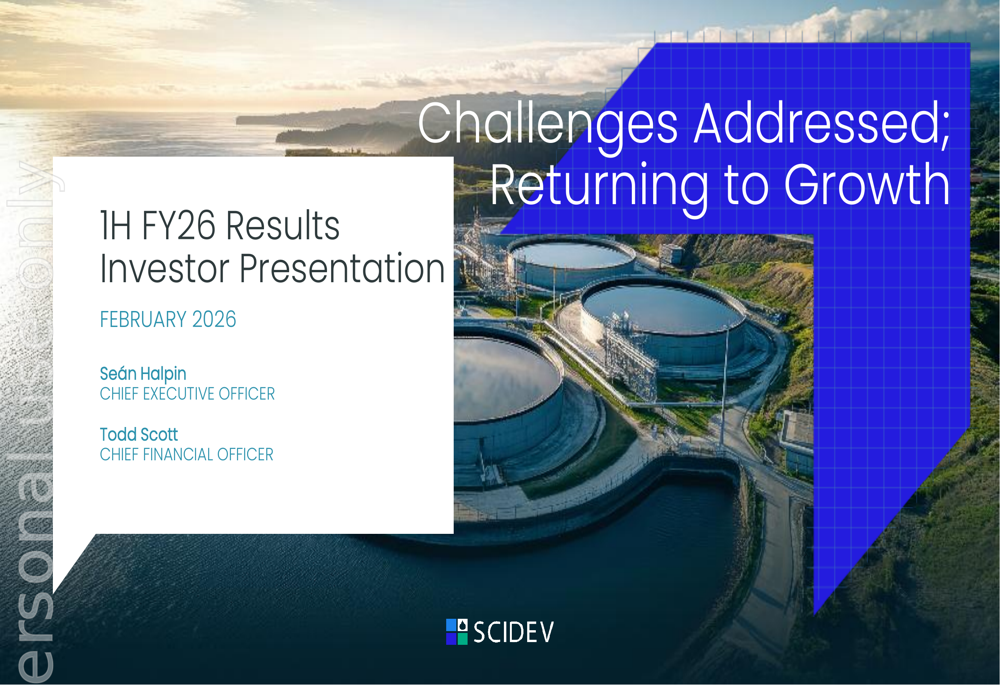
Last Update: Feb 25, 2026
See full investor slides
Earnings
Latest Release
Apr 19, 2026
EPS / Forecast
-- / --
Revenue / Forecast
18.5M / --
Compare SDV to Peers and Sector
Metrics to compare | SDV | Sector Sector - Average of metrics from a broad group of related Industrials sector companies | Relationship RelationshipSDVPeersSector | |
|---|---|---|---|---|
P/E Ratio | −8.7x | −5.3x | 3.6x | |
PEG Ratio | 0.03 | −0.13 | 0.00 | |
Price / Book | 0.5x | 2.9x | 1.6x | |
Price / LTM Sales | 0.3x | 2.2x | 1.3x | |
Upside (Analyst Target) | 122.2% | 31.3% | 41.7% | |
Fair Value Upside | Unlock | −15.3% | 2.6% | Unlock |
SciDev Limited engages in the provision of environmental solutions focused on water intensive industries in Australia, the United States, Asia, and internationally. The company operates in two segments, Chemical Services and Water Technologies. It develops, manufactures, and supplies proprietary chemicals, including natural and synthetic polymers for flocculation, filtration, sludge dewatering, friction reduction, shale inhibition, rheology control, and pipe-on-pipe lubrication applications; flocculants and coagulants; and provides services, such as design and engineering, process optimization, specialty chemical fluid formulations, and application equipment, as well as project management services. The company also offers water treatment technologies comprising water treatment for mobile, temporary, and permanent treatment systems; PFAS treatment solutions; onsite liquid waste treatment services; and water quality monitoring systems. It serves its products to mining and minerals processing, wastewater treatment, construction and infrastructure, oil and gas, and remediation markets. The company was formerly known as Intec Limited and changed its name to SciDev Limited in March 2017. SciDev Limited was incorporated in 1973 and is based in Sydney, Australia.
Ownership
Ownership Overview
Top Holders
FAQ
What Is the Scidev (SDV) Stock Price Today?
The Scidev stock price today is 0.130 AUD.
What Stock Exchange Does Scidev Trade On?
Scidev is listed and trades on the Sydney Stock Exchange.
What Is the Stock Symbol for Scidev?
The stock symbol for Scidev is "SDV."
What Is the Scidev Market Cap?
As of today, Scidev market cap is 24.710M AUD.
What Is Scidev's Earnings Per Share (TTM)?
The Scidev EPS (TTM) is -0.016.
When Is the Next Scidev Earnings Date?
Scidev will release its next earnings report on Sep 01, 2026.
From a Technical Analysis Perspective, Is SDV a Buy or Sell?
Based on moving averages and other technical indicators, the daily buy/sell signal is Neutral.
How Many Times Has Scidev Stock Split?
Scidev has split 4 times.
How Many Employees Does Scidev Have?
Scidev has 22 employees.
What is the current trading status of Scidev (SDV)?
As of Jul 13, 2026, Scidev (SDV) is trading at a price of 0.130 AUD, with a previous close of 0.135 AUD. The stock has fluctuated within a day range of 0.130 AUD to 0.130 AUD, while its 52-week range spans from 0.086 AUD to 0.510 AUD.
What Is Scidev (SDV) Price Target According to Analysts?
The average 12-month price target for Scidev is 0.300 AUD, with a high estimate of 0.3 AUD and a low estimate of 0.3 AUD. 1 analysts recommend buying the stock, while 0 suggest selling, leading to an overall rating of Buy. The stock has an +130.77% Upside potential.
Industry Spotlight
Risk Disclosure: Trading in financial instruments and/or cryptocurrencies involves high risks including the risk of losing some, or all, of your investment amount, and may not be suitable for all investors. Prices of cryptocurrencies are extremely volatile and may be affected by external factors such as financial, regulatory or political events. Trading on margin increases the financial risks.
Before deciding to trade in financial instrument or cryptocurrencies you should be fully informed of the risks and costs associated with trading the financial markets, carefully consider your investment objectives, level of experience, and risk appetite, and seek professional advice where needed.
Fusion Media would like to remind you that the data contained in this website is not necessarily real-time nor accurate. The data and prices on the website are not necessarily provided by any market or exchange, but may be provided by market makers, and so prices may not be accurate and may differ from the actual price at any given market, meaning prices are indicative and not appropriate for trading purposes. Fusion Media and any provider of the data contained in this website will not accept liability for any loss or damage as a result of your trading, or your reliance on the information contained within this website.
It is prohibited to use, store, reproduce, display, modify, transmit or distribute the data contained in this website without the explicit prior written permission of Fusion Media and/or the data provider. All intellectual property rights are reserved by the providers and/or the exchange providing the data contained in this website.
Fusion Media may be compensated by the advertisers that appear on the website, based on your interaction with the advertisements or advertisers.
© 2007-2026 - Fusion Media Limited. All Rights Reserved.