- English (UK)
- English (India)
- English (Canada)
- English (Australia)
- English (South Africa)
- English (Philippines)
- English (Nigeria)
- Deutsch
- Español (España)
- Español (México)
- Français
- Italiano
- Nederlands
- Polski
- Português (Portugal)
- Português (Brasil)
- Русский
- Türkçe
- العربية
- Ελληνικά
- Svenska
- Suomi
- עברית
- 日本語
- 한국어
- 简体中文
- 繁體中文
- Bahasa Indonesia
- Bahasa Melayu
- ไทย
- Tiếng Việt
- हिंदी

Fertiglobe PLC (FERTIGLB)
Fertiglobe PLC stock price live, this page displays ADX FERTIGLB stock exchange data. View the FERTIGLB premarket stock price ahead of the market session or assess the after hours quote. Monitor the latest movements within the Fertiglobe PLC real time stock price chart below.
What Is the Fertiglobe PLC Stock Price Today?
The Fertiglobe PLC stock price today is 2.65.
What Is the Stock Symbol for Fertiglobe PLC?
The stock ticker symbol for Fertiglobe PLC is FERTIGLB.
Is FERTIGLB the Same as $FERTIGLB?
$FERTIGLB is a common way to refer to the Fertiglobe PLC ticker symbol in social media, forums, and online discussions. The dollar sign is a shorthand convention used to indicate that it is a stock ticker symbol
What Stock Exchange Does Fertiglobe PLC Trade On?
Fertiglobe PLC is listed and trades on the Abu Dhabi stock exchange.
Is Fertiglobe PLC a Good Stock to Buy?
Determining whether Fertiglobe PLC—or any stock—is a good buy requires comprehensive analysis. To evaluate its potential, users can sign up to InvestingPro, where they can assess the current Fertiglobe PLC share price compared with the fair value and other essential metrics.
You can find more details by visiting the additional pages to view historical data, charts, latest news, analysis or visit the forum to view opinions on the FERTIGLB quote. (ISIN: AEF000901015)
2.65
-0.01(-0.38%)
Closed·
Fair Value
An estimate of a stock's true price based on valuation models like discounted cash flow, peer valuation multiples, and dividend discount models.
Day's Range
2.63
2.67
52 wk Range
2.35
3.85
Earnings results expected in 8 days
1/3
Fair Value
An estimate of a stock's true price based on valuation models like discounted cash flow, peer valuation multiples, and dividend discount models.
Day's Range
2.632.67
52 wk Range
2.353.85
Key Statistics
Edit
Prev. Close
Open
Volume
Average Vol. (3m)
1-Year Change
Book Value / Share
Fair Value
Fair Value Upside
Market Cap
Shares Outstanding
Revenue
Net Income
EPS
EPS Growth Forecast
Next Earnings Date
(8.04%)
Dividends Payment Streak
P/E Ratio
Return on Assets
Return on Equity
Gross Profit Margin
Price/Book
EBITDA
EV/EBITDA
Beta
FERTIGLB Scorecard
Company’s Health
Assesses a company's financial position by analyzing its market value, financial ratios, industry benchmarks, and competitors.
UnlockFair Value
An estimate of a stock's true price based on valuation models like discounted cash flow, peer valuation multiples, and dividend discount models.
Unlock PriceTechnical Analysis
Strong Sell
Price Target
3.62
Upside
+36.62%
Members' Sentiments
Bearish
Bullish
ProTips
Tips that distill complex financial data into concise, actionable investment insights.
Management has been aggressively buying back shares
Analyst Ratings
11 Buy
3 Hold
0 Sell
Ratings:
14 analysts
Overall Consensus
Buy
Analysts 12-Month Price Target:
Average 3.62
(+36.62% Upside)
Fertiglobe PLC Earnings Call Summary for Q1/2026
- Fertiglobe Q1 2026 revenue surged 32% YoY to $915M; adjusted net profit nearly doubled to $145M amid higher urea and ammonia prices.
- Adjusted EBITDA rose 31% to $342M; net debt decreased to $822M from $1.006B at end of 2025, strengthening balance sheet position.
- Stock climbed 1.54% to $2.16 post-earnings, reflecting investor confidence in company's ability to navigate geopolitical disruptions.
- Company expects sustained revenue momentum in 2026, focusing on cost optimization and digital tools to enhance operational efficiency.
- CEO emphasized strategic resilience amid Middle East tensions; management committed to exploring alternative trade routes for consistent supply.
Last Updated: 04/29/2026, 08:12 AM
Read Full TranscriptFertiglobe investor slides for Q1/2026
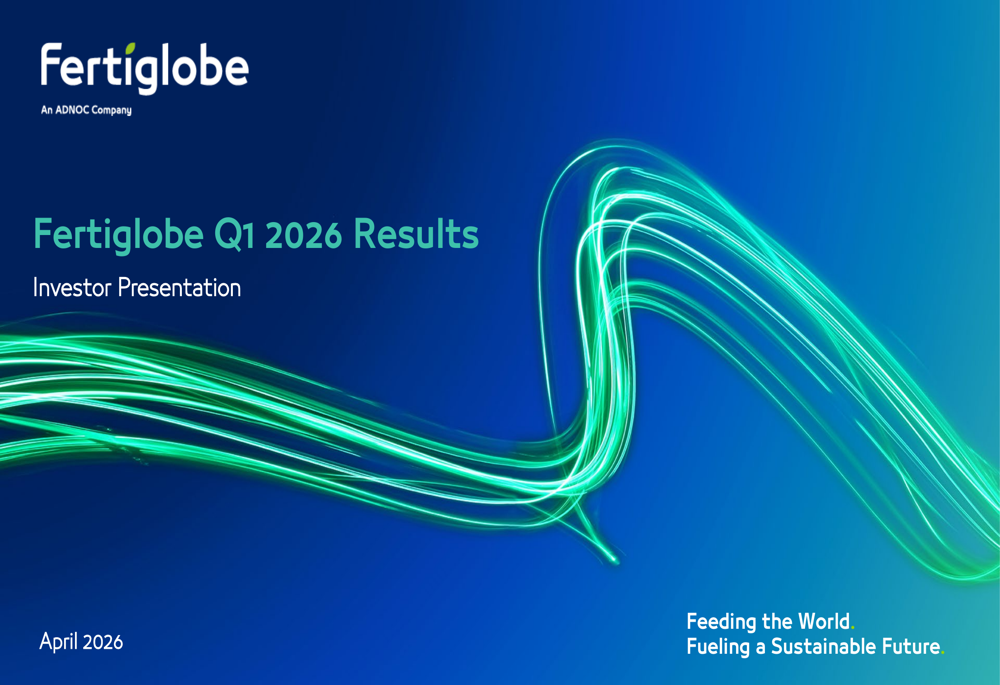
Last Update: Apr 29, 2026
See full investor slides
Earnings
Latest Release
Apr 28, 2026
EPS / Forecast
0.02 / 0.01
Revenue / Forecast
915.1M / 771.47M
Compare FERTIGLB to Peers and Sector
Metrics to compare | FERTIGLB | Sector Sector - Average of metrics from a broad group of related Basic Materials sector companies | Relationship RelationshipFERTIGLBPeersSector | |
|---|---|---|---|---|
P/E Ratio | 10.6x | 13.2x | 3.5x | |
PEG Ratio | 0.03 | 0.23 | 0.00 | |
Price / Book | 4.2x | 2.0x | 1.6x | |
Price / LTM Sales | 1.9x | 1.3x | 1.3x | |
Upside (Analyst Target) | 37.8% | 23.6% | 47.2% | |
Fair Value Upside | Unlock | 14.4% | 3.3% | Unlock |
Fertiglobe plc, together with its subsidiaries, produces and sells nitrogen-based products in Europe, North and South America, Africa, the Middle East, Asia, and Oceania. It operates through Production and Marketing of Own Produced Volumes; and Third Party Trading segments. The company offers nitrogen fertilizers; merchant ammonia used as a building block for industrial chemicals and nitrogen fertilizers; renewable and low-carbon ammonia; granular urea, utilized as a fertilizer extending its utility to industrial applications, serving as a raw material in the production of resins, melamine, DEF, and animal feedstock; and diesel exhaust fluids, a non-hazardous urea solution that helps cut down NOx, carbon monoxide, hydrocarbon, and particulate emissions. In addition, it trades and sells third-party volumes. Further, the company serves industrial and agricultural customers. The company was founded in 2018 and is headquartered in Abu Dhabi, the United Arab Emirates. Fertiglobe plc is a subsidiary of Abu Dhabi National Oil Company.
Ownership
Ownership Overview
Top Holders
People Also Watch
FAQ
What Is the Fertiglobe (FERTIGLB) Stock Price Today?
The Fertiglobe stock price today is 2.65 AED.
What Stock Exchange Does Fertiglobe Trade On?
Fertiglobe is listed and trades on the Abu Dhabi.
What Is the Stock Symbol for Fertiglobe?
The stock symbol for Fertiglobe is "FERTIGLB."
Does Fertiglobe Pay Dividends? What’s The Current Dividend Yield?
The Fertiglobe dividend yield is 8.04%.
What Is the Fertiglobe Market Cap?
As of today, Fertiglobe market cap is 21.70B AED.
What Is Fertiglobe's Earnings Per Share (TTM)?
The Fertiglobe EPS (TTM) is 0.07.
When Is the Next Fertiglobe Earnings Date?
Fertiglobe will release its next earnings report on Jul 28, 2026.
From a Technical Analysis Perspective, Is FERTIGLB a Buy or Sell?
Based on moving averages and other technical indicators, the daily buy/sell signal is Strong Sell.
How Many Times Has Fertiglobe Stock Split?
Fertiglobe has split 0 times.
How Many Employees Does Fertiglobe Have?
Fertiglobe has 2700 employees.
What is the current trading status of Fertiglobe (FERTIGLB)?
As of Jul 20, 2026, Fertiglobe (FERTIGLB) is trading at a price of 2.65 AED, with a previous close of 2.13 AED. The stock has fluctuated within a day range of 2.63 AED to 2.67 AED, while its 52-week range spans from 2.35 AED to 3.85 AED.
What Is Fertiglobe (FERTIGLB) Price Target According to Analysts?
The average 12-month price target for Fertiglobe is 3.62 AED, with a high estimate of 4.1975762 AED and a low estimate of 3.00036724 AED. 11 analysts recommend buying the stock, while 0 suggest selling, leading to an overall rating of Buy. The stock has an +36.62% Upside potential.
Risk Disclosure: Trading in financial instruments and/or cryptocurrencies involves high risks including the risk of losing some, or all, of your investment amount, and may not be suitable for all investors. Prices of cryptocurrencies are extremely volatile and may be affected by external factors such as financial, regulatory or political events. Trading on margin increases the financial risks.
Before deciding to trade in financial instrument or cryptocurrencies you should be fully informed of the risks and costs associated with trading the financial markets, carefully consider your investment objectives, level of experience, and risk appetite, and seek professional advice where needed.
Fusion Media would like to remind you that the data contained in this website is not necessarily real-time nor accurate. The data and prices on the website are not necessarily provided by any market or exchange, but may be provided by market makers, and so prices may not be accurate and may differ from the actual price at any given market, meaning prices are indicative and not appropriate for trading purposes. Fusion Media and any provider of the data contained in this website will not accept liability for any loss or damage as a result of your trading, or your reliance on the information contained within this website.
It is prohibited to use, store, reproduce, display, modify, transmit or distribute the data contained in this website without the explicit prior written permission of Fusion Media and/or the data provider. All intellectual property rights are reserved by the providers and/or the exchange providing the data contained in this website.
Fusion Media may be compensated by the advertisers that appear on the website, based on your interaction with the advertisements or advertisers.
© 2007-2026 - Fusion Media Limited. All Rights Reserved.