Get 40% Off
👀 👁 🧿 All eyes on Biogen, up +4,56% after posting earnings. Our AI picked it in March 2024.
Which stocks will surge next?
Unlock AI-picked Stocks

World Stock Markets: Perma-Bears Beware

Published 09/19/2017, 12:03 AM
Updated 07/09/2023, 06:31 AM

The dominant trend in major World Stock Market indexes is UP…UP…UP. The burden of proof is on the perma-bears.

The daily chart of Dow futures completed a 4- week pennant on Tuesday. This type of concise pattern provides swing-trade possibilities.
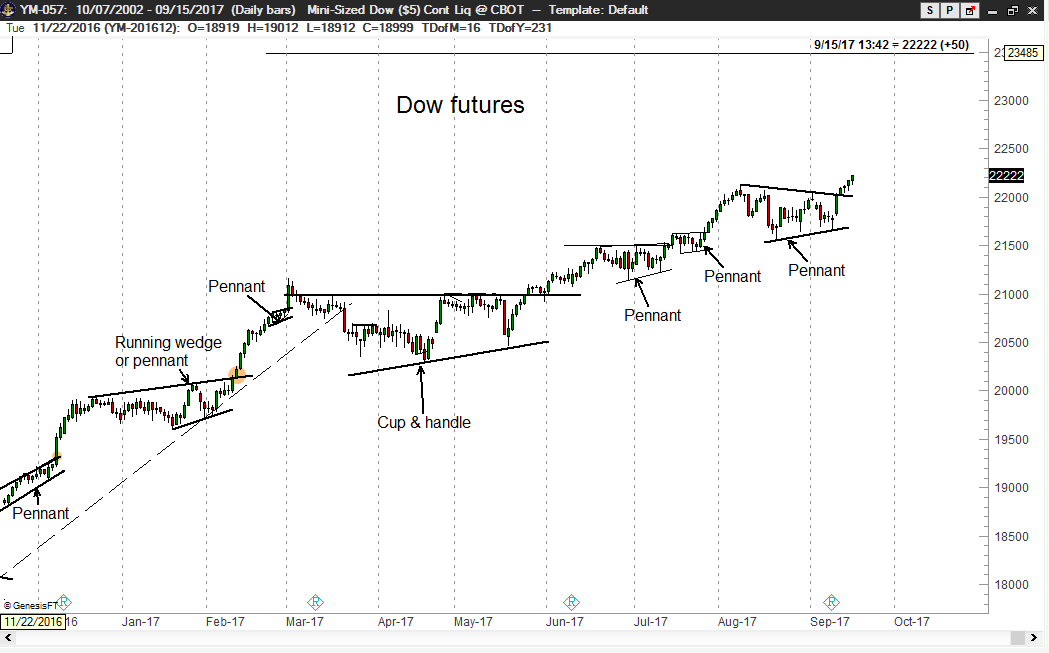
Dow Futures Daily

The NASDAQ continues to display a possible wedge pattern. While the rising wedge is generally a bearish pattern, it is occasionally resolved by an upward thrust (known as a running wedge).
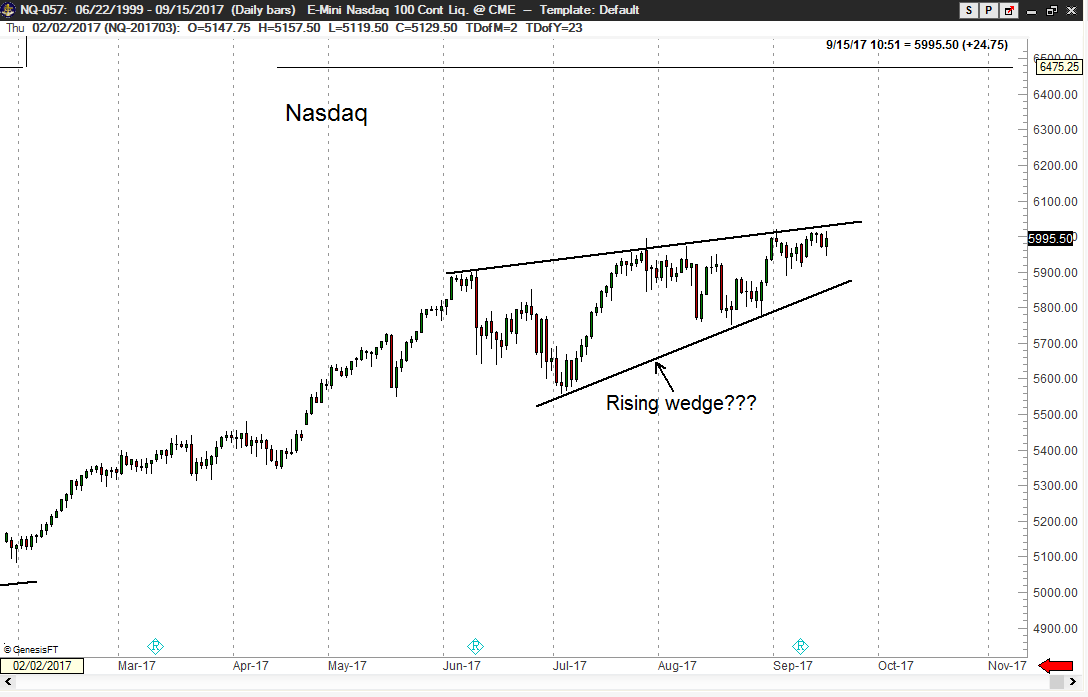
NASDAQ Futures Daily

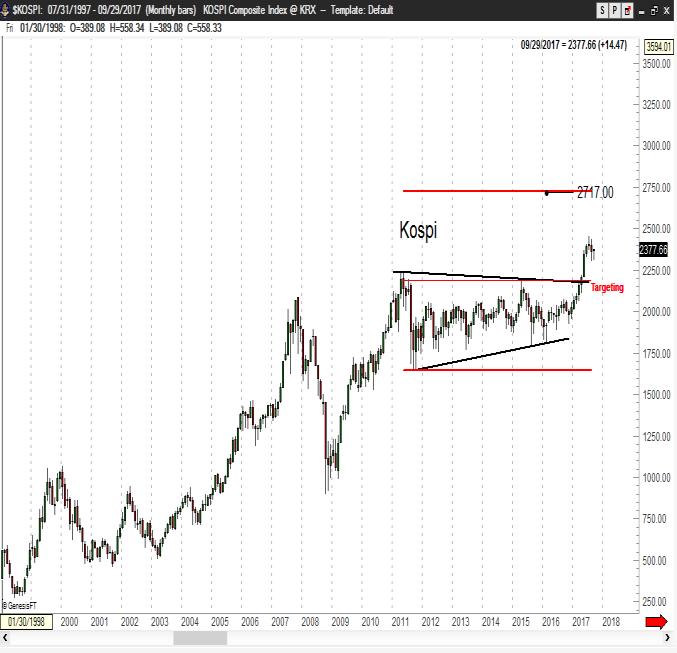
The KOSPI remains in a powerful uptrend on the monthly graph. That the daily chart has experienced only a 6% correction with Krazy Kim Potbelly on the loose should be viewed as a sign of strength for now. Of course Potbelly is capable of all kinds of mischief.
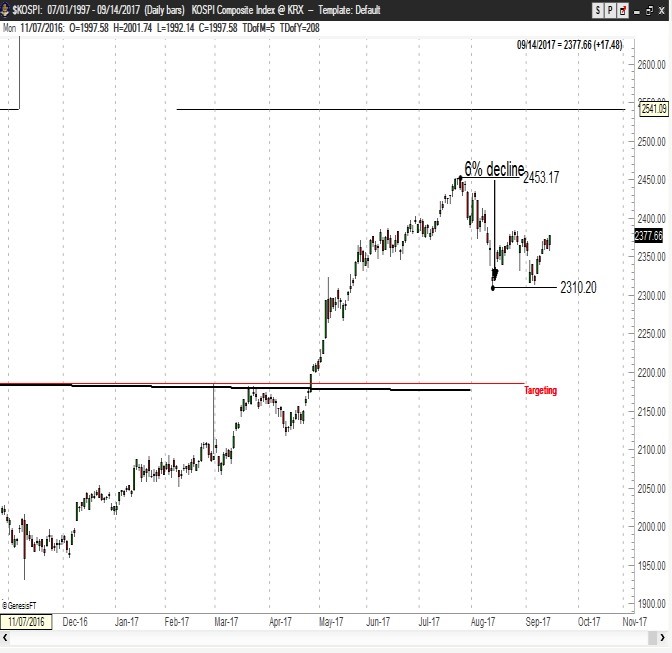
KOSPI Daily

KOSPI Monthly

World Stock Markets everywhere are showing strength. The completed 2-year Cup and Handle pattern on the weekly Nifty chart has a target of 11,250.
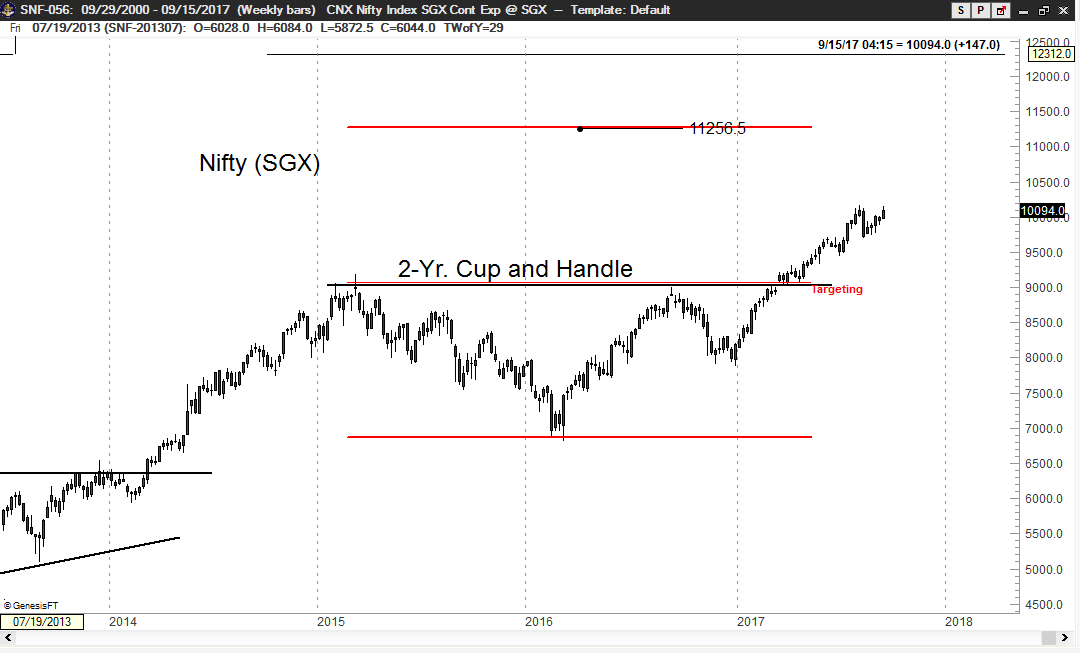
Nifty SGX

The Taiwan Index is forming a very well-defined 12-week ascending triangle. Throughout my trading career I have done very well trading compact continuation patterns such as the one shown on the Taiwan Index graph. This futures contract is very thinly traded.
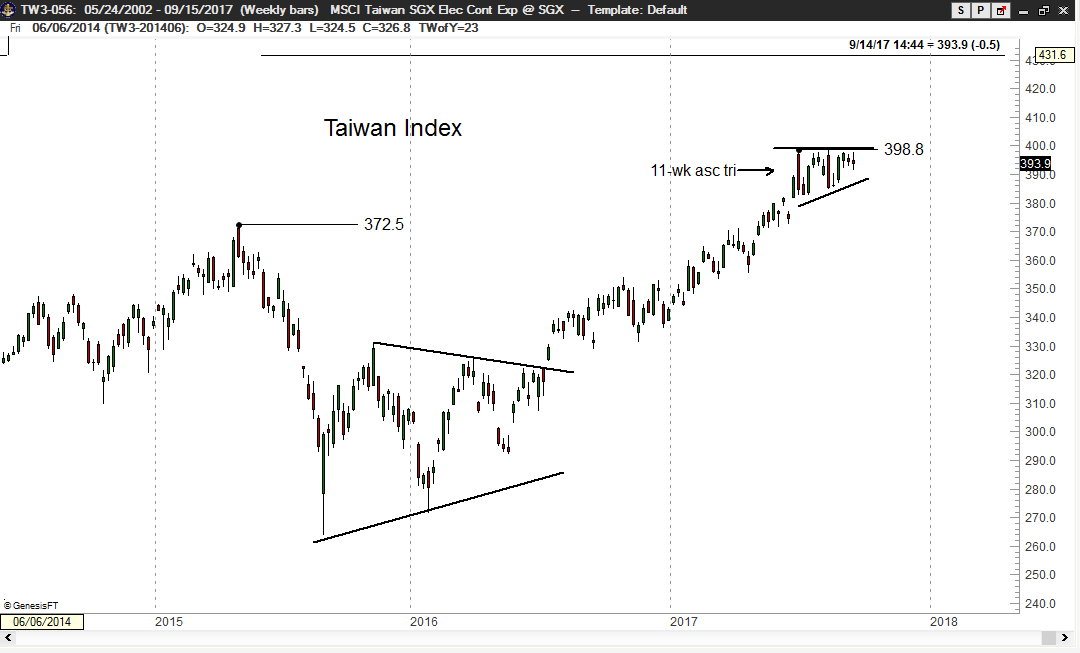
Taiwan Index

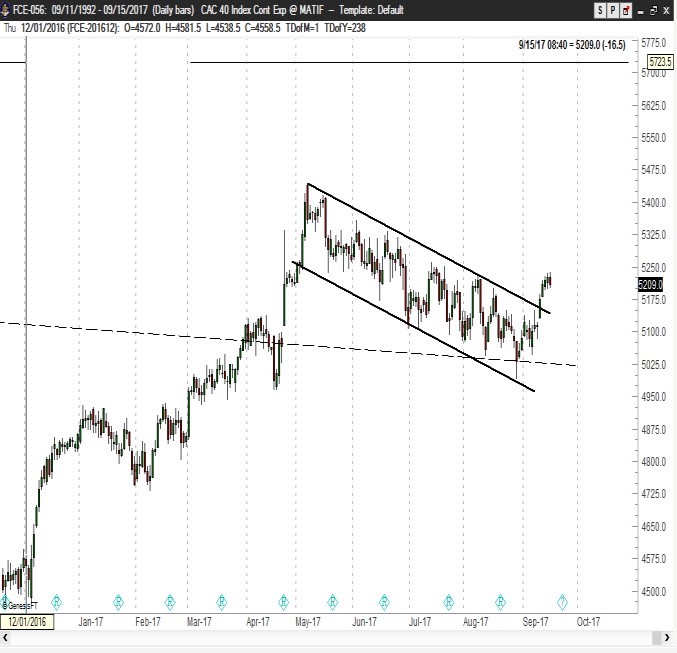
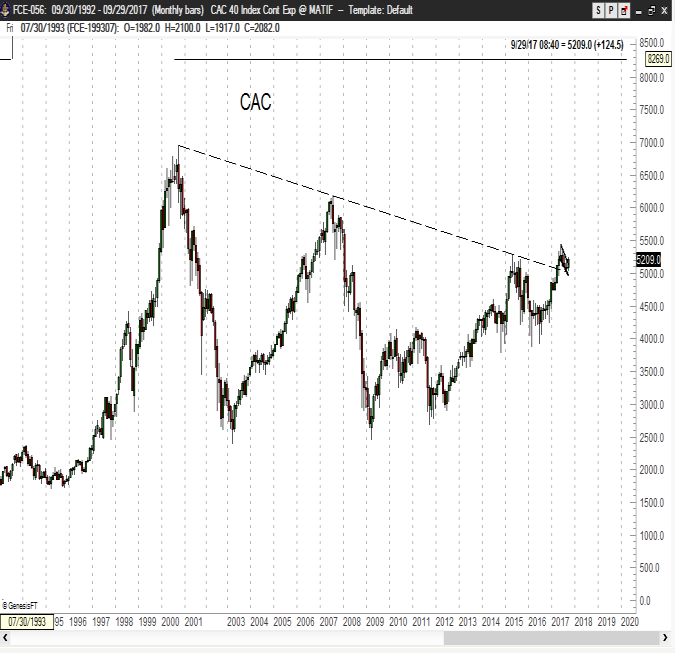
The CAC (France) chart is worthy of note. The monthly graph has climbed above a multi-year declining trendline. The violation of a trendline in and of itself does not turn a trend from down to up or from up to down. Violated trendlines simply represent a change in market behavior and should put a trader on the alert for additional trading clues. In the case of the CAC, the trendline has been successfully retested in the form of a 4-month channel on the daily chart. The CAC flashed a strong buy signal this past Monday.
3rd party Ad. Not an offer or recommendation by Investing.com. See disclosure here or remove ads .

FCE

CAC Chart

PGAL (Portugal ETF) – the bull market continues

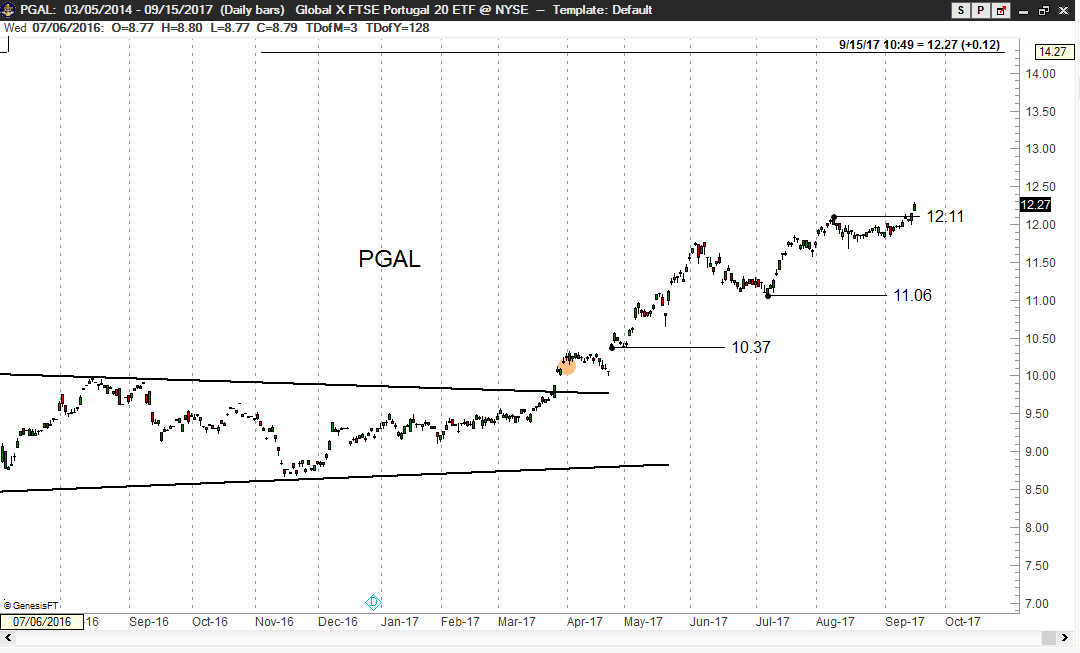
The monthly Portugal stock index (PSI20) and daily PGAL graphs are shown. The PSI20 and its corresponding ETF (PGAL) has been covered extensively in Factor updates dating back to Mar 2017. I have been hoping for a correction in PGAL in order to return to the long side. I threw in the towel and bought the ETF on Thursday when a new high for the advance was registered. The target for this ETF is 16.48.
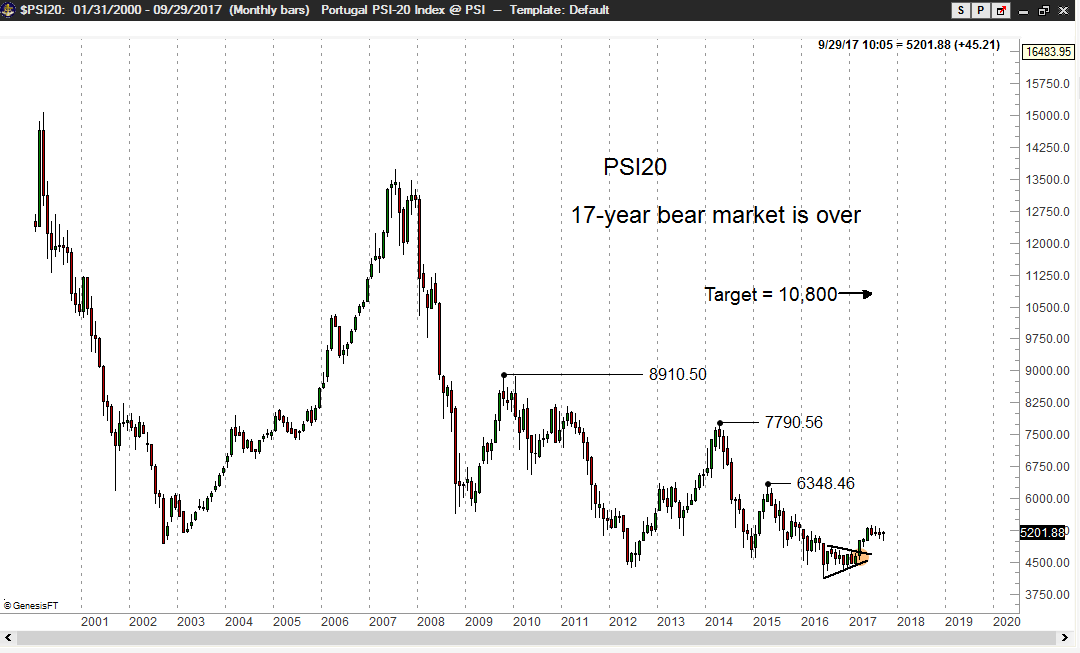
PS120 Chart

Portugal Chart

Latest comments

Hi, can you give your suggestions on Nifty
Please mortgage the house and go long then.
Risk Disclosure: Trading in financial instruments and/or cryptocurrencies involves high risks including the risk of losing some, or all, of your investment amount, and may not be suitable for all investors. Prices of cryptocurrencies are extremely volatile and may be affected by external factors such as financial, regulatory or political events. Trading on margin increases the financial risks.
Before deciding to trade in financial instrument or cryptocurrencies you should be fully informed of the risks and costs associated with trading the financial markets, carefully consider your investment objectives, level of experience, and risk appetite, and seek professional advice where needed.
Fusion Media would like to remind you that the data contained in this website is not necessarily real-time nor accurate. The data and prices on the website are not necessarily provided by any market or exchange, but may be provided by market makers, and so prices may not be accurate and may differ from the actual price at any given market, meaning prices are indicative and not appropriate for trading purposes. Fusion Media and any provider of the data contained in this website will not accept liability for any loss or damage as a result of your trading, or your reliance on the information contained within this website.
It is prohibited to use, store, reproduce, display, modify, transmit or distribute the data contained in this website without the explicit prior written permission of Fusion Media and/or the data provider. All intellectual property rights are reserved by the providers and/or the exchange providing the data contained in this website.
Fusion Media may be compensated by the advertisers that appear on the website, based on your interaction with the advertisements or advertisers.
© 2007-2024 - Fusion Media Limited. All Rights Reserved.