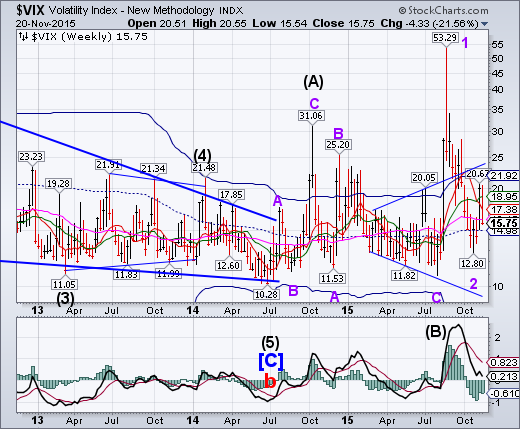
VIX made a 65% retracement of its rally off the 12.80 low. It remains on a weekly buy signal.The next move calls for a breakout to new highs. While traders are anticipating a calmer season ahead, the VIX warns the opposite may happen.
SPX bounces off its trendline.
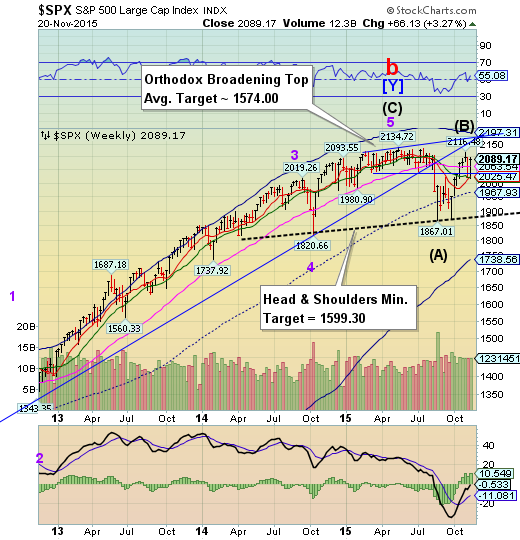
The SPX bounced off Intermediate-Term support/resistance at 2021.74 to make an 80% retracement of its decline. The Broadening Top formation is still in play, since it allows throw-backs. Long-term support is at 2063.54. A drop beneath that level puts SPX on a sell signal
(ZeroHedge) You can manipulate earnings, but the S&P 500 is as expensive now on a cash-flow basis as it was at the peak of the dot-com bubble...Cheap?
(ContraCorner) As the stock market labored into Friday’s close, CNBC was apparently tying to help with a crawler saying that the S&P 500 was heading for its “best week of the year.” Then again, the gain of just 1% since New Year’s Day is not a whole lot to write home about.
In fact, there were some fireworks in this week’s gains, but if history is any guide they were exactly the kind of action that always precedes a thundering bust. To wit, the market has narrowed down to essentially four explosively rising stocks—–the FANG quartet of Facebook (O:FB), Amazon (O:AMZN), Netflix (O:NFLX) and Google (O:GOOGL)—–which are sucking up all the oxygen left in the casino.
NDX bounces at Short-term support.
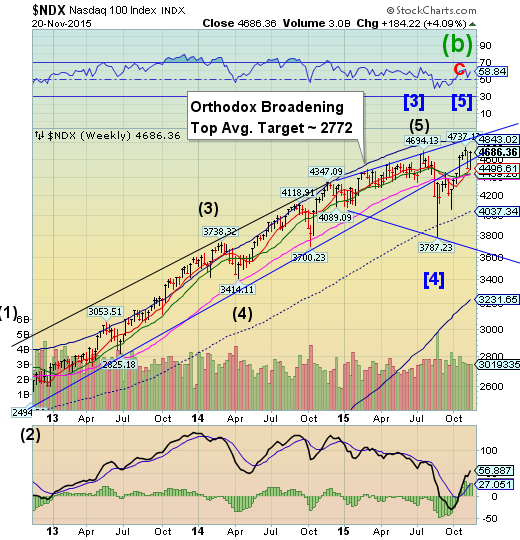
NDX reversed from its Short-term support at 4496.61 this week. Point 6, which is likely to be near its Cycle Bottom support at 3231.65, may be its next target. This may happen in a surprisingly short period of time.
(NYT) The stock market closed out its best week of the year Friday as big gains by retailers and technology companies pushed major indexes higher.
Stocks faded as Friday wore on, but they still finished higher — the Standard & Poor’s 500-stock index climbed almost 3.3 percent this week, its biggest weekly gain of the year.
The S.&P. climbed Monday and Wednesday as the U.S. market seemed to be unaffected by a string of unsettling international events, including last Friday’s terrorist attack in Paris. Instead, investors appeared to be concluding that the U.S. economy remains strong.
High Yield Bonds bounce to Long-term resistance.
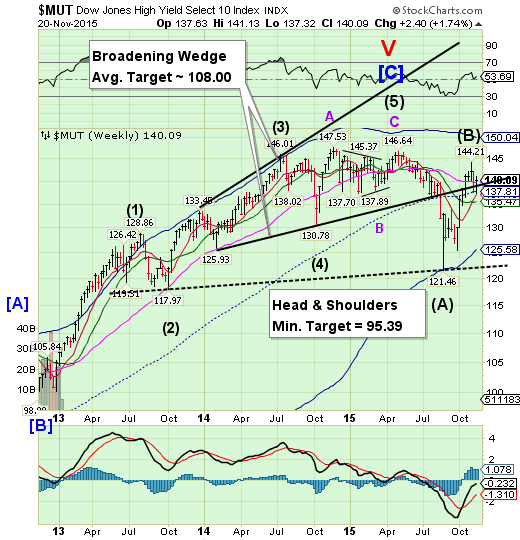
The High Yield Index bounced back to overtake Long-term support at 139.69 and its Broadening Wedge trendline by Friday’s close. Despite the rally, the Cycles Model suggests a major decline in HY over the next several weeks.
(InsuranceJournal) Billionaire activist investor Carl Icahn said he is betting against high-yield bonds, as he sees a bubble among companies that have overborrowed recently, and expects the dollar to keep rallying into next year.
Icahn, speaking at the Reuters Global Investment Outlook Summit in New York, said the short position against high yield is his “favorite” position right now.
The euro continues to test the lower trendline.
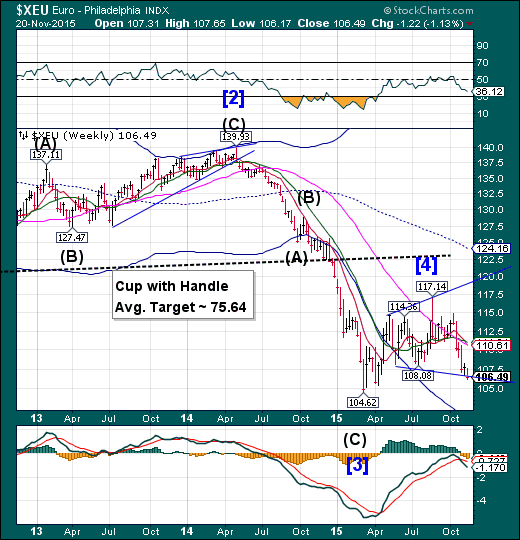
The euro has extended the challenge of the lower trendline of its Flag formation this week. There is good reason to believe that the euro may go higher in the next two weeks or more as it seeks the upper trendline of this broadening Flag. It is probable that the euro trend toward parity with the USD may resume with a vengeance once this head-fake is complete.
(ZeroHedge) Yesterday there was pent up expectation that the ECB's latest minutes, by being structurally dovish and thus the opposite of the Fed's own minutes, would unleash another round of EUR weakness. This did not happen, and instead not only did the EUR jump during the day, but the USD saw an unexpected round of all day weakness. Many were surprised by this response. It turns out Mario Draghi was merely biding his time, and in a speech released moments ago, titled "Monetary Policy: Past, Present and Future" delivered at the European Banking Congress, Draghi pulled another "whatever it takes" card, and promptly sent the euro currency reeling, if only for the time being.
EuroStoxx are caught between support and resistance.
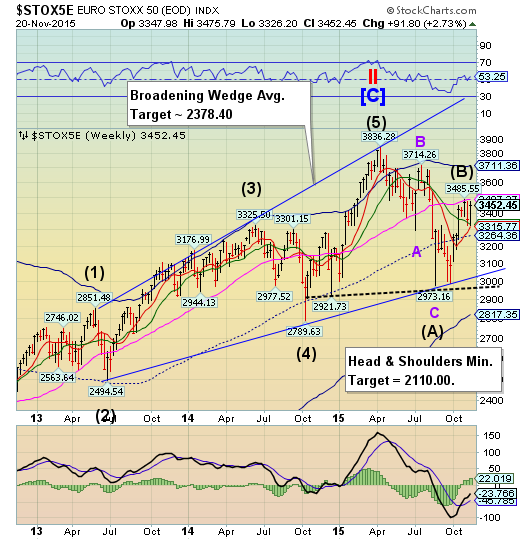
EuroStoxx challenged weekly Long-term resistance at 3487.27 again this week after bouncing from a lower Intermediate-term support at 3331.22. A loss of Intermediate-term support may be problematic, as a further decline to weekly mid-Cycle support at 3264.36 is likely to follow. Should that occur, EuroStoxx may remain in a decline through the end of the year.
(Reuters) European shares ended their strongest week in a month on Friday with a benchmark index rising to three-month highs, helped by growing expectations of more ECB stimulus, but gains were capped by stake sales in leading companies.
The pan-European FTSEurofirst 300 index rose 0.19 percent to gain more than 3 percent on the week, while the Euro STOXX 50 added 0.1 percent.
Investors said sentiment was helped by a fresh pledge by European Central Bank chief Mario Draghi to act quickly to boost anaemic inflation, highlighting changes to the bank's asset purchase programme and deposit rates as possible tools.
The yen may bounce.
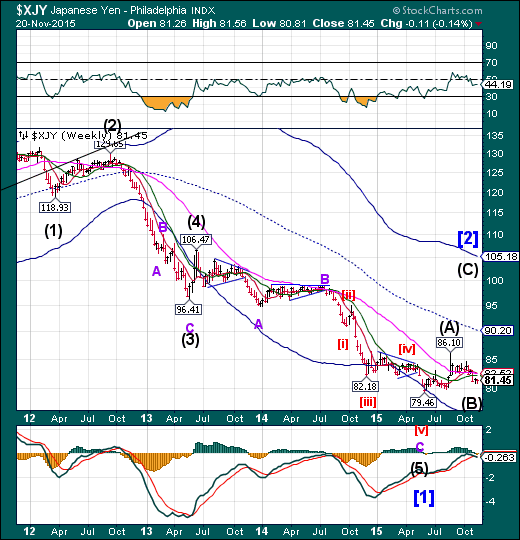
The yen extended its decline to Wednesday to complete a bullish Flag formation that implies a target at or above mid-Cycle resistance at 90.20. The bounce may last up to two weeks.
(TheJapanNews) Japanese banks are facing a sharp jump in dollar-funding costs and a blow to their investment returns as the Federal Reserve’s plan to raise interest rates puts paid to an era of cheap dollars.
The strong U.S. employment data has increased the likelihood of the Fed raising rates at its Dec. 15-16 meeting and that has pushed yen-dollar swap costs sharply higher.
That’s not good news for Japanese banks, whose favorite trades in recent years — borrowing dollars to buy U.S. bonds and booking higher returns than they can get at home — had suddenly become much less attractive. The higher dollar-funding costs risks eroding their already-low profit margins.
The Nikkei completed a 75% retracement.
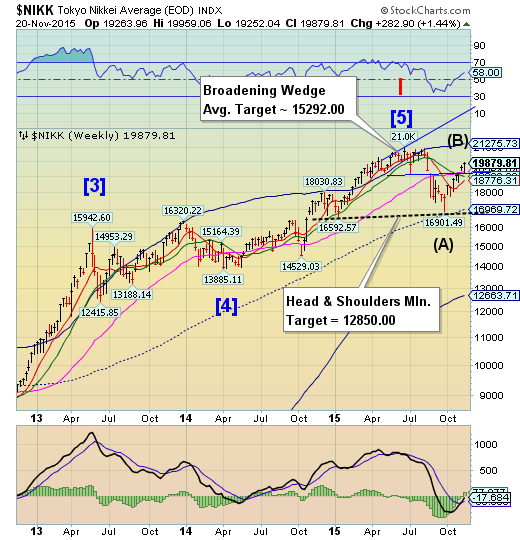
The Nikkei continued its rally until Thursday, when it completed a 75% retracement. Broadening formations allow throwbacks before the final decline which may reach their targets. A probable reversal may be at hand, with weakness in the Cycle showing for the next three weeks. Should the subsequent decline go beneath mid-cycle support at 16969.72, the Nikkei may experience a flash crash taking it to its cycle Bottom support at 12663.71.
(NikkeiAsianReview) Japan's central bank should continue to use monetary policy to encourage "healthy risk-taking practices" as it continues its long battle to boost inflation, Bank of Japan policy board member Sayuri Shirai said.
"Households and financial institutions increasingly express interest in riskier assets and diversification of risks," Ms. Shirai said in remarks prepared for delivery Friday at a conference hosted by the Federal Reserve Bank of San Francisco. "Banks are more eager to extend credits with innovative financial services. The number of initial public offerings has increased and firms are more active in business investment, mergers and acquisitions, and organizational rationalization both domestically and globally."
U.S. dollar challenges Round Number resistance.
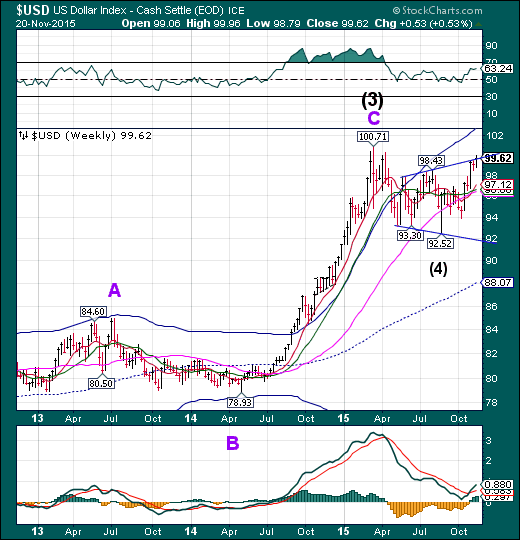
The US dollar challenged Round Number resistance again, reaching a high of 99.96 on Wednesday.The Cycles Model calls for a pullback to Long-term support, currently at 97.12, but should a financial event happen, it may decline to trendline support at 92.00. The Cycles Model calls for a Master Cycle low in early December. Speculators may be caught the wrong way in their positions, causing a larger than expected decline.
(Reuters) Speculators further increased bullish bets on the U.S. dollar in the latest week, as net longs climbed to their highest in eight months, according to Reuters calculations and data from the Commodity Futures Trading Commission released on Friday. The value of the dollar's net long position rose to $41.64 billion in the week ended Nov. 17, from $33.68 billion in the previous week. That was the largest net long position since late March, with investors increasing long contracts for a fourth consecutive week. To be long a currency is to make a bet it will rise, while being short is a bet the currency's value will decline.
USB bounces at the Broadening Wedge trendline.
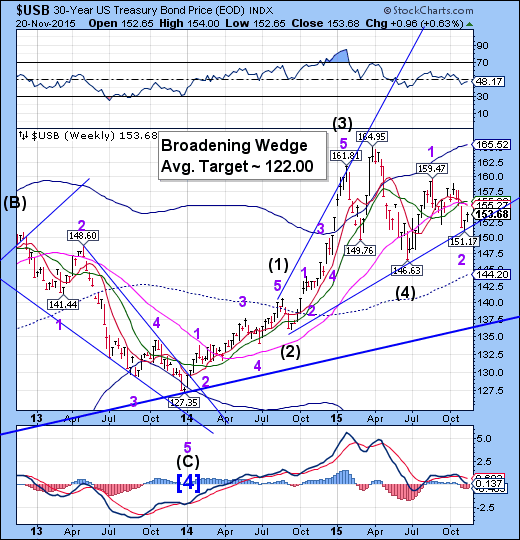
The Long Bond bounced at the Broadening Wedge trendline at 151.00 on November 9. USB has formed a Master Cycle low at the trendline, keeping the long-term trend intact. The Cycles Model suggests a rally in USB that may last through mid-December.
(Bloomberg) Thirty-year Treasuries logged their first back-to-back weekly gains since August as the prospect that the Federal Reserve will raise interest rates next month and declining oil prices dimmed inflation prospects.
Minutes of the Fed’s October meeting, released this week, showed policy makers sought to signal a possible rate boost as soon December and that additional increases would occur gradually. The Fed’s message, combined with falling commodity prices, drove longer-dated Treasuries to outperform. Those maturities are most sensitive to inflation prospects.
“The Fed has made the promise not to go too quickly,” said Gennadiy Goldberg, a New York-based U.S. rates strategist with TD Securities, one of the 22 primary dealers that trade with the Fed. “Inflation is still low.”
Gold is at a new low beneath its Cycle Bottom.
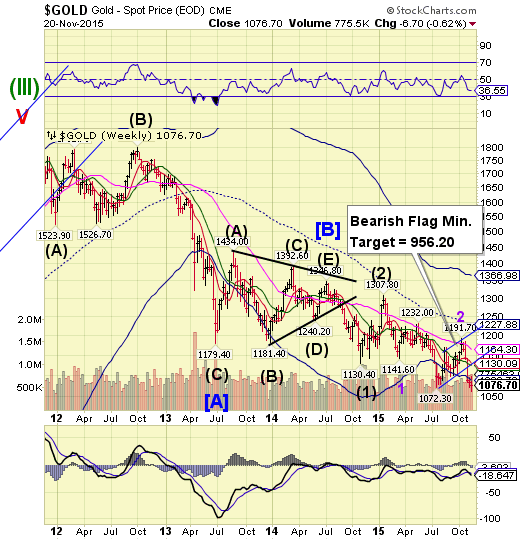
Gold declined beneath its July low at 1072.30, making a new low at 1062.00 on Wednesday. It may be that it made a Master Cycle low, but there is no clear reversal pattern while gold remains beneath its Cycle Bottom at 1088.78. The Cycles Model suggests an alternate pattern with more sustained low at the end of November or early December with a possible low near 1040.00 or lower. With the loss of support, a lot may happen in the meantime.
(Reuters) Gold turned lower on Friday, ending a two-day bounce up from the lowest level in nearly six years, on the firm dollar and comments from a Federal Reserve policy maker who said the U.S. central bank should "soon" be ready to raise interest rates.
"We hope that relatively soon we will become reasonably confident that inflation will return to our 2 percent objective," said William Dudley, the influential head of the New York Fed.
Spot gold was down 0.5 percent at $1,076.40 an ounce at 2:38 p.m. EST (1938 GMT), while U.S. gold futures for December delivery settled down $1.60 an ounce at $1,076.30. The metal is set to end the week down a shade after prices jumped 1.1 percent on Thursday.
Crude is at a crossroads.
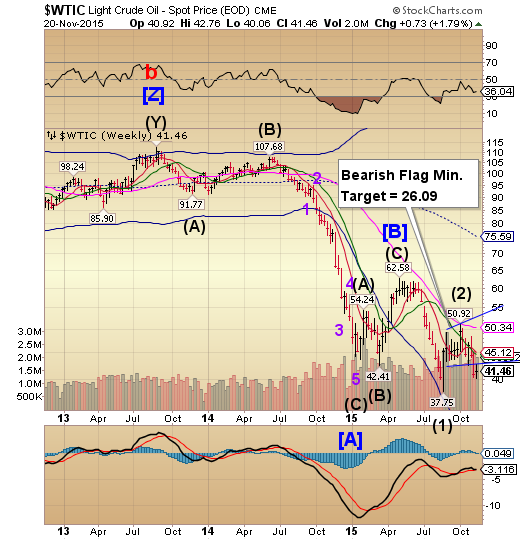
Crude bounced at 40.06 on Monday, but hasn’t successfully made a reversal pattern yet. It may rally back to Short-term resistance at 45.12 before a larger decline. This would support the view that Monday’s low may have been an early Master Cycle low that calls for a further retracement. The alternate view is that crude oil may go into free-fall in the next two or more weeks should a financial event occur that may take the price of crude well below the minimum target. Note that the Cycle Bottom Support is at 28.07.
(WSJ) The ingenuity and easy money that allowed American oil companies to keep pumping through a year-long price crash appear to be petering out as U.S. crude slides toward $40 a barrel.
U.S. companies have stunned global rivals by continuing to produce oil—particularly from shale deposits—ever more cheaply as American crude prices plunged from over $100 a barrel in 2014. But the recent drop toward $40 a barrel and below puts even the most efficient operators in a bind.
“Forty-dollar to fifty-dollar oil prices don’t work in this business,” Ryan Lance, chief executive of ConocoPhillips (N:COP), the largest independent U.S. oil producer, said in an interview.
Shanghai Index nearing exhaustion.
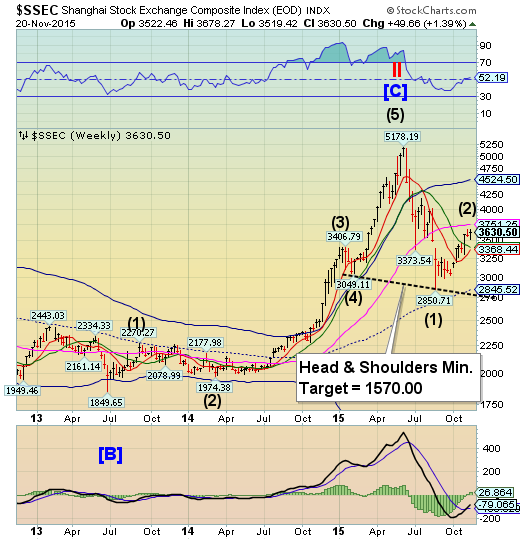
The Shanghai Index made a marginal new high on Tuesday at 3678.27 before easing down into the weekly close. It appears that Long-term resistance may still be an attraction, although that appears to be weakening. The Cycles Model is neutral at this time. However, should Intermediate-term support at 3405.16 be breached, the Head and Shoulders neckline may be triggered, extending the decline through the year-end.
(ZeroHedge) Early last month in “Chinese Cash Flow Shocker: More Than Half Of Commodity Companies Can't Pay The Interest On Their Debt,” we highlighted a report from Macquarie which showed that for many Chinese corporates, debt service payments have simply become too much to bear in the current environment.
As Macquarie put it "more than half of the cumulative debt in [the commodities space] was EBIT-uncovered in 2014, and all sub-sectors have their share in the uncovered part, particularly for base metals (the big gray bar on the right stands for Chalco), coal, and steel."
The Banking Index rallies above Long-term support/resistance.
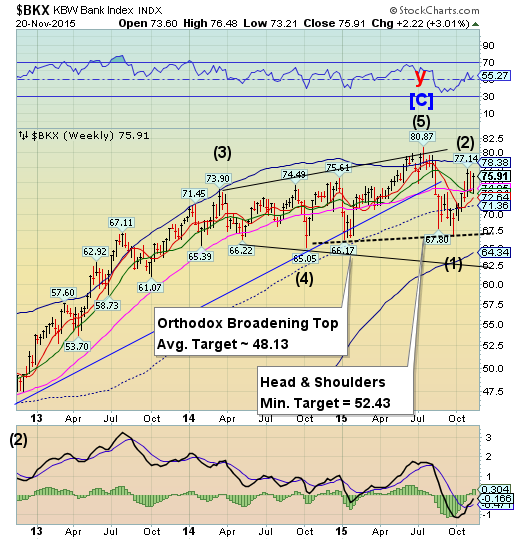
BKX bounced from Intermediate-term resistance at 73.24 to make an 83% retracement of its previous decline. A reversal next week may bring the neckline of the Head and Shoulders formation in play. There seems to be a lack of awareness of the magnitude of a potential decline.
(ZeroHedge) Late last month, we introduced you to “Mr. Chen,” a catch-all for the operators of tiny storefronts and kiosks in China who can either get you some tea and a Snickers bar, or smuggle millions out of the country, whichever you prefer.
“Mr. Chen” is part and parcel of China’s vast underground bank network which Chinese use to circumvent Beijing’s capital controls.
Officially, you’re only allowed to move $50,000 per year out of China, but there are any number of ways to get around that limit. One popular method - until Xi began to crack down that is - was the UnionPay end-around, which entails making what amounts to a fake purchase for something like, say, an expensive watch, and receiving cash from the merchant instead of merchandise.
(ZeroHedge) Ten years after Symantec (O:SYMC) paid $13.5bn for Veritas, Carlyle Group (O:CG) agreed in August to buy the data-storage business for just $8 billion (the biggest LBO of the year). Of course, the buyout deal made sense when the cost of funding was negligible and The Fed had your back but, as Bloomberg reports, amid soaring borrowing costs, banks have pulled the $5.5 billion debt offering for Veritas signaling a clear end to the reach-for-yield, nothing is a problem, bond market's risk appetite.. and if 'growthy' deals like this are being killed, what does that say for distressed bets on Energy M&A deals?
(NYTimes) In recent years, Wall Street firms have reaped big profits in the scrappy reaches of the credit markets, selling the debt of companies with weak credit ratings to investors who crave higher returns.
But now, as investors have suddenly grown skittish, some big Wall Street banks have been stuck with piles of debt that they are struggling to sell. As a result, they are starting to book multimillion-dollar losses as they write down the value of these positions.
(ZeroHedge) Given how awesome everything appears to be, judging by stocks and the tidal wave of FedSpeak of the last week confirming that rates are rising in December, we found it at least marginally 'odd' that out of the blue, The Fed would announce an 'expedited, closed' meeting on Monday...
