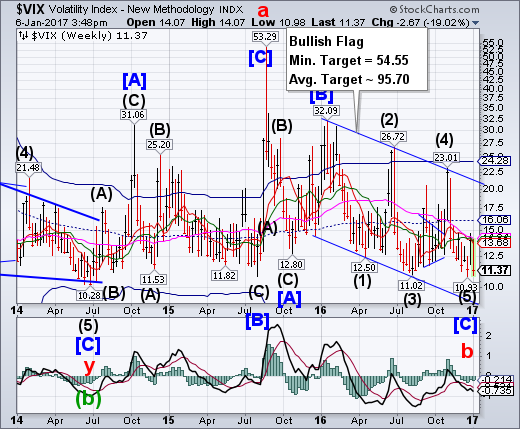
VIX pressed down to the 10-handle, but did not go beneath the Master cycle low of December 21.A buy signal may be forthcoming should the VIX rally above its Long-term resistance at 14.24.The breakout above the resistance zone implies higher targets to come.
(ZeroHedge) What could possibly go wrong?
- Russell 2000 speculative positioning has never...ever... been more long.
- VIX futures positioning is near its shortest ever.
- Treasury futures speculative positioning has never...ever...been more short.
SPX rallies to the upper trendline.
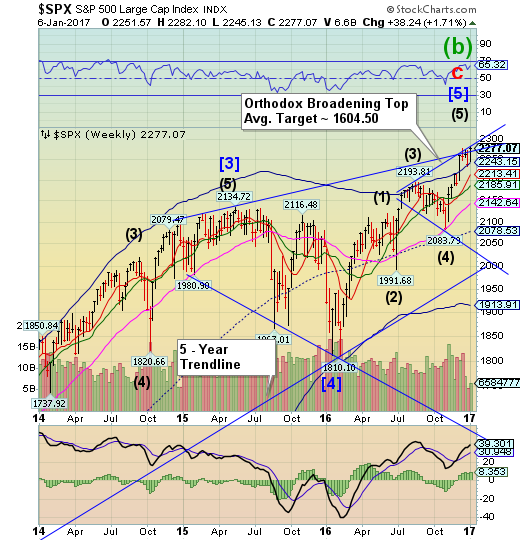
SPX found support at its weekly Cycle Top at 2243.15 and bounced to the upper trendlines of two Orthodox Broadening Tops.It closed at the higher trendline. A decline beneath the Cycle Top support gives the SPX a sell signal.The smaller Broadening Top formation suggests a decline to 2000.00 or possibly lower may occur.
(Reuters) The Dow came within a hair's breadth of hitting 20,000 for the first time ever on Friday as Wall Street staged a swift recovery, helped by technology stocks.
A rise in Apple (NASDAQ:AAPL) pushed the three major indexes to record highs.
Apple's shares rose 1.1 percent to $117.86 after Canada's Competition Bureau said it did not find sufficient evidence iPhone maker had engaged in anti-competitive conduct, closing a two-year investigation into the company.
The Nasdaq is on track to be the biggest gainer in Wall Street's first trading week of the year, rising about 2.6 percent. The S&P was set to gain 1.8 percent and the Dow 1.1 percent.
The Nasdaq 100 challenges the upper trendline of the Orthodox Broadening Top.
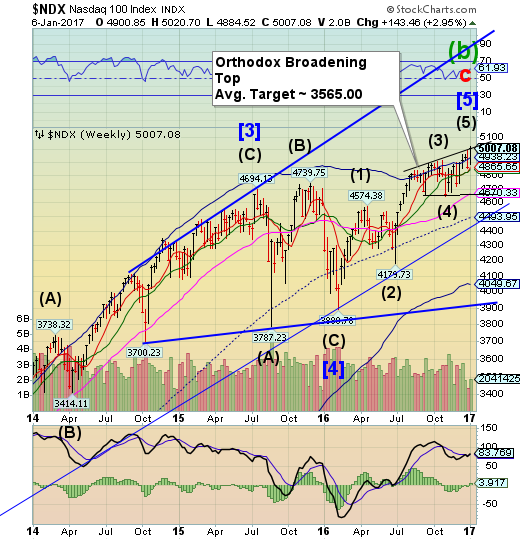
NDX made a new all-time high as it challenged the upper trendline of its Orthodox Broadening Top.It must cross beneath its Cycle Top support at 4938.23 to give it an aggressive sell signal. A further break of the weekly Short-term support at 4865.65 confirms a sell signal.
(IBD) The Nasdaq composite climbed above the 5500 level Friday and the Dow Jones industrial average fell just short of 20,000 on Friday.
The Nasdaq rose 0.6%, off its best levels of the day. The S&P 500 picked up 0.4% and the Dow 0.3% as well. All three major indexes set record highs intraday.
Among Nasdaq 100 bellwethers, Facebook (NASDAQ:FB), which just reclaimed its 50-day and 200-day moving averages Thursday, jumped 2.3%; Alphabet (NASDAQ:GOOGL) popped above an 824.40 buy point, rising 1.5%, Amazon (NASDAQ:AMZN) was trying to crack through the 800 level, rising 2% to 795.99. Netflix (NASDAQ:NFLX) faltered late to close down 0.6%.
High Yield Bond Index closes beneath its Cycle Top.
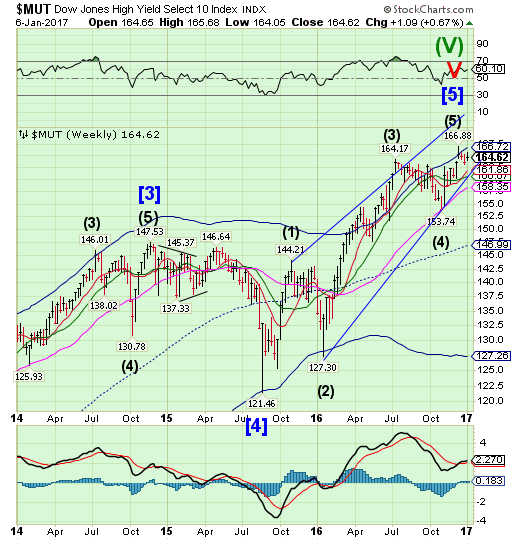
The High Yield Bond Indexclosed the week on a sour note, by not participating in the stock rally. There may be a very short window for a rally on Monday, but once it declines beneath last week’s low at 163.11, it assumes a sell signal. A broken Diagonal trendline near 160.00 implies a complete retracement of the rally.
USB may have completed a bounce…for now.
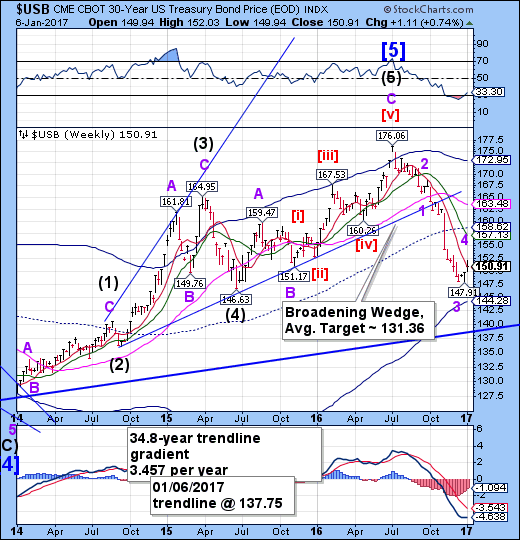
The Long Bond appears to have completed its bounce to weekly Short-term resistance at 150.71.The Cycles Model allows for a short pullback, then another attempt at mid-Cycle resistance at 158.62 over the next week or two. The probable target for the final decline appears to be its 35-year trendline at 137.75.
(WSJ) U.S. government bonds pulled back Friday as the latest jobs report showed solid wage growth, raising the prospect of higher inflation and tighter monetary policy.
The U.S. economy added 156,000 new jobs last month, compared with the forecast of 183,000 by economists polled by The Wall Street Journal. Average hourly earnings for private-sector workers rose 10 cents, or 0.39%, from the previous month, beating expectations and marking the largest annual gain in more than seven years.
Along with being good news for workers, wage growth can signal broader inflation, which erodes the fixed returns of bonds and can lead to a faster pace of interest-rate increases from the Federal Reserve.
The Euro bounces a third time off its Cycle Bottom.
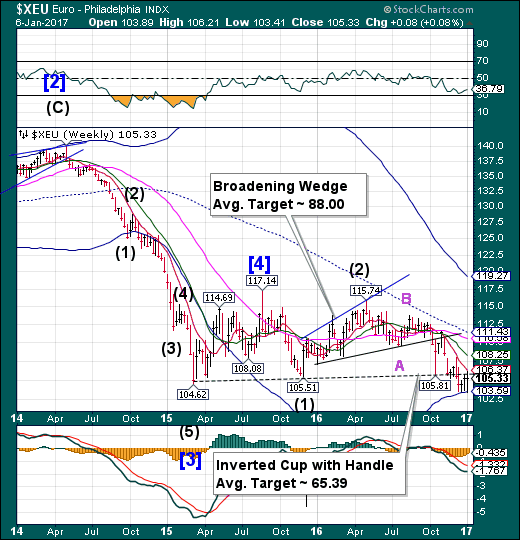
The Euro bounced three times off its Cycle Bottom at 103.59 to test the Lip of its inverted Cup with Handle formation, but closed within that consolidation range.The Euro appears to be buying time as it may not be due for its major low until February. The Cup with Handle allows throw-backs, so we may see a brief visit to Intermediate-term resistance at 108.25.
(WSJ) The dollar’s recent surge has rekindled an old discussion in currency markets: Will the euro reach parity with the greenback? Bond yields suggest recent expectations may need a rethink.
Foreign exchange analysts at Citibank, Morgan Stanley (NYSE:MS) and Goldman Sachs (NYSE:GS) are among those that see the euro falling to $1, or even lower, this year. But a shift in markets this week shows that parity isn’t a sure bet.
The spread between German government bond yields and U.S. government bond yields, a major force behind euro-dollar forecasts, reached its widest level since 1989 at the end of 2016. When yields are low in one country and high in another, investors gravitate to the high-yielding country, seeking better returns.
Euro Stoxx 50 may have completed its right shoulder.
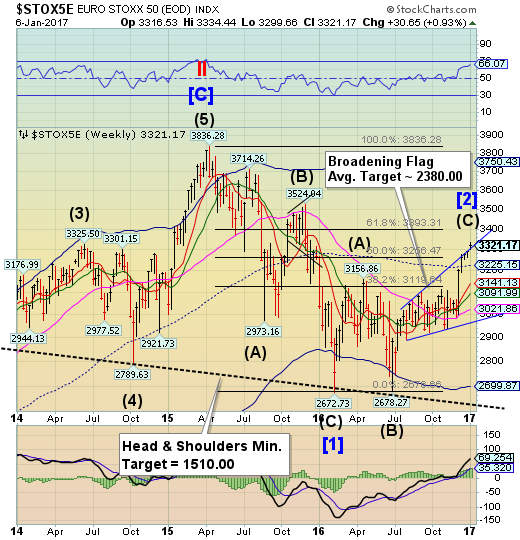
The Euro Stoxx 50 Indexe merged above its Broadening Flag formation, completing the right shoulder of its massive Head & Shoulders formation.It is now due for a decline that may follow over the next several weeks. The Index must complete a reversal pattern beneath mid-Cycle support/resistance at 3225.15 before a sell signal may be issued.
(Bloomberg) European stocks closed little changed, posting their best weekly start to a year since 2013, after data signaled a robust U.S. labor market.
The Stoxx Europe 600 Index fell less than 0.1 percent at the close, paring a decline of as much as 0.4 percent. American wages increased the most since 2009, while a 156,000 gain in December followed a November rise that was better than previously forecast.
The European benchmark on Jan. 3 entered a bull market, months after global peers. Despite a 1.1 percent gain this week, its members are trading more cheaply than those on the S&P 500 index, on an estimated earnings basis.
The Yen challenged the Lip of the Cup with Handle.
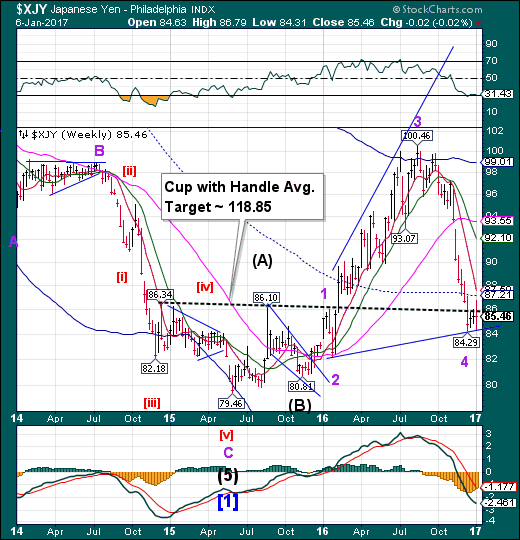
The Yen challenged the Lip of the Cup with Handle but closed beneath it.Last week I mentioned, “… the time for the Cycle turn was early and there may be a retest of the low over the next week.”That event occurred when the Yen dropped to 84.31 on Tuesday. It may now be capable of a “slingshot move” that may meet the target of the Cup with Handle formation.
(Bloomberg) The dollar weakened against the yen for a second day as minutes from the Federal Reserve’s latest meeting signaled uncertainty over how President-elect Donald Trump’s policies would impact the pace of U.S. interest-rate increases.
The minutes also touched upon the stronger dollar, which could weigh on inflation and act as a drag on growth by making U.S. exports more expensive. The greenback plunged in Asian hours, depreciating by as much as 1.7 percent against the yen, as moves were exacerbated by a rally in the yuan. The dollar has since pared its losses as traders look to U.S. jobs data released this week.
The Nikkei 225 made a marginal new high.
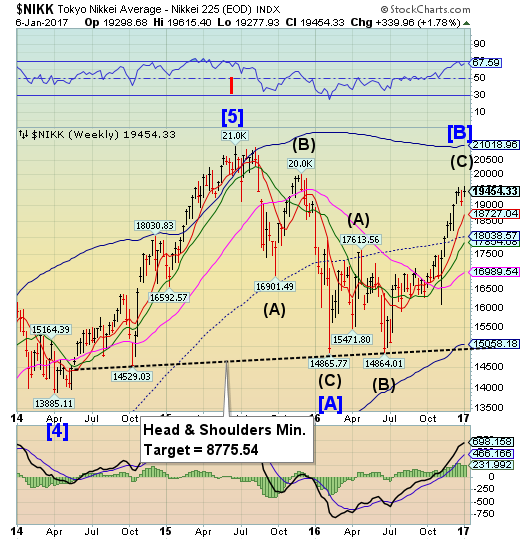
The Nikke imade a marginal new high on Thursday, after a 1-week pullback.The rally is very extended, but may offer an aggressive sell signal on a decline below 19000.00. A further decline beneath Short-term support at 18727.04 may confirm the signal.
(Reuters) Japan's Nikkei share average dropped on Friday morning as automakers dragged after incoming U.S President Donald Trump threatened to slap punitive taxes on Toyota cars imported into the United States from Mexico.
Index heavyweight Fast Retailing also dragged on the market after reporting weak monthly sales.
The Nikkei fell 0.4 percent to 19,439.24 in midmorning trade, after hitting as low as 19,354.44 earlier, although the benchmark index is up 1.8 percent for the week so far.
Fast Retailing Co dived 5.6 percent and contributed a hefty negative 91 points to the benchmark index after saying that same-store sales at its Uniqlo clothing outlets in Japan fell 5 percent in December from a year earlier.
US Dollar Index Challenged The Trendline
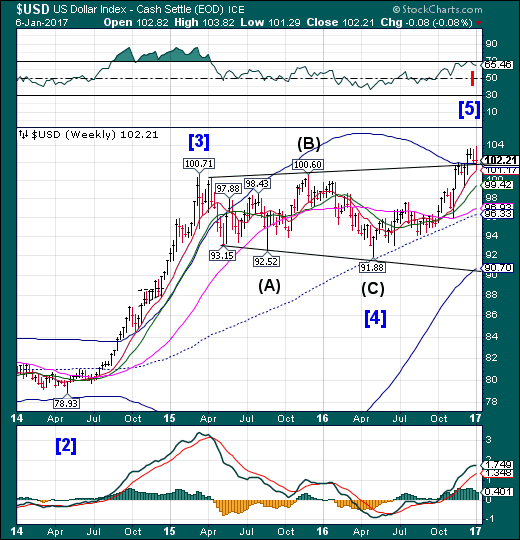
USD challenged its trendline and Cycle Top support at 101.96 again this week, suggesting a new trend may be imminent. A clear decline beneath those supportsmay give USD an aggressive sell signal. A further decline beneath Short-term support at 101.17 may change the outlook from bullish to bearish as traders find themselves wrong-footed.
(Reuters) Speculators boosted net long bets on the dollar for a third straight week on expectations of multiple U.S. rate hikes by the Federal Reserve this year, according to data from the Commodity Futures Trading Commission and calculations by Reuters.
The value of the dollar's net long position was $25.43 billion in the week ended Jan. 3, up from $24.17 billion the week before. This week's net long dollar position was the
highest since the week of Dec. 13.
There is much cause for dollar optimism especially in the wake of a December U.S. jobs report that finally showed wage growth.
Gold bounces inside the Broadening Top formation.
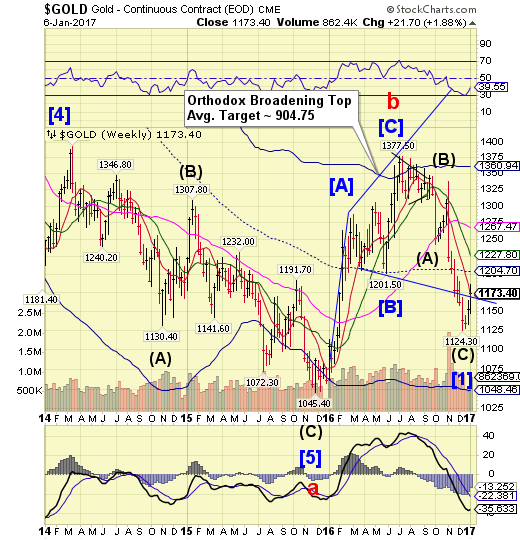
Gold rallied inside the Orthodox Broadening Top formation in its bid to meet Long-term resistance at 1267.47. The Cycles Model suggests a probable continuation of a rally that matches with the Broadening Top pattern and calls for a retracement of one-third to one-half of the decline.The rally should last another two weeks.
(Bloomberg) There’s one thing many gold traders and analysts agree on, now is a great time to own bullion.
Those surveyed by Bloomberg this week were the most bullish in a year. They cited worries over political developments in Europe, and in the U.S. following Donald Trump’s election, as well as expectations of stronger demand ahead of the Lunar New Year. After posting the biggest quarterly drop in more than two years, prices are now heading for their best weekly performance since April.
Crude Oil hit a new retracement high.
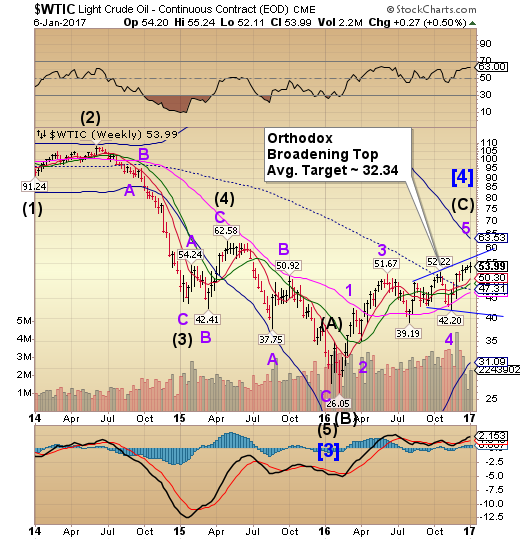
Crude appears to have hit a new retracement high on Tuesday, easing away from that high since then.Since then it completed a reversal pattern (daily charts) and may decline to challenge the lower trendline of its Broadening Wedge near 40.00.The Cycles are compressed here, making sudden moves highly probable.
(CNBC) After reversing a multiyear downtrend and breaking higher, crude oil could return to $62 a barrel by the end of the year, according to one technical analyst.
West Texas Intermediate oil, which fell Thursday after an unexpected increase in inventory, has rallied nearly 21 percent over the last two months, surging from $45 a barrel to $54 in the last few trading days of 2016. Ari Wald, head of technical analysis at Oppenheimer, has noted a multiyear bullish reversal in the charts that to Wald indicates moves closer to crude's highs in June of 2015.
"It's more recently completed a yearlong bottoming formation and, in the charts, we can see it's got a rising 200-day moving average as well," Wald said Wednesday on CNBC's "Trading Nation."
Shanghai Composite bounces off the Pennant trendline.
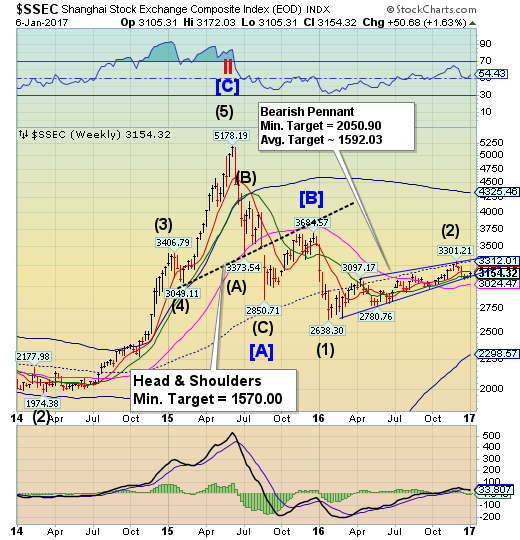
The Shanghai Index bounced off the lower trendline of its year-long Bearish Pennant formation at 3100.00,closing above it.However, Short-term resistance is at 3179.85, in opposition to a further rally.The fractal Model suggests the Shanghai is due for another 1,000 point drop, possibly starting next week. Stay on the alert for the next breakdown beneath the trendline.
(ZeroHedge) While China's unprecedented currency moves have quickly become the main talking point across global markets which otherwise have started off 2017 in an eerily calm fashion, it is the sudden surge in two-way volatility that has emerged a major threat to global market stability.
Case in point, the offshore Yuan fell as much as 1.1% to 6.8623 a dollar in Hong Kong, the most in exactly one year, after a record 2.5% surge over the past two sessions. This took place as a result of conflicting signals, as on one hand China continued to drain liquidity and sent overnight deposit rates into all time high territory, yet on the other the PBOC raised its fixing less than projected, but still the most since 2005, and Goldman Sachs advised its lients that the best time to short the yuan are just after interventions - like the recent one - which flush out bearish positions, or when China concerns were off traders’ radar screens.
The Banking Index edged higher.
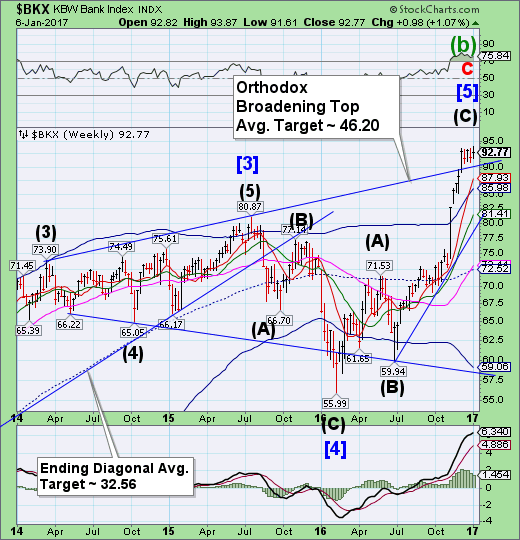
--BKX rose up to make a marginal new high on Wednesday, then settled back to close the week with a small gain.A reversal beneath the trendline at 90.0 may result in a sell signal and probable decline to the mid-Cycle support at 72.52 under normal circumstances, but the ultimate target may be the “point 6” target near 54.00. Once broken, we may expect this three-year Broadening Top pattern to unwind very quickly.
(ZeroHedge) It appears Chinese authorities are deadly serious about crushing shorts and halting speculative outflows as the liquidity freeze in Chinese markets has sent overnight deposit rates to a record 105% as one or more bank's utter desperation for funds looks like a giant fat finger.
Today's spike is up 45 percentage points from yesterday's 60% rate...
…and at the same time, PBOC strengthened the Yuan fix by the most since 2005 to narrow the gap to the massive short squeeze move in offshore yuan...
(ZeroHedge) While US equity prices push ebulliently towards their next level of Nirvana, financial conditions continue to tighten for American businesses.
For the first time since April 2009, 3-month LIBOR - one of the most important reference rates for business financing - topped 1.00% today.
We documented the real world implications of this in "Forget The Fed’s 0.25%, Short-Term Rates Have Already Risen By 1% For The Real World"
While blowing out unsecured funding rates may no longer be a flashing red flag, a question has emerged as a lot of debt references Libor, debt ranging from household debt to non-financial business debt: some $28 trillion of it, to be specific, and just in the US. The question is just how concerned will the borrowers of said debt be once they get their next due balance.
(ZeroHedge) While mortgage applications tumbled across the two-week holiday period - even seasonally-adjusted...
It was the complete collapse in the refinancings that is most notable. Down over 60% since August, the refi index crashed over 22% over the xmas/new year period to its lowest since the post-Lehman collapse in Oct 2008.
Complete bloodbath in mortgage apps...
(ZeroHedge) The confirmation of former Goldman Sachs Partner Steven Munchin, who is Trump's pick for Treasury Secretary, may have gotten just a little more problematic today, after Mnuchin declined to answer questions from Democratic senator Sherrod Brown of Ohio about his views on financial regulations, sanctions and his time as head of a bank accused of unfair foreclosure practices.
Brown, the top Democratic on the senate banking committee sent a letter on Dec. 21 asking Mnuchin to detail his position by Jan. 6 on issues that are under the committee’s purview, including fair lending laws and foreclosure-prevention programs. As Bloomberg reports, Mnuchin doesn’t plan to respond to the senator in writing, though several weeks ago he requested a meeting with Brown, who hasn’t yet accepted, according to Mnuchin’s spokeswoman Tara Bradshaw.
