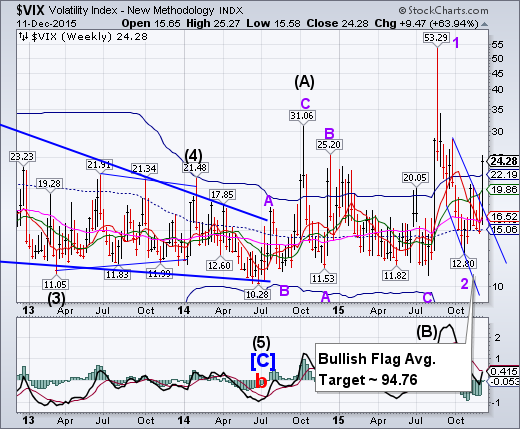
VIX ramped above its mid-Cycle support/at 15.06. In addition, it has exceeded its weekly Cycle Top support/resistance at 22.19. It has re-established a bullish trend. Don’t expect calm in the markets on Monday.
(Reuters) Stock market investors are ready for the first U.S. Federal Reserve interest rate hike in nearly a decade next week, but they may not be fully prepared for all of the nuanced remarks likely to accompany that announcement.
If the Fed lays out an aggressive schedule of future rate increases, stock markets could become very volatile and even plummet, say strategists who expect a market-calming central bank announcement detailing the patience of policymakers.
SPX declines through all supports.
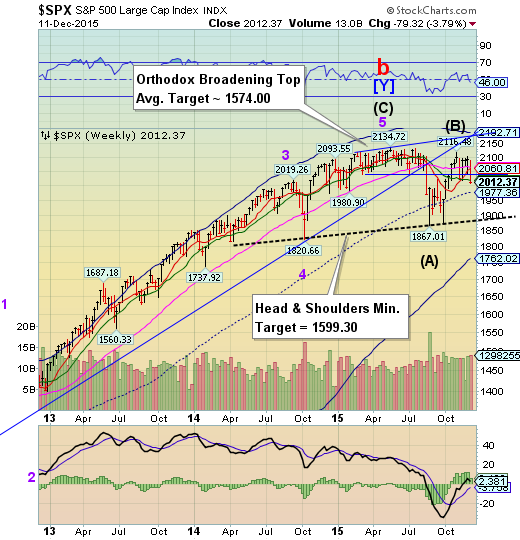
The SPX declined through its Orthodox Broadening Top trendline, closing beneath its Intermediate-term support at 2017.11. The Broadening Top formation appears to have been triggered at the open on Friday. SPX is on a sell signal
(WSJ) The S&P 500 logged its biggest weekly decline since August as the price of U.S. crude oil fell below $36 a barrel and worries about the health of the high-yield bond market intensified.
Investors have broadly sold shares of energy-related companies this week as commodities prices tumbled.
“Commodities are just scaring the heck out of people,” said Frank Ingarra, head trader at NorthCoast Asset Management.
The tumult comes ahead of the highly anticipated Federal Reserve policy meeting on Dec. 15-16, when officials are widely expected to raise interest rates for the first time in almost a decade from ultra-low levels.
NDX was repelled at its Ending Diagonal trendline.
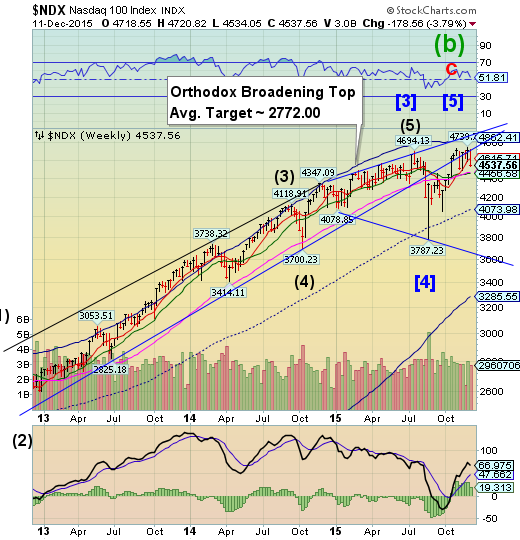
NDX was repelled at the Ending Diagonal trendline and declined through Short-term support currently at 4615.71. Point 6, which is likely to be near its Cycle Bottom support at 3285.55, may be its next target. This may happen in a surprisingly short period of time.
(ZeroHedge) Here’s one for the "actions speak louder than words" file:
Massive insider selling spurs stock market concerns
(CNBC) – Corporate insiders have been selling their shares at near-record levels, and according to some, this could be a sign for outside investors to start selling as well.
Investment research firm TrimTabs reported on Wednesday that insider selling reached $7.6 billion for the month of November, the fourth-highest monthly level on record.
High Yield Bonds break trendline support.
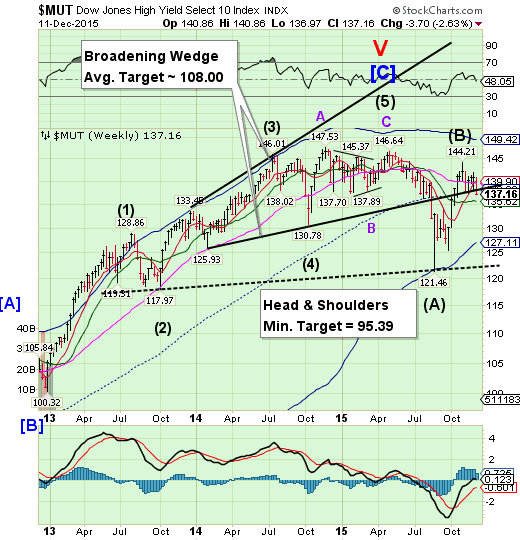
The High Yield Index broke beneath the lower trendline of its Broadening Wedge and mid-Cycle support at 138.26. The next level of support is the weekly Intermediate-term support at 135.62. Once broken, the next level of support may be the neckline of the Head & Shoulders formation.
(ZeroHedge) Now that everyone is finally looking at junk bonds with hopes to buy, sell or short as one's inclination may be, everyone is realizing something we have been warning about since 2012: when times of stress emerge, either the Bid/Ask spread is gargantuan (good luck with those "subject" quotes from dealers who have no inventory), or there is simply no market as the first hint of a buyer or seller make bond traders the carbon-based equivalent of an HFT algo, and pull their quotes. In short: there is no liquidity.
The euro consolidates, moves higher.
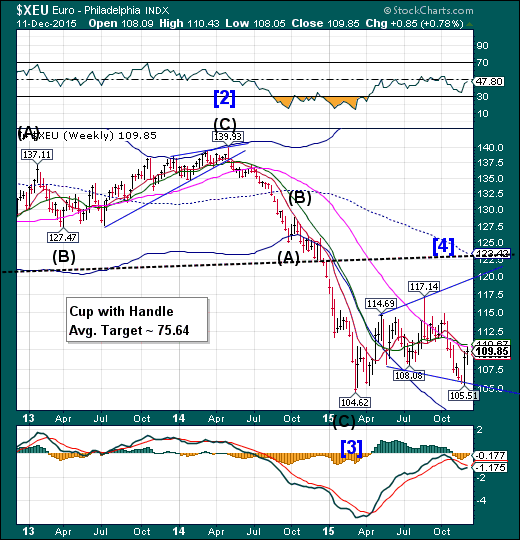
The euro consolidated this week, then moved higher to challenge Long-term resistance at 110.41 and Intermediate-term resistance at 110.67. It is likely to target the 117.00 – 120.00 range before reversing down. It is these kinds of retracements that shake out the weaker short sellers. Investment banks are backing away from the euro/dollar parity idea for now.
(ProfitConfidential) As we approach the Federal Reserve’s meeting on whether or not to raise interest rates, a long list of banks are making their predictions about where the euro to dollar outlook is headed. Goldman Sachs (N:GS), the smartest of the smart money, is predicting the EUR/USD will reach parity by the fourth quarter of 2016. (Source: “Banks Ease Expectations of Euro-Dollar Parity,” The Wall Street Journal, December 10, 2015.)
EuroStoxx triggers another Broadening formation.
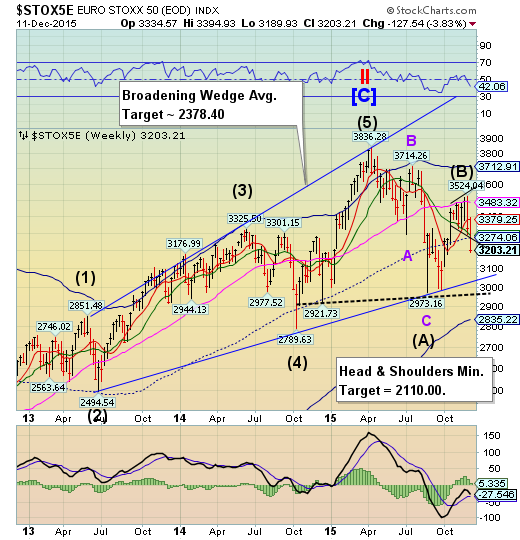
EuroStoxx 50 declined to close beneath the weekly mid-cycle support at 3274.06 in another Broadening formation that may prove to be the final reversal. Broadening formations are often precursors to panic sell-offs. Should that occur, EuroStoxx may remain in a decline through the end of the year.
(Bloomberg) A decline in European stocks deepened, sending equities to their worst week since August with only a few days to go before the Federal Reserve’s rate decision.
The Stoxx Europe 600 Index lost 2 percent at the close of trading, as all but 36 stocks fell. Carmakers and miners led declines -- Renault SA (PA:RENA) and BMW AG (MI:BMW) dropped at least 3.3 percent, while Anglo American Plc (L:AAL) and BHP Billiton Ltd. (L:BLT) slid 5.3 percent or more.
A 4 percent drop this week has dragged the Stoxx 600 to a two-month low before the Fed’s Dec. 16 meeting, at which traders are pricing in a 74 percent chance that officials will raise rates. The benchmark has lost 7.8 percent this month amid a rout in commodities and disappointment over the European Central Bank’s last meeting, defying a seasonal trend that has yielded gains in five of the past six Decembers.
The yen sports a Bullish flag.
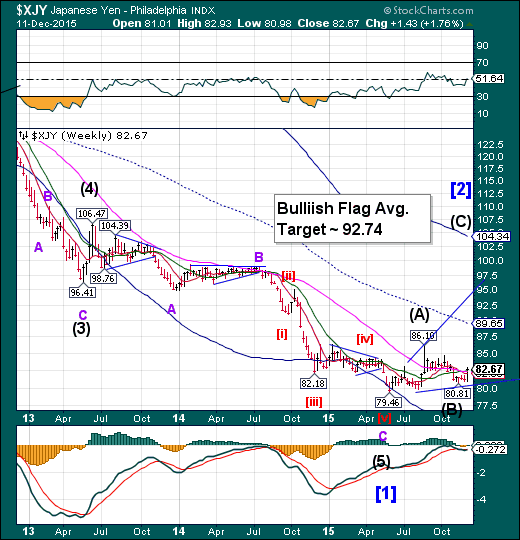
The yen appears to have completed a bullish Flag formation on November 18 and appears to be building a base that implies a target at or above mid-Cycle resistance at 89.83. The bounce may only last another week.
(NikkeiAsianReview) The standard expectation that a weakening yen lifts Japanese stock prices has not been borne out in recent months.
With the U.S. Federal Open Market Committee widely anticipated to hike the key interest rate at its meeting next week, many market participants see the Japanese currency softening against the dollar in the long term. Still, the view that it could strengthen in the short term has prompted investors to steer clear of exporter stocks for now. But they may want to note the recent shift in the relationship between Japanese shares and the yen's exchange rate.
The Nikkei declined through its Broadening Wedge.
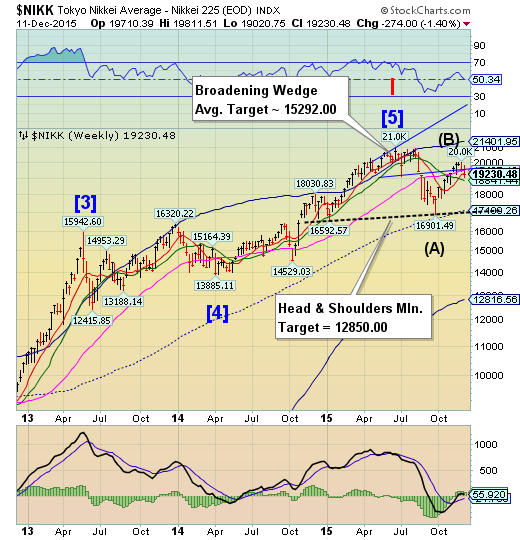
The Nikkei declined through the lower trendline of its Broadening Wedge at 19475.00. A decline beneath the Broadening formation implies a probable 20% correction may follow. A probable reversal appears to be underway, with weakness in the Cycle showing for the next two weeks. The Nikkei may experience a flash crash that has a better-than-even probability of also triggering the Head & Shoulders formation in that interval.
(Reuters) Japanese stocks rose for the first time in four sessions on Friday, helped by gains on Wall Street and a weaker yen, but investors remained cautious before big events next week.
The Nikkei share average rose 1 percent to 19,230.48, snapping a three-day losing streak. The benchmark fell 1.4 percent for the week, pressured largely by energy shares on weak oil prices.
The broader Topix rose 0.6 percent to 1,549.51 and the JPX-Nikkei Index 400 also gained 0.6 percent to 13,942.97.
U.S. dollar falls beneath Short-term support.
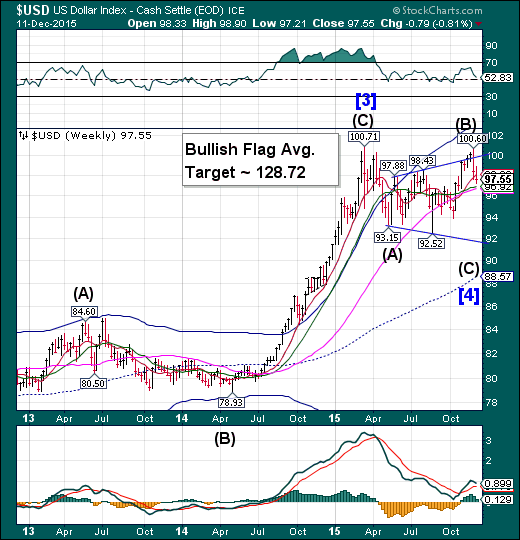
The US dollar declined through its weekly short-term support at 98.09 while also signaling a continuation of the decline. The Cycles Model calls for a pullback that may decline to trendline support near 92.00. The Cycles Model calls for a Master Cycle low by mid-December, so this decline may be rather fast. Speculators may be caught the wrong way in their positons, causing a panic among the longs as this decline has the potential of wiping out all 2015 gains in the dollar long position. There is a lot of potential fuel to make this happen.
(Reuters) Speculators reduced bullish bets on the U.S. dollar in the latest week, according to Reuters calculations and data from the Commodity Futures Trading Commission released on Friday. The value of the dollar's net long position slipped to $41.22 billion in the week ended Dec. 8, from $43.47 billion the previous week. Speculators have trimmed their net long position on the dollar for a second straight week. The U.S. dollar index has risen more than 8.0 percent so far in 2015, boosted all year by expectations that the Federal Reserve would be the first major central bank to raise interest rates this year. In fact, markets have fully priced in a lift-off next week, and the only issue being debated is the number of rate increases over the next few years.
USB emerges above overhead resistance.
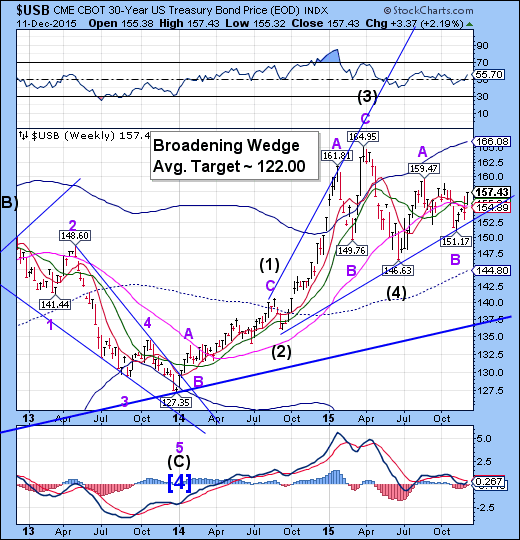
The Long Bond emerged above Intermediate-term resistance at 155.61 as its next rally higher gains traction. The Cycles Model suggests a period of strength lasting for another week or longer.
(Bloomberg) Treasury 30-year bonds advanced for the fourth time in five days as tumbling inflation expectations overshadow an anticipated Federal Reserve interest-rate increase next week.
Yields on 30-year bonds declined as oil prices fell for a fifth day to a six-year low. A bond-market gauge showed annual consumer-price increases over the next 10 years at 1.54 percent, the lowest on an intraday basis since Nov. 16. The U.S. is poised to sell $13 billion of 30-year securities Thursday.
"We really don’t have an issue on inflation," said Larry Milstein, managing director of government-debt trading at R.W. Pressprich & Co. in New York. "That’s keeping a cap on rates."
The gold rally remains weak.
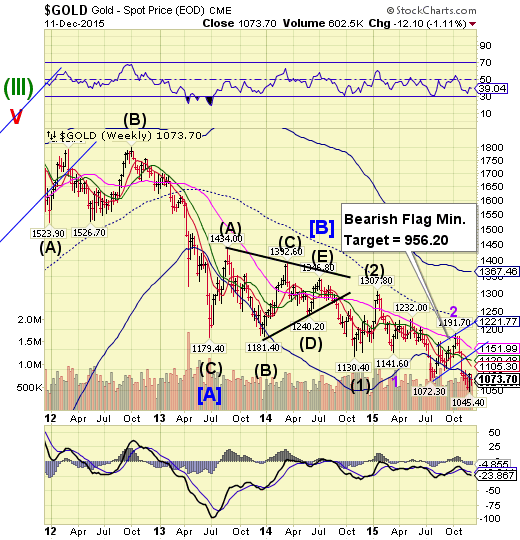
Gold made several attempts to break out above its Cycle Bottom resistance at 1076.08 but was repressed by that resistance. There may not be much time left for this retracement to go higher. The Cycles Model anticipates both time and price, which may have been accomplished this week. Any further attempt at a rally may be short-lived and rather inconsequential.
(WSJ) Gold prices rose Friday as a drop in the value of the U.S. dollar burnished the dollar-denominated metal’s allure to foreign buyers.
The most actively traded contract, for February delivery, rose $3.70, or 0.4%, to settle at $1,075.70 a troy ounce on the Comex division of the New York Mercantile Exchange.
Gold prices rebounded from one-week lows after the dollar retreated against the euro and the yen on Friday. The ICE Dollar Index, which tracks the buck against a basket of other currencies, slumped to 97.32 earlier and was recently trading down 0.3% at 97.59.
Crude takes the plunge.
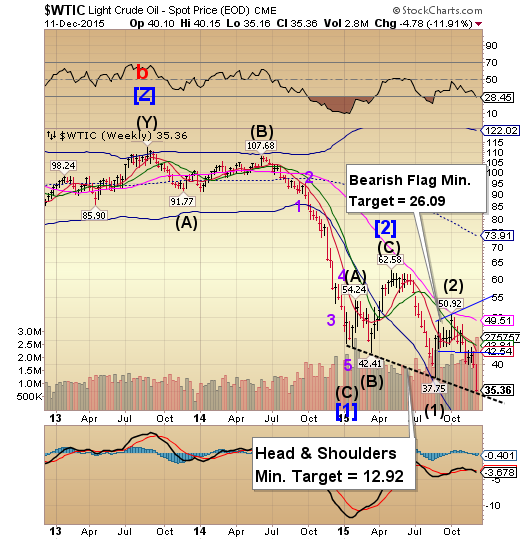
Crude plunged dramatically, challenging a potential head & Shoulders neckline at 35.00. This is a very left-oriented Cycle pattern, implying extreme bearishness. The probability of a decline to the Flag target is running high. The Cycle Bottom Support is at 25.79 supports this view. Note the new Head & Shoulders neckline that is down-sloping and bearish.
(Reuters) Oil prices extended their freefall on Friday, flirting with 11-year lows, after the International Energy Agency (IEA) warned that global oversupply of crude could worsen next year.
Brent and U.S. crude's West Texas Intermediate (WTI) futures fell as much as 5 percent on the day and 12 percent on the week as mild pre-winter weather and a plummeting U.S. stock market added to the toll on oil prices.
Oil traders and analysts alike have been perplexed by oil's decline since the Dec. 4 meeting of the Organization of the Petroleum Exporting Countries which all but abandoned price support for crude by removing OPEC's production ceiling in an oversupplied market.
Shanghai Index declines through Short-term support.
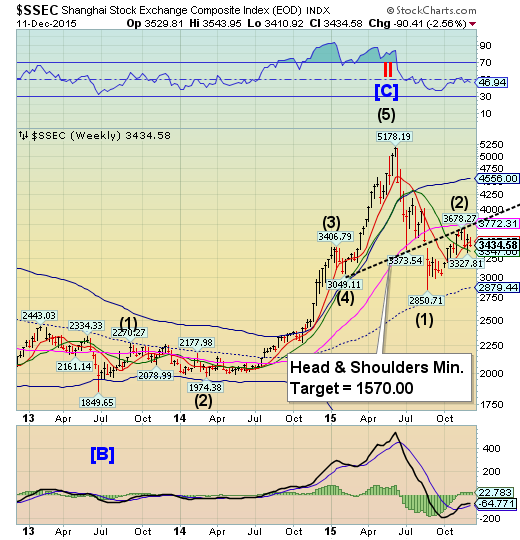
The Shanghai Index declined beneath Short-term support at 3487.07, closing less than 90 points above Intermediate-term support at 3347.66. The recent rally may also be considered a bearish Flag formation that may have a greater potential decline than the Head & Shoulders pattern.
(ZeroHedge) One of the recurring topics we have focused on extensively in the past few months has been the dramatic collapse of all shipping-related metrics when it comes to seaborne trade with China, from the recent record plunge in the Baltic Dry index...... to Shanghai Containerized Freight...... both of which are taking place even as China exports record amount of commodities to the outside world...
We have also repeatedly noted that the implications for both China, and the entire world, from these charts are dire because they suggest that not only is China not growing, but the entire world is now gripped in not only an earnings and GDP (in USD-denominated terms, global GDP is set to decline by several trillion dollars) recession, but also suffering its first trade contraction since the financial crisis.
The Banking Index declines beneath all nearby supports.
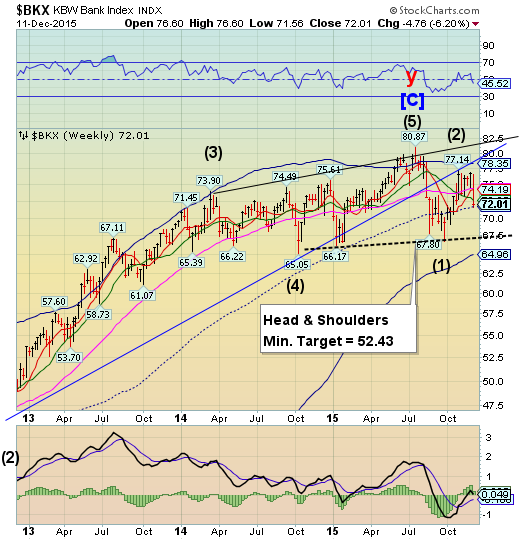
BKX declined through Intermediate-term support at 72.65 to challenge mid-Cycle support at 71.65. It is overdue for a Master cycle low which may arrive this week. Declining beneath the weekly mid-Cycle support implies a potential change in trend may be at hand. There seems to be a lack of awareness of the magnitude of a potential decline.
(ZeroHedge) At the peak of the craziness of the last cycle, banks took to protecting themselves by buying (credit) protection on other banks as a 'hedge' for systemic risk (which instead exacerbated contagion concerns,seemingly missing the facts that their bids drove risk wider, increasing counterparty risks, and that the inevitable collapse required to trigger these trades would also mean the payoffs to the 'hedges' would never be realized). Fast forward 8 years and it appears once again, as Bloomberg reports, that banks are buying (equity) protection in order to hedge the stress-test downside scenarios enforced by The Fed.
For more than a year, dealers in the U.S. equity derivatives market have noted a widening gap in the price of certain options.
If you want to buy a put to protect against losses in the Standard & Poor’s 500 Index, often you’ll pay twice as much as you would for a bullish call betting on gains.
(ZeroHedge) “Chairman of GuotaiJunan Int'l, 1 of China's largest brokerages, is "missing"; company said can't find him”
Regular readers are likely familiar with the quote excerpted above, but for anyone who might have missed the original story, that’s from George Chen and when it hit Twitter (N:TWTR) late last month we couldn’t help but laugh because after all, it’s not every day that a publicly traded company comes out and says they can’t find their CEO.
As strange as the statement might have seemed to the uninitiated, for those who’ve followed China’s equity markets this year it wasn’t hard to imagine what might have happened to Yim Fung.
(Yahoo (O:YHOO)) Italy was working Friday to set up a solidarity fund to help small investors who lost money in the rescue last month of four regional banks, following the suicide of a man whose life savings were wiped out.
Finance Minister Pier Carlo Padoan told parliament's budget committee that the government was "preparing a directive for the creation of a fund," as police seized documents from one of the banks as part of a probe into the pensioner's death.
(WSJ) Chinese lending rose last month as banks ramped up new loans to higher-than-expected levels, though economists questioned whether it would be enough to help the country’s sluggish fourth-quarter growth.
Chinese financial institutions issued 708.9 billion yuan ($110.10 billion) of new yuan loans in November, up from 513.6 billion yuan in October and above economists’ expectations, data from the People’s Bank of China showed Friday. Newly extended loans last month were above the 600 billion yuan forecast by a Wall Street Journal poll of 13 economists.
Total social financing, a broader measurement of credit in the economy, was at 1.02 trillion yuan ($158.41 billion) in November, up from 476.7 billion yuan in October.
