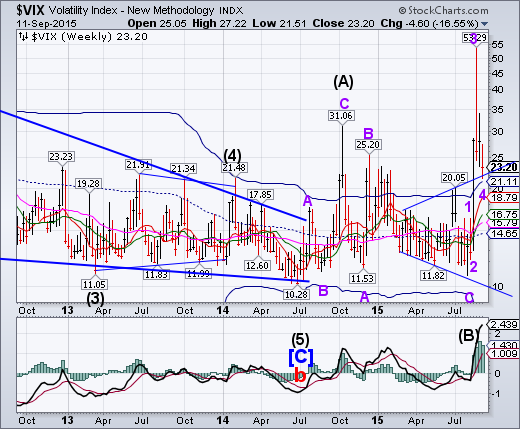
VIX has tested the Broadening formation high and its Weekly cycle Top support at 21.11. It is still in the danger zone and may be ready for another liftoff. It may be pricing in more economic damage to come.
The SPX is poised above mid-Cycle support.
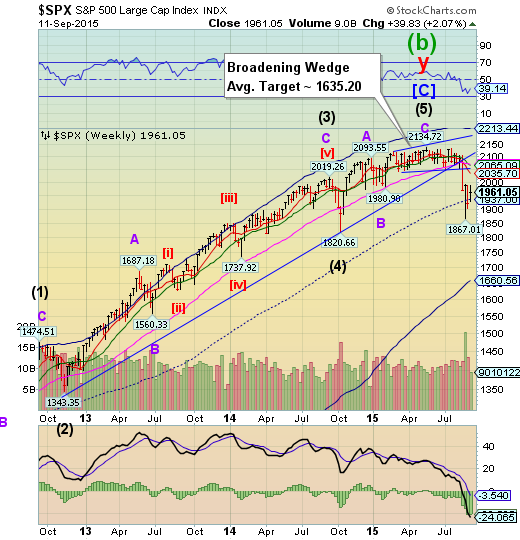
SPX has been testing mid-cycle support at 1937.00. It has not been able to better its August 28 high at 1993.48. This leaves SPX vulnerable to a decline to its weekly Cycle Bottom at 1660.56 in the very near term.
(StreetTalkLive) This past week has seen a continuation of market volatility unlike anything witnessed over the last several years. Of course, this volatility all coincides at a time where market participants are struggling with a global economic slowdown, pressures from China, collapsing oil prices, a lack of liquidity from the Federal Reserve and the threat of rising interest rates. It is a brew of ingredients that would have already likely toppled previous bull markets, and it is only by a hairsbreadth the current one continues to breathe.
NDX regained last week’s losses as sentiment soars.
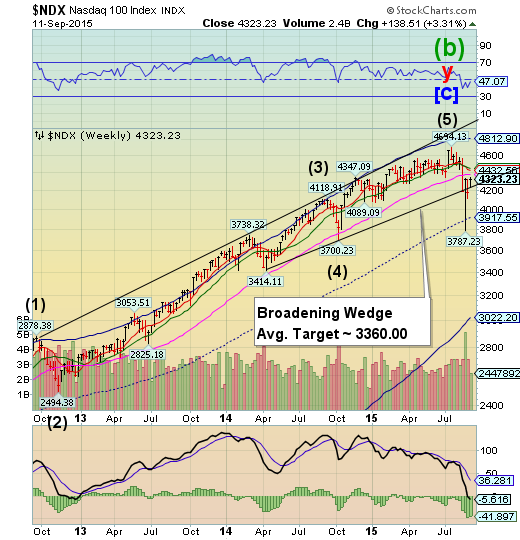
NDX came within 6 points of regaining its losses from last week while using the lower trendline of its Broadening Wedge for support. However, it remains beneath its Long-term support at 4432.56, which is critical to regain its uptrend since 2012. If trendline support fails, it is likely that mid-Cycle support may also fail, leaving the Broadening Wedge target or its Cycle Bottom at 3022.30 as the next targets.
(ZeroHedge) Given current market volatility and the increasing amount of evidence showing that the global central bank money printing orgy of recent years has utterly failed to produce a so-called “self-sustaining” recovery, it is quite odd how nonchalant investors remain about the outlook for “risk assets” such as stocks.
High Yield Bonds have an “inside week."
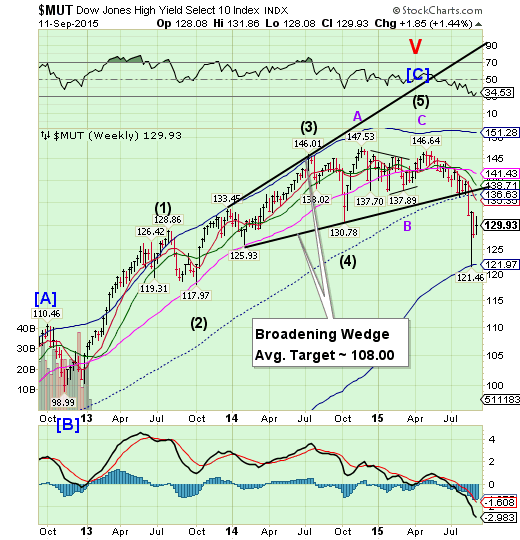
TheHigh Yield consolidated within the confines of its previous week’s range. Although an inside week denotes uncertainty, it usually indicates a continuation of the prior trend after the consolidation is over. There is a good probability of MUT meeting its Broadening Wedge target in a short period of time. New lending in the high yield arena has come to a standstill for the past two weeks.
(MarketRealist) Investor flows in high-yield bond funds remained in negative territory last week for the second successive week. According to Lipper, net outflows from high-yield bond funds totaled $226.6 million in the week ended September 2, compared to net outflows of $1.6 billion in the previous week. These outflows led to total outflows from high-yield bond funds of $4.3 billion year-to-date.
(MarketRealist) There was no high-yield bond issuance in the week ended September 4, 2015. This marked the second successive week in which high-yield bond issuers gave the primary market a miss. High-yield bonds are tracked by the SPDR Barclays (LONDON:BARC) High Yield Bond ETF (NYSE:JNK) and the iShares iBoxx $ High Yield Corporate Bond ETF (NYSE:HYG).
The euro challenges Long-term resistance.
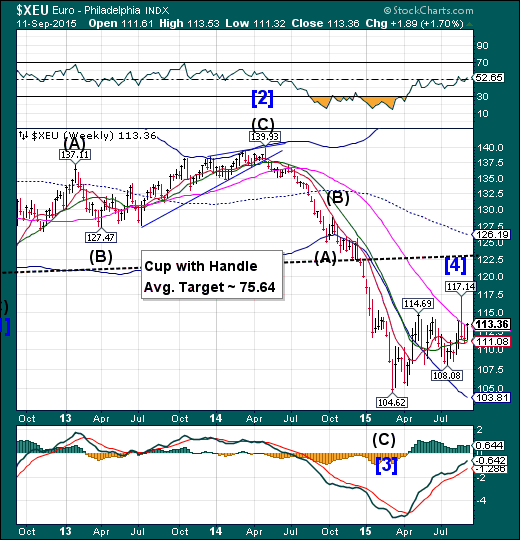
The euro bounced off weekly Intermediate-term support at 111.08 to challenge Long-term support/resistance at 113.10. The surge in the euro was primarily due to the demand for the local currency as European stocks were sold. It is probable that another selling bout in stocks may send the euro even higher.
(WSJ) Europe’s common currency and the Schengen passport-free zone are the European Union’s most ambitious undertakings. Not coincidentally, they are also the two European projects that have most called into question the future of the bloc.
Together, they have probably made the most difference to the lives of ordinary people, allowing them to travel across much of Europe without having to change money or deal with border controls. For national governments to have freely abandoned such critical components of sovereignty as their currencies and control over their frontiers is remarkable.
EuroStoxx loses its mid-Cycle support.
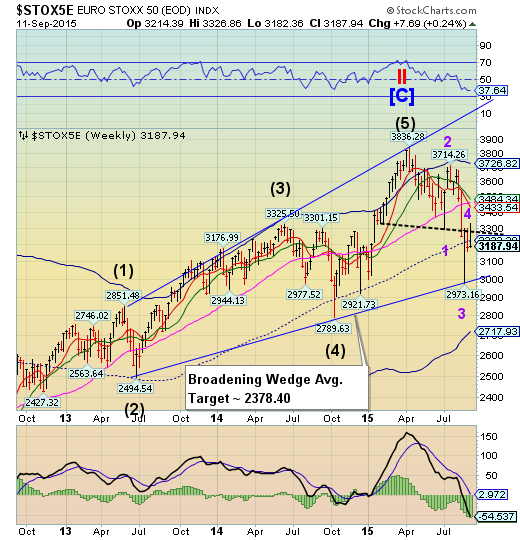
EuroStoxx 50 rallied again to challenge the resistance line of its Cup with Handle formation and closed back beneath mid-Cycle support at 3222.38. The Cycles Model suggests another possible week in a panic decline that may end beneath the October 2014 low..
(CNBC) European markets closed lower on Friday, as investors' focus remained on next week's meeting of the U.S. Federal Reserve.
The pan-European STOXX 600 closed down around 1 .0 percent down on the day and 0.7 percent up on the week after Wall Street stocks opened lower on Friday.
London's benchmark FTSE 100 index ended down by roughly 0.6 percent, while Germany's DAX was 0.9 percent lower and France's CAC was off by more than 1.0 percent.
The yen closes above Long-term support.
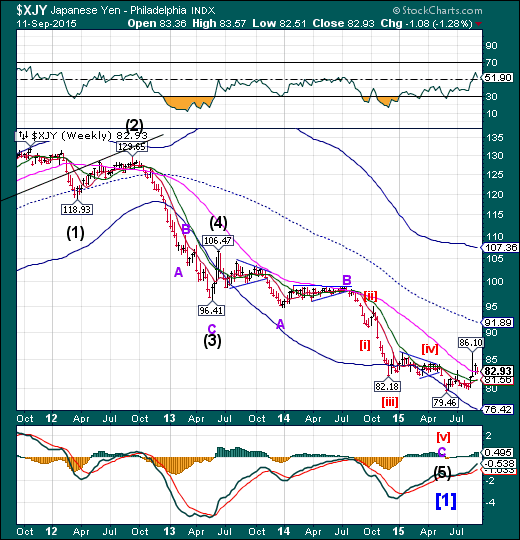
The yen found support just above Long-term support at 82.81 as it consolidated this week. It may emerge to challenge its weekly Cycle Top at 107.36 through the balance of September. Another breakout above 86.10 may confirm the actionable signals, as a rally in the yen is evidence of an unwinding of the yen carry trade may be underway due to falling equities.
(TheFiscalTimes) - The yen has "a bit more" room to fall before its costs outweigh the benefits, one of the architects of the reflationary policies of Japanese premier Shinzo Abe said on Friday, dismissing fears that more monetary easing could fuel unwelcome declines.
The Bank of Japan can hold off on action next week but should expand stimulus as early as its meeting on Oct. 30 to counter weakness in the economy, said Yamamoto Kozo, a ruling party lawmaker and close economic aide to Abe.
"I can see how the BOJ would prefer to stand pat (next week) because there's not enough data to scrutinize," Yamamoto told Reuters on Friday.
"But the economy is not doing well ... It would be strange not to ease if the BOJ were to cut its growth forecasts."
The Nikkei has resumed its decline beneath support.
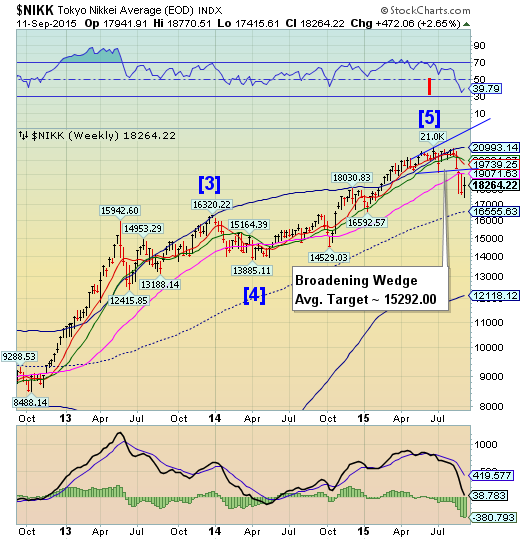
The Nikkei resumed its decline after being rebuffed at its weekly Long-term resistance at 19071.63. It has also made a new low, losing it ability to rally until the next lower support is tested. In this case, the Broadening Wedge target is below weekly mid-Cycle support, so the decline may not find support there.
(Bloomberg) On Sept. 8, as the stock market slumped, investors were surprised to find the Bank of Japan, normally a buyer of exchange-traded funds on the Tokyo bourse, absent.
What happened? The central bank, which is authorized to purchase about 3 trillion yen ($25 billion) in equity ETFs a year, is running out of ammunition, having spent 78 percent of its total as of Sept. 7. Because the BOJ usually buys on days the market falls, it sped up amid a rout in the Topix index.
Now it must slow down for the rest of 2015 or increase its allotment, according to Mitsubishi UFJ Morgan Stanley Securities Co (NYSE:MS).
U.S. dollar slides back to Long-term support.
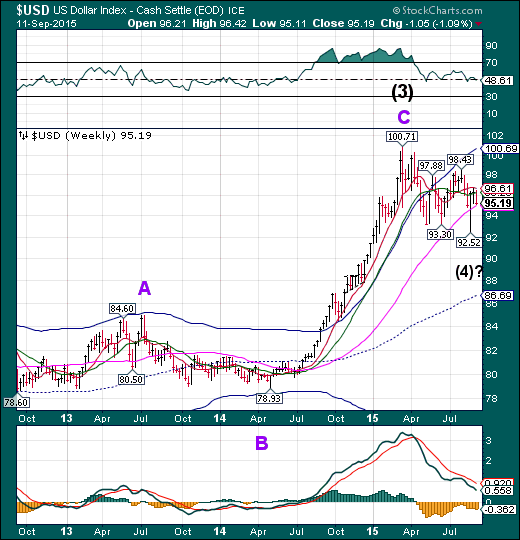
The US dollar retested its weekly Long-term support at 95.08 this week, closing just above it. The Cycle Model suggests new lows may be possible through mid-October.
(Reuters) Speculators raised bullish bets on the U.S. dollar for the first time in four weeks, according to Reuters calculations and data from the Commodity Futures Trading Commission released on Friday.
The value of the dollar's net long position rose to $22.07 billion in the week ended Sept. 8, from $21.61 billion the previous week. That said, this was the third straight week U.S. dollar longs have come in below $30 billion.
To be long a currency is to make a bet it will rise, while being short is a bet its value will decline.
USB turns down.
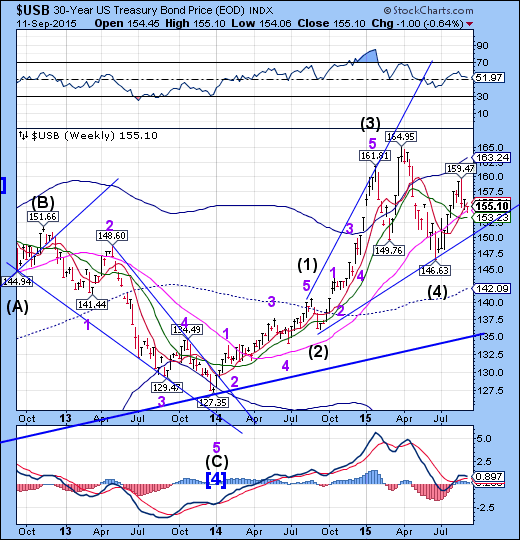
The Long Bond challenged Long-term support at 154.30 in a negative week. Selling pressure may intensify next week as the Chinese government scrambles for liquidity. This may overpower other investors seeking a haven as markets continue to turmoil over the next week.
(ZeroHedge) Earlier this week we warned that based on the latest Gallup poll of some 15,000 US shopping adults (and thus far more accurate than the Department of Commerce seasonally adjusted, goal-seeked retail sales data), retail spending in August will be a stark disappointment to those once again holding off for a rebound in that all important driver for the US economy - consumer spending. As we showed, August spending was the weakest in nominal dollar terms since 2012...
... and was also the lowest since March, as a result of 4 consecutive months of y/y spending declines.
Gold closes at Cycle Bottom support.
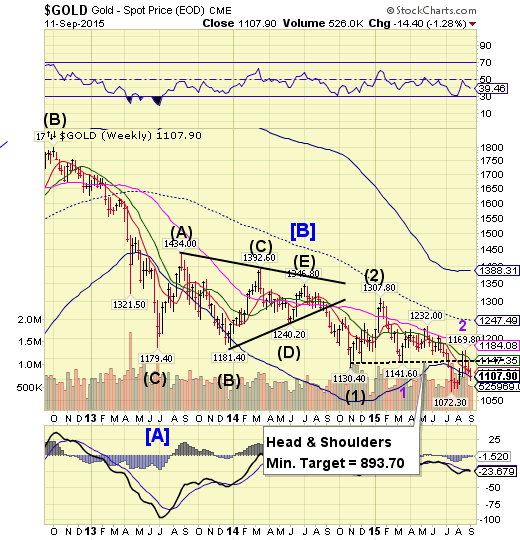
Gold closed just above Cycle Bottom support at 1106.68 after breaking through. The downtrend may now resume with greater intensity. The next immediate target for the rally may be new lows beneath 1072.30.
(ZeroHedge) Update: Earlier today, we said that we would "keep a close eye on today's Comex update to see if JPM reverses this "adjustment" and adds at least a few more tons of deliverable gold to its vault." Moments ago, we got the daily update from the Comex and not only did JPM not reverse its registered to eligible adjustment, but more curiously, the second largest vault, that of Scotia Mocatta (behind only HSBC) saw a comparable adjustment, whereby 16,644 ounces of gold, or about half a ton, and 14% of its vault total, were adjusted away from "registered" and into the "eligible" category.
This means that the already record low total registered holding across the Comex system, declined once again this time by 8.3% and hit a new all time low of 185,315, or less than 6 tons.
Crude closes beneath Short-term resistance.
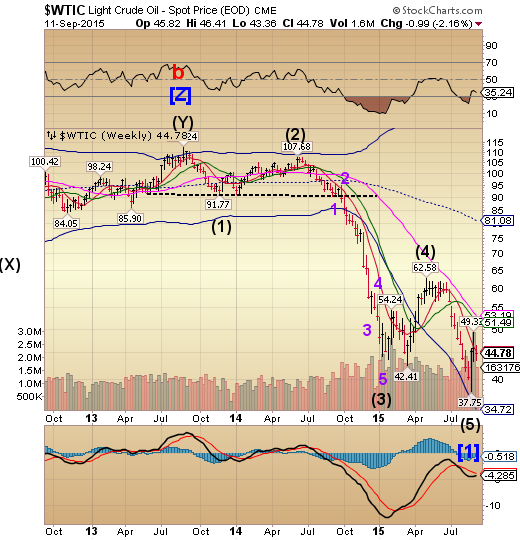
Crude consolidated this week, but closed beneath Short-term resistance at 45.29 for a second week. There is a possibility of an extended low, since the Cycle Bottom offers no support at this time. Contrary to the report below, there is an increasing probability of a rally should crude find support above the August 24 low.
(FuelFix) The global surplus of oil is even bigger than Goldman Sachs Group Inc (NYSE:GS) thought and that could drive prices as low as $20 a barrel.
While it’s not the base-case scenario, a failure to reduce production fast enough may require prices near that level to clear the oversupply, Goldman said in a report e-mailed Friday while cutting its Brent and WTI crude forecasts through 2016. The International Energy Agency predicted that crude stockpiles will diminish in the second half of next year as supply outside OPEC declines by the most since 1992.
“The oil market is even more oversupplied than we had expected and we now forecast this surplus to persist in 2016,” Goldman analysts including Damien Courvalin wrote in the report. “We continue to view U.S. shale as the likely near-term source of supply adjustment.”
Shanghai Index may have finished its consolidation.
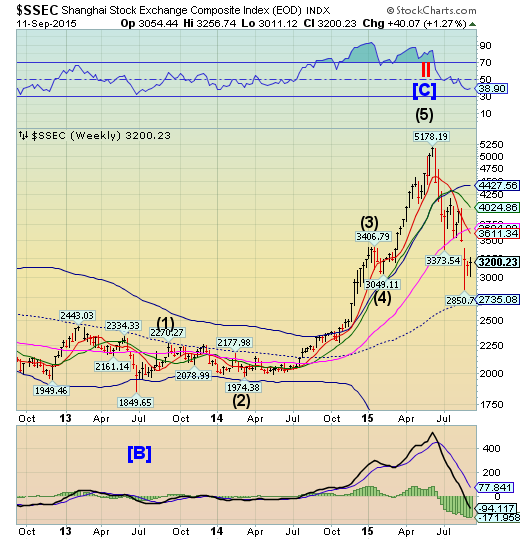
The Shanghai Index closed higher this week, but the consolidation may be complete. The market opens on Sunday evening to its first test to see whether the PBOC intervention has worked.
(AsiaTimes) China’s decision to lets its currency float, and fall, last month proved to be a very expensive choice.
The People’s Bank of China on Monday said that the country’s foreign-exchange reserves plummeted a record amount in August as it tried to stabilize the yuan.
After the central bank devalued the currency on Aug. 11, stock markets around the world tumbled on fears the world’s second-largest economy was slowing at a much faster rate than expected. The move sent the yuan lower than expected and the PBOC spent $93.9 billion, the largest-ever monthly drop in dollar terms, to prop up the yuan and prevent it from falling further.
The Banking Index challenges mid-Cycle support.
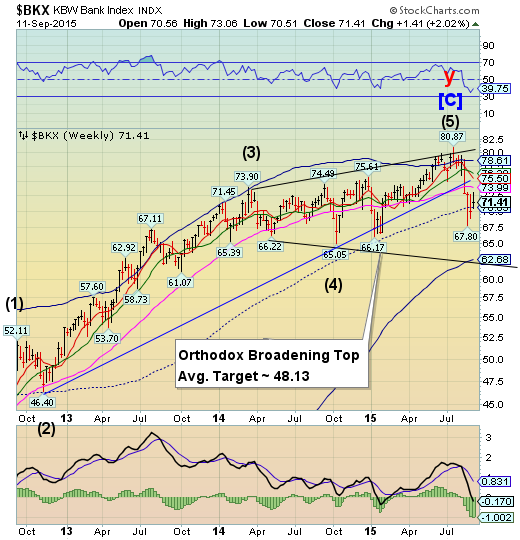
BKX managed a third week of consolidation above mid-Cycle support/resistance. However, the Cycles Model suggests that the decline may intensify very quickly next week for a possible drop to or beneath the Weekly Cycle Bottom at 62.68 or lower once mid-Cycle support is broken.
(ZeroHedge) We have been anxiously reminding investors of the drip-drip-drip increases in market-perceived credit risk for US financials for much of 2015. Having risen to almost 90bps amid the chaos of 2 weeks ago (almost double the lowest levels post-Lehman hit in June of last year), it appears systemic counterparty risk is very much on the rise. What is more concerning, however, as Alhambra's Jeffrey Snider notes, the TED spread has exploded higher (since China's devaluation) indicating, as convention has it, a marked increase in perceptions of interbank credit risk.
"Credit" risk perceptions have risen rapidly...
(ZeroHedge) Now that Europe’s fractionally reserved banking system has been regulated into complete inertia, it is a good time to assess the current bottom line, so to speak. We should mention here that there are essentially two ways of dealing with the banking system. One is to introduce an unhampered free market banking system based on strong property rights and nothing else. Such a system would work best if it were based on sound money, i.e., a market-chosen medium of exchange. The regulations governing such a system would fit on a napkin.
(WSJ) Wall Street’s biggest banks have agreed to a tentative settlement over allegations that they conspired to rig the market for credit derivatives.
Twelve banks and two industry groups reached the preliminary agreement with plaintiffs in a civil lawsuit to pay $1.87 billion to settle the accusations, a milestone stemming from long-running probes into that corner of the financial system. Investigations by U.S. and European authorities into the credit-derivatives market are continuing.
(WSJ) BEIJING—China’s bond market and its informal lenders stepped up in August, putting more money into the economy even as the country’s skittish banks stepped back and growth appeared to slow further.
Total social financing, a broader measurement of credit in the world’s No. 2 economy, totaled 1.08 trillion yuan (about $169 billion) in August, up from 718.8 billion yuan in July, according to People’s Bank of China data Friday. The figure includes bank loans to the real economy, bonds and “shadow lending” by nonbank firms.
