Macquarie updates 2026 outlook for gold and silver. Here are the new targets
Weekend Update
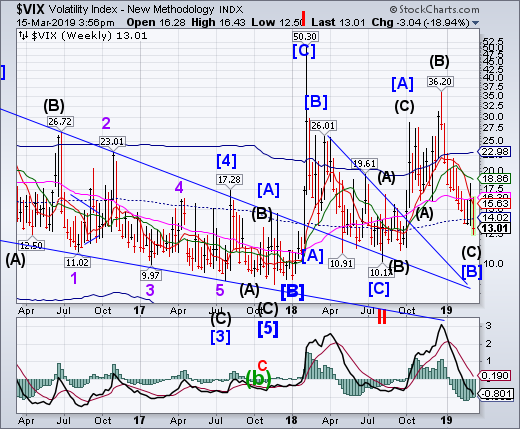
VIX extended its Master Cycle low at 12.50 on Friday, giving a nod to options expiration. It is in a similar position as it was on the last week of September after making its Master Cycle low on options expiration day.
(Bloomberg) The lack of market volatility -- or swings in the prices of securities -- has claimed one of its most high-profile victims.
Argentiere Capital is returning capital to investors from its flagship $940 million hedge fund after years of unsuccessful wagers on rising market turmoil, according to a person with knowledge of the matter.
SPX Surges At Long-Term Support
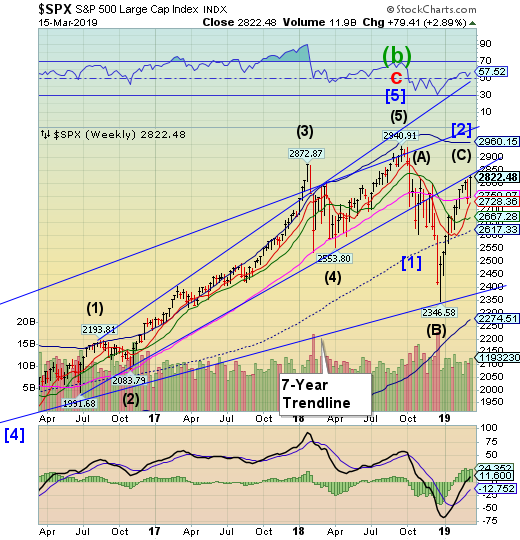
SPX reversed above Long-term support to retest the 3-year trendline again. The rally is over 11 weeks long with the Economic Surprise Index at a 6-year low. The pattern is known as an Expanded Flat, where Wave (C) reaches maximum resistance when it reaches the top of Wave (A).
(ZeroHedge) After 13 weeks of near constant selling by institutional and retail investors, which as we noted last Friday resulted in the worst start to a year for equity flows since 2008, paradoxically even as the market was grinding ever higher...
(Bloomberg) That relief investors felt in January when the Federal Reserve took its dovish pivot is showing signs of turning into something bigger.
A feeling approaching bliss was on display this week when ahead of Wednesday’s rate decision the S&P 500 staged its biggest rally of the year and more money flowed into equity funds than any time in 12 months. Rising 2.9 percent, the S&P 500 posted its largest gain of any pre-rate decision week since December 2016.
NDX Soars On Retail Inflows
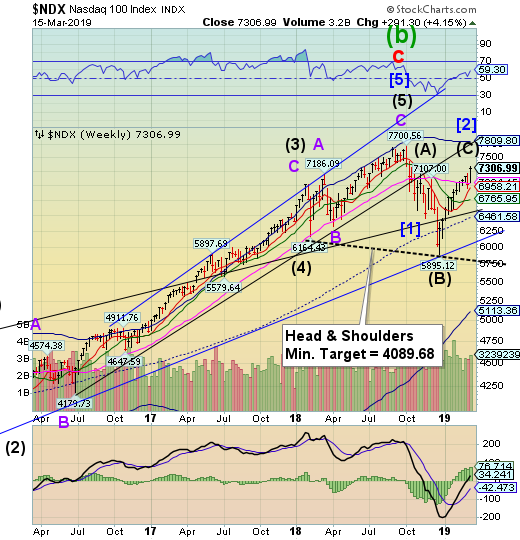
NDX soared above Long-term support at 7034.15 Monday, allowing it to rise to a new retracement high. Retail investors rushed in to buy the dip while institutions lightened their stock allocations.
(CNBC) Four climbing FAANG stocks could be poised for an even sharper rally.
The frequently tied-together stocks of Facebook (NASDAQ:FB), Amazon (NASDAQ:AMZN), Apple (NASDAQ:AAPL), Netflix (NASDAQ:NFLX) and Google parent Alphabet (NASDAQ:GOOGL) are outpacing the broader market for 2019, locking in double-digit gains for the year. Two market watchers see more runway ahead of some of the names.
“This week is very important,” Mark Newton of Newton Advisors told CNBC’s “Trading Nation” on Monday. All five FAANG stocks climbed higher this week as of Tuesday’s close.
High Yield Bond Index Soars To A New High
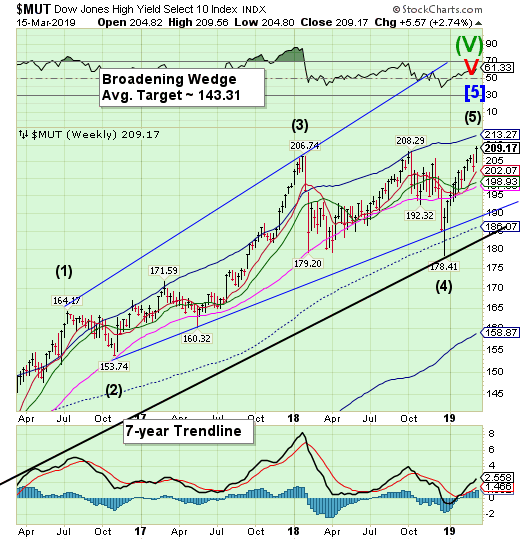
The High Yield Bond Index soared this week to a new all-time high.This puts junk bonds in a class all by themselves. Unfortunately, in the search for yield, investors are ignoring warnings of declining covenant protection.
(IBD) As investors search for higher returns amid falling Treasury yields, they're pouring billions of dollars into exchange traded funds that track junk bonds.
The $9.3 billion SPDR Bloomberg Barclays (LON:BARC) High Yield Bond ETF (JNK) has seen seven straight days of inflows — the longest streak in six months. About $1.1 billion has been injected into the fund since March 5, boosting its assets by 13%.
Similarly, the $15.2 billion iShares iBoxx High Yield Corporate Bond ETF (HYG) has seen three straight days of inflows. Investors piled more than $843 million into the fund through Wednesday.
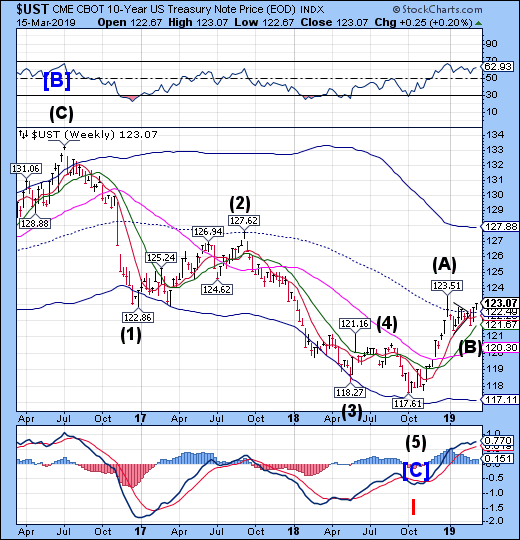
The 10-year Treasury Note Index rose above its recent consolidation high at 122.80 and appears to be approaching its December high for a potential breakout.It is currently on a buy signal with a potential target at the Cycle Top resistance at 127.88.
(ZeroHedge) With both the Dow, and the broader market saved - for now - from an embarrassing Quad Witch slump by news that Boeing (NYSE:BA) is set to roll out a software upgrade for its 737 MAX airplanes (how a software update will fix what many now see as a hardware issue is unclear, nor is it clear how Boeing effectively admitting guilt for the death of hundreds of people which will unleash billions in lawsuits is bullish), bond yields will have none of it and as we showed earlier, the buying ramp across asset classes is the latest confirmation that equities are not trading on fundamentals (as bonds price in the continued deterioration in the US economy), but merely frontrunning QE4.
The Euro Bounces… Again
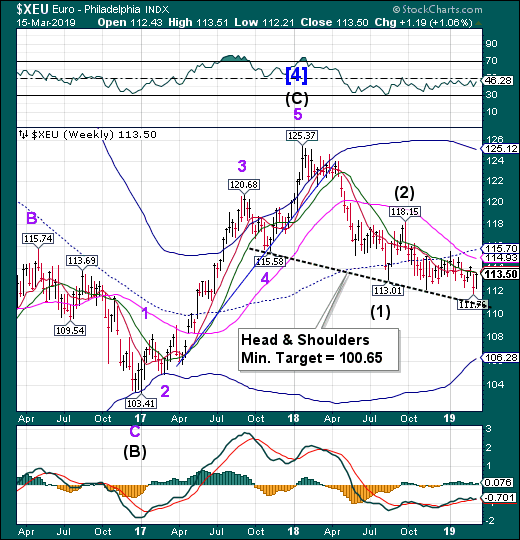
The euro rose for air again but did not rise above Intermediate-term resistance at 113.60. Multiple attempts to ignite a momentum-based rally have failed. There is a potential Head & Shoulders formation near 110.00 that suggests a downside target that may be attained in the next month.
(Economist) It is hard to defend yourself with one hand tied behind your back. Yet the euro area’s economy has been repeatedly asked to do just that. Whenever it is taking a beating, it has had to fight back with monetary policy alone. The European Central Bank (ecb) has cut rates to zero and below, bought bonds by the bucketload and lent super-cheaply to banks. Fiscal policy has been barely used—and has sometimes done more harm than good. Debt crises forced governments in the south of the bloc to tighten their belts; those in the north chose to do the same.
EuroStoxx Also Makes A Key Reversal
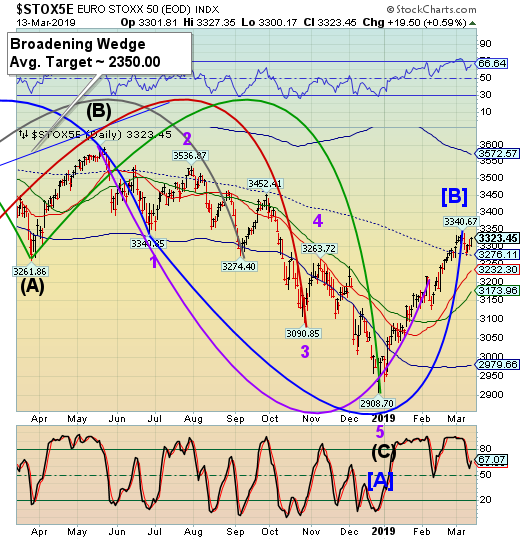
Note: StockCharts.com is not displaying the Euro Stoxx 50 Index at this time.
The Euro Stoxx 50 Index rallied to a new 61% retracement high, stretching the Master Cycle peak one more week. While the Cycles Model suggested Cyclical strength may have already peaked, the markets may have given the nod to options and futures expiration last week.
(Investing.com) -- Europe’s stock markets are marching higher Thursday, confident that U.K. lawmakers’ decision to vote against a ‘no-deal’ Brexit “at any time” has effectively ended the risk of a disorderly divorce.
At 04:00 AM ET (0900 GMT), the Euro Stoxx 50 was up 20.6 points, or 0.6% at 3,344.05, while Germany's Dax was up 0.4% and France's CAC 40 up 0.7%. The FTSE 100 was lagging, up only 0.3%, after another sharp rise in sterling overnight.
Conventional wisdom is that anything that softens or even cancels Brexit is good for the U.K. and for the European economy, but whether the degree of optimism visible this morning is justified is another question.
The Yen Consolidates Near The Low
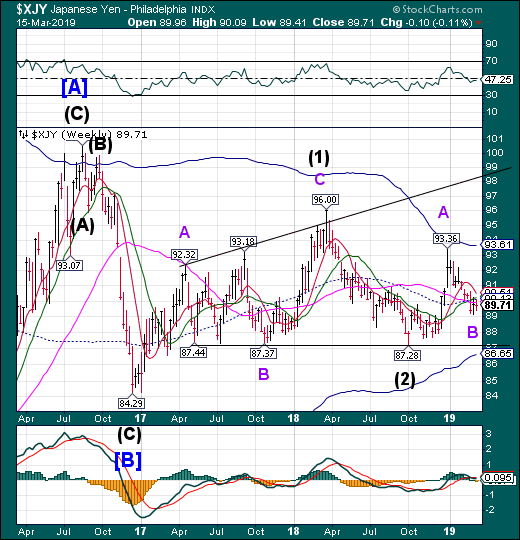
The yen appears to have made its Cycle low last week, but may be stymied by Intermediate-term resistance at 90.12. It closed beneath Long-term resistance at 89.80 as well. Rising above Long-term support/resistance may give a powerful buy signal.
(Bloomberg) Japanese brokerages are taking steps to help relieve at least some investors worried about getting trapped by the country’s unusually long holiday next month related to the emperor’s succession.
Markets in Japan are scheduled to be closed from April 27 through May 6 because the government has designated national holidays around the abdication of Emperor Akihito, in addition to annual Golden Week days off over that period. In total, markets will be shut for six trading sessions, sparking concerns of volatility.
Nikkei Bounces Off Support
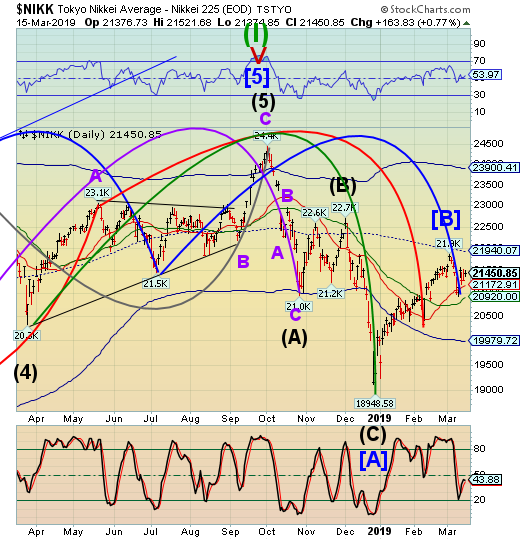
The Nikkei challenged Short-term support at 20996.27to make a Master Cycle low on Monday. From there it made a 50% retracement of its decline. The Cycles Model remains negative through late March.The Nikkei is on a sell signal beneath Short-term support.
(JapanTimes) Stocks staged a rally Friday on the Tokyo Stocks Exchange after investor sentiment was lifted by a weakening yen and climbing indexes in other Asian markets.
The 225-issue Nikkei average gained 163.83 points, or 0.77 percent, to end at 21,450.85. On Thursday, the key market gauge shed 3.22 points.
The Topix index of all first-section issues finished up 14.34 points, or 0.90 percent, at 1,602.63, after giving up 3.78 points the previous day.
The yen’s drop against the dollar on expectations for the Bank of Japan to take a fresh easing step prompted purchases mainly of export-oriented names in morning trading, market sources said.
U.S. Dollar Falls Beneath Support
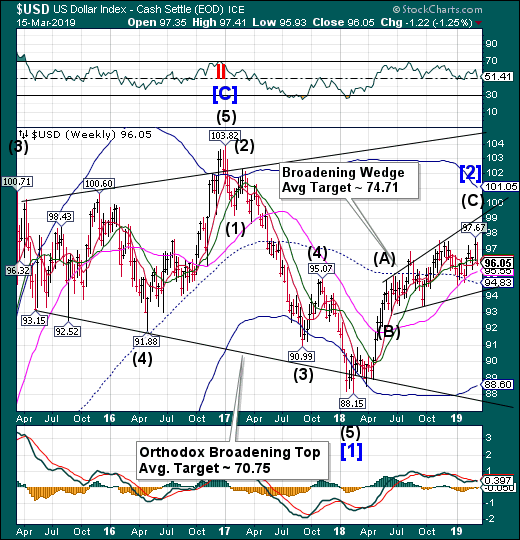
USDdeclined beneath Intermediate and Short-term support at 96.23, creating a potential sell signal. The Cycles Model suggests that there may be a bounce early next week that can be sold.Once back beneath Intermediate-term support/resistance, it may confirmthe sell signal.
(MarketWatch) The U.S. dollar weakened slightly across the board in Friday trading, reversing a move higher the previous day that had snapped a four-day losing streak and leaving a closely followed index on track for a weekly loss.
The ICE (NYSE:ICE) U.S. Dollar Index DXY, -0.24% a measure of the currency against six major rivals, was last down 0.2% at 96.597, on track for a 0.7% drop for the week. The popular gauge for the greenback headed lower after mixed U.S. economic data.
The Empire state manufacturing index fell to 3.7 from 8.8 beforehand in March, and industrial production in February only expanded by 0.1%, less than the 0.4% expected. Capacity utilization for February was more or less in line with estimates at 78.2%, and job openings in January rose to the third-highest level on record at 7.6 million. Consumer sentiment for March climbed to 97.5, beating expectations of 95.
Gold Repelled At The Trendline
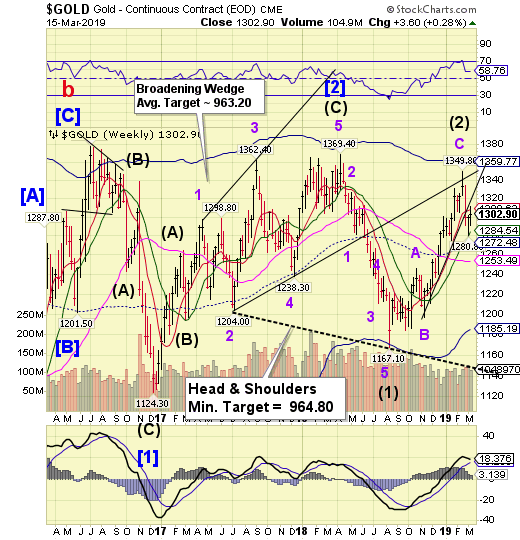
Gold tested the rising trendline but closed beneathShort-term resistance at 1308.62. It made a 50% retracement of its decline, suggesting the bounce may be over. The Cycles Model suggests there may be another 1-2 weeks of decline ahead. The Head & Shoulders formation matches targets with the already existent Broadening Wedge formation.
(CNBC) Palladium hit a record peak on Friday, on expectations that Chinese economic stimulus would drive demand for the autocatalyst metal, while news that Russia may ban exports of precious metal scraps compounded worries of a supply deficit.
Chinese Premier Li Keqiang said Beijing was open to additional monetary policy measures to support economic growth this year.
“The announcement of specific stimulus measures helped sentiment in China, which arguably is the global marginal consumer in automobiles, helping palladium climb quietly to new highs,” said Tai Wong, head of base and precious metals derivatives trading at BMO.
Crude Breaks Through Resistance
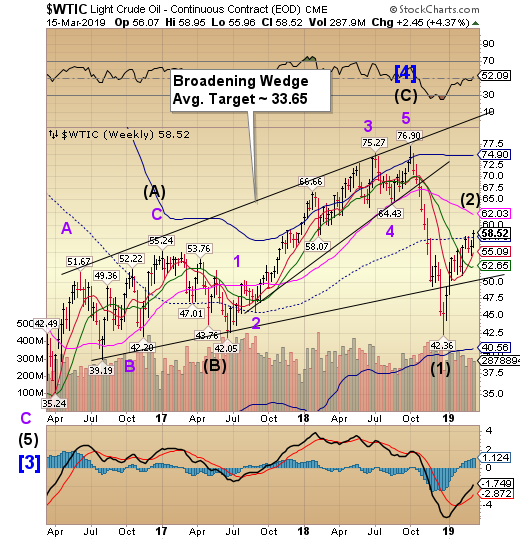
Crude broke above the mid-Cycle resistance at 57.73 and may continue higher through early next week. The anticipated1-2 week decline inverted, possibly due to Quad Witching this week.
(OilPrice) OPEC crude oil production was down 221,000 barrels per day in February. That was after December production had been revised downward by 13,000 bpd and January production revised down by 40,000 bpd.
OPEC 14 crude oil production now stands at 30,549,000 barrels per day. That is the lowest since February 2015. The peak was November 2016 at 33,347,000 bpd. So OPEC production is down 2,798,000 bpd from that point.
There is little doubt that if Libya, Iran and Venezuela had no political problems then OPEC production would exceed that 2016 peak. Iran’s problems will likely be settled in the next couple of years. They will likely recover quite quickly. Libya will take a bit longer to recover to full production if and when their problems are settled. However, it will likely take Venezuela a decade or more when and if their problems are ever settled. But it is likely they will collapse even further, closer to zero production, before their situation even starts to turn around.
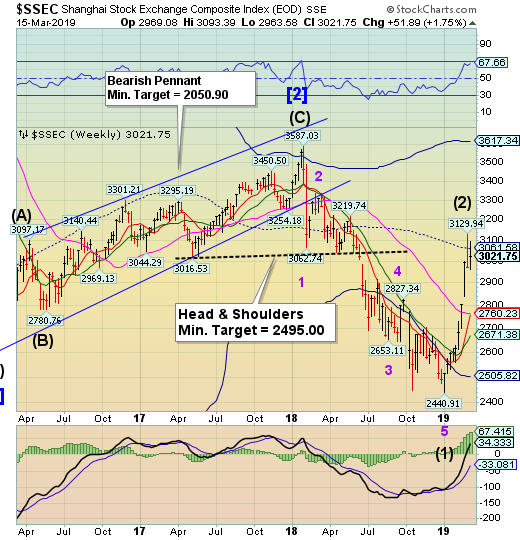
Shanghai Index Consolidates Beneath Mid-Cycle Resistance
