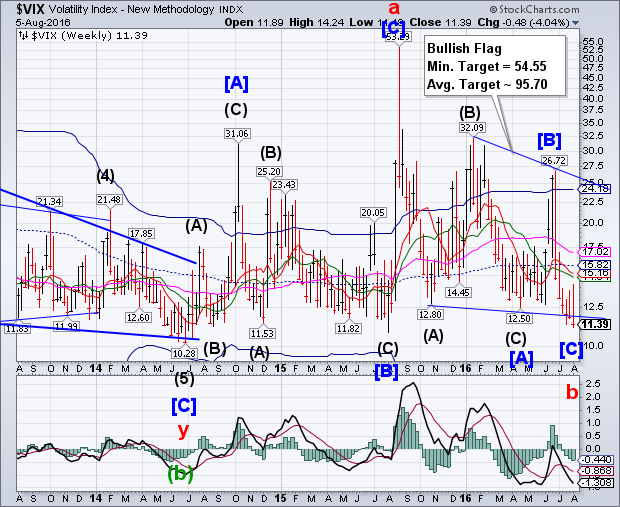
CBOE Volatility Index rallied early in the week before making a new low by the close. The Cycles Model suggests that the low is more than three weeks overdue. If so, payback may be coming in a very big way to those who have become complacent.
(ZeroHedge) Volume in inverse ETF’s has dropped to its 2nd lowest level in more than 5 years; have traders become too complacent?
We have mentioned often that skeptical sentiment has greatly contributed to the magnitude and duration of the stock market rally since February. Traders were relatively slow to embrace the rally, which served to insure a steady influx of new capital as the advance progressed.
S&P 500 continues to test its Broadening Top formation.
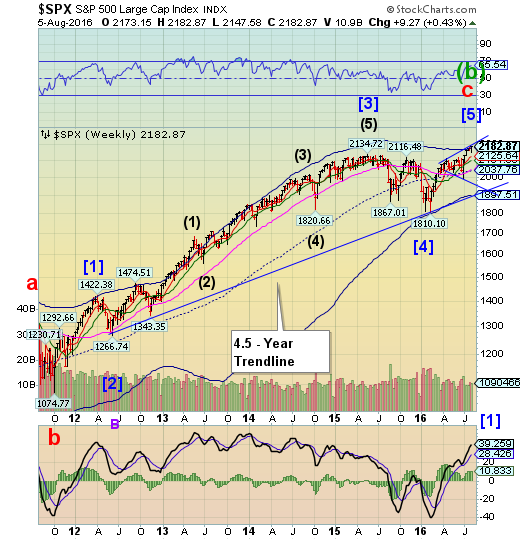
SPX has been challenging its Orthodox Broadening Top and weekly Cycle Top resistance at 2178.01 for the past four weeks. This week it doubled its trading range for the first time in a month. SPX has fulfilled all its requirements for a completed uptrend.In fact, the Wave [5] fractal target was 2157.71, a target that was achieved nearly a month ago.
(ZeroHedge) The latest note from Citi strategist Robert Buckland is a perfect example of the schizophrenia that has gripped investors in a market that continues to rise, defying all logic. On one hand, Citi calls the S&P rally "unstoppable" adding that "this US bull market just won’t die", urging clients "don't underweight the S&P", while on the other it openly admits the market, on a fundamental basis is very overstretched, admitting that "since 2011, the US market has re-rated from a trailing PE of 17x to 23x."
Nasdaq 100 reaches its Cycle Top resistance.
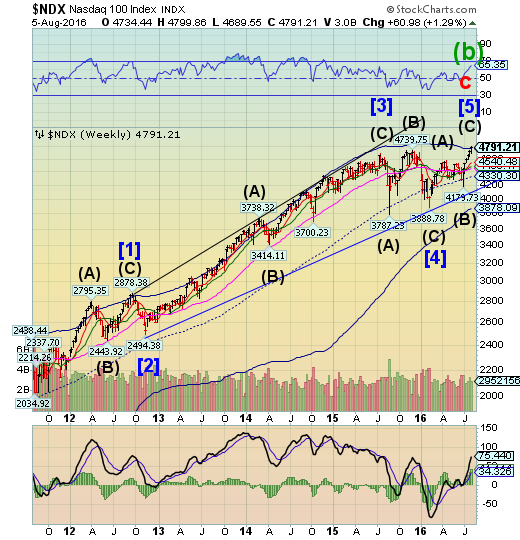
NDX reached its weekly Cycle Top at 4788.51.However, there may be a second fractal target at 4865.33 to be reached early next week. On the other hand, the Dow Jones Industrials have not made a new high since July 20, after peaking short of its fractal target.
(ZeroHedge) Three months ago, when looking at the 10-Q of Carl Icahn's hedge fund vehicle, Icahn Enterprises, L.P. (IEP) we found something striking: Carl Icahn had put his money where his mouth was. Recall that over the past year, Carl Icahn had become one of the most vocal market bears with a series of increasingly escalating forecasts. At first, he was mostly pessimistic about junk bonds, saying last May that "what's even more dangerous than the actual stock market is the high yield market." As the year progressed his pessimism become more acute and in December he said that the "meltdown in high yield is just beginning." It culminated in February when he said on CNBC that a "day of reckoning is coming."
High Yield Bond Index bounces off Short-term support.
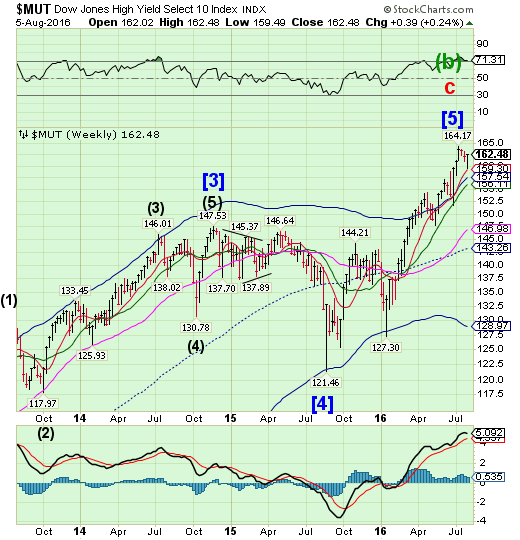
The High Yield Bond Index bounced off Short-term support as it begins its final probe toward the top. Note that it reacts to similar pivots as equities, preceding the Dow high by almost a week.Investors should now be on the alert for a decline beneath its Short-term support at 159.30 for a probable sell signal. There’s no fear being expressed by Wall Street.
(Bloomberg) Now’s no time to give up on fixed income, even after yields rose amid unexpectedly strong gains in U.S. payrolls, said Prudential Financial Inc.’s Robert Tipp.
The Federal Reserve isn’t as likely to raise interest rates as some people think, and investors will find attractive returns if they stick with corporate debt or structured securities rather than government bonds, Tipp said Friday in an interview with Bloomberg Television.
“Investors that are in the higher-yielding sectors, within whatever is their risk parameter set, are going to do very well over the long run, especially relative to where cash rates are going to be,” said Tipp, chief investment strategist for the insurer’s fixed-income division. “The Fed’s going to have a very hard time raising rates.”
USB challenges Short-term support.
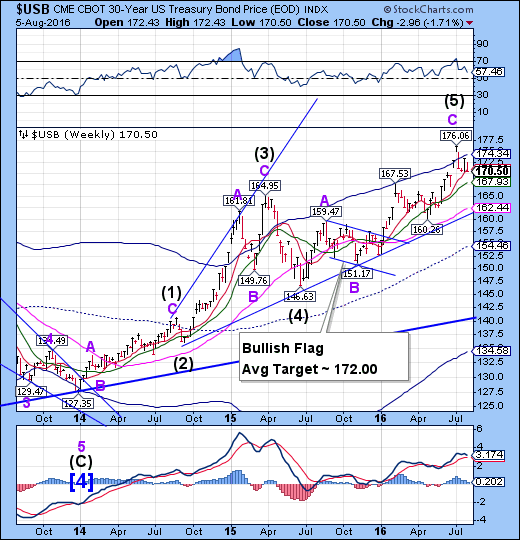
The Long Bond challenged Short-term support at 170.90 in a brief pullback. Should USB find support here, it may be due to rally for the next two or three weeks. A failure at this resistance level may also prove to be a sell signal for the Long Bond.
(WSJ) U.S. government bonds pulled back sharply Friday as the latest employment report pointed to a solid labor market, potentially giving the Federal Reserve more room to raise interest rates.
The U.S. economy added 255,000 new jobs last month, compared with the forecast of 179,000 by economists polled by The Wall Street Journal. Average hourly earnings for private-sector workers rose by eight cents, or 0.3%, from the previous month.
The data came as good news for the U.S. economy, a week after a report showed disappointing gross domestic product growth in the first half of the year.
The Euro declines back to the trendline.
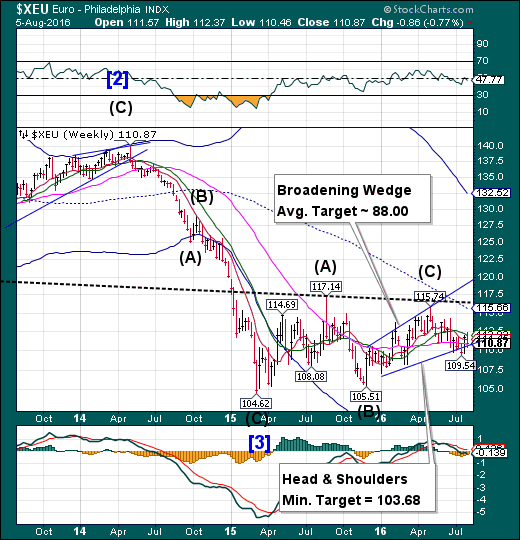
The Euro declined back to the trendline of its Broadening Wedge formation and Long-term support at 110.81.The head & Shoulders formation may still be valid, so a second break of the trendline may put the Euro back into a possible bear market with the loss of that key support.
(FT) The euro has few friends. It is attacked both by nationalists and internationalists, paradoxically unified in their conviction that Europe’s monetary union was flawed from the moment of its birth in 1999. The latest “j’accuse” comes from Joseph Stiglitz, whose critique of the euro aligns itself unabashedly with the anti-establishment left. Yet there is much in this new book by the Nobel Prize-winning economist with which the Eurosceptic right will agree.
Euro Stoxx 50 declines from the trendline.
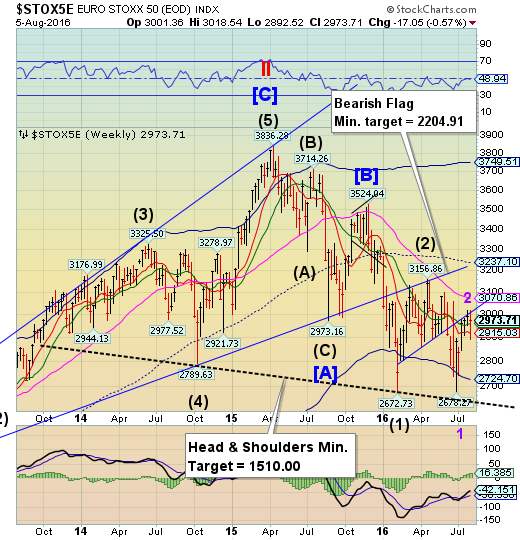
The EuroStoxx 50 Index declined from the trendline through all nearby supports, only to bounce above Intermediate-term support/resistance at 2959.30.A resumption of the decline beneath the neckline at 2600.00.00 may trigger an even stronger sell-off.
(Bloomberg) European stocks posted their biggest two-day advance in more than three weeks as U.S. jobs data beat expectations.
The Stoxx Europe 600 Index climbed 1.1 percent to 341.38 at the close of trading, trimming its weekly loss to 0.2 percent. A report from the U.S. Labor Department showed payrolls climbed by 255,000 last month, exceeding all forecasts in a Bloomberg survey, signaling that the world’s biggest economy is strengthening.
The Yen is repelled by the Cycle Top.
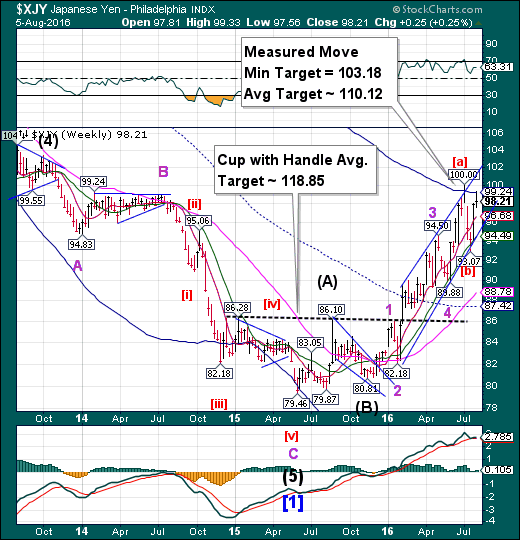
The Yen was repelled from Cycle Top resistance at 99.24 this week.The Yen may have another go at the top once it completes a consolidation above Short-term support at 96.68. The probable new period of strength may last through late September. A breakout above the Cycle Top appears to be probable.
(ZeroHedge) One of the main reasons for the failure of Abenomics is that while Abe has been largely successful in boosting import prices as a result of the collapse in the Yen, his policies have been a failure when it comes to achieving the only thing that truly matters for achieving benign inflationary pressures: pushing wages higher.We first pointed this out all the way back in late 2014 in a post titled "The Abenomics Devastation: Japanese Real Wages Decline For Record 16 Consecutive Months."
.The Nikkei 225 is caught between support and resistance.
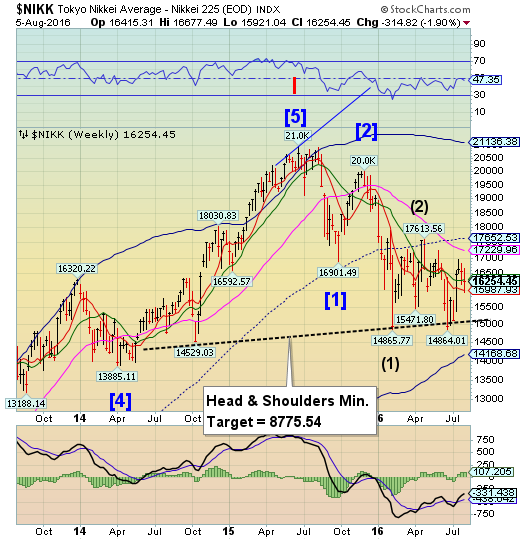
The Nikkei continued its decline early this week only to bounce from Short-term support at 15987.93 back to Intermediate-term resistance at 16335.90.There may be few more days of consolidation before a decline to the Head & Shoulders neckline.
(NikkeiAsianReview) A majority of listed Japanese companies suffered a profit decline in first-quarter results released through Friday, dragged down by sluggish domestic consumption and a stronger yen.
Data compiled by Nikkei Inc. shows lower pretax profits than a year earlier for 58% of 1,055 listed companies that close their books in March and have announced April-June figures. This proportion rose from 52% in the January-March quarter and reached the highest since July-September 2009, when the 2008 global financial crisis was still being felt.
US Dollar Index consolidates between support and resistance.
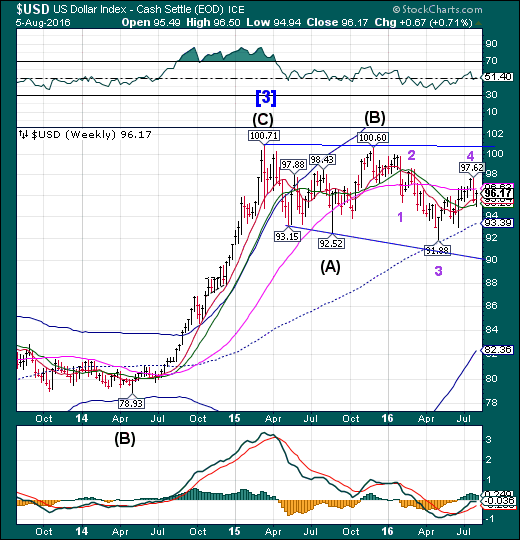
USD declined to its Intermediate-term support at 95.20 before rising back toward Long-term support/resistance at 96.63. The Cycles Model suggests that the decline may continue two weeks or longer before a significant bounce. This Wedge formation is unfinished in the shorter term. Once the downside target has been met, we may discuss what may follow.
(Reuters) Speculators pared back bullish U.S. dollar bets this week, as investors were dismayed by poor U.S. economic growth data for the second quarter that dampened expectations for an interest rate hike this year.
The value of the dollar's net long position fell to $12.81 billion in the week ended Aug. 2, from $13.66 billion the previous week, according to Reuters calculations and data from the Commodity Futures Trading Commission released on Friday.
Dollar net longs fell after increasing four straight weeks. The greenback had been on its best run of weekly gains in 1-1/2 years until last week when the weak GDP data was released.
Gold declines beneath its Cycle Top resistance.
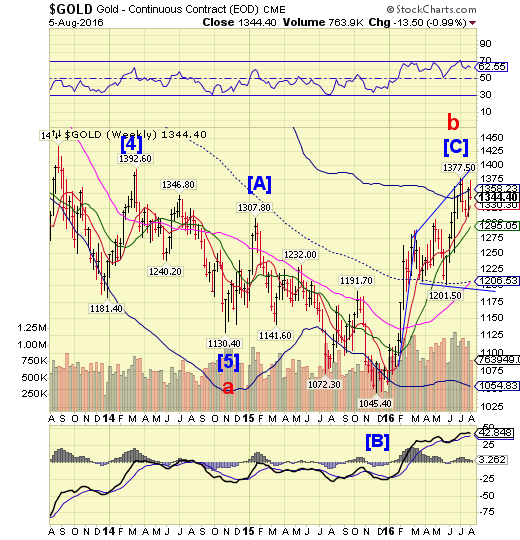
Gold probed above its Cycle Top resistance at 1358.23, but reversed back beneath it. The reversal at the Cycle Top may be considered an aggressive sell signal by most, but a lower high gives it credibility.The next support appears to be at Short-term support at 1330.00. The Orthodox Broadening Top suggests a decline to 1165.00.
(Bloomberg) Renewed strength in the U.S. labor market is threatening to derail the gold rally that sent futures to the best first half in almost four decades.
Employment jumped in July for a second month and wages climbed, boosting bets that the Federal Reserve may raise U.S. interest rates this year and sending gold to its biggest loss in more than 10 weeks.
Bullion has extended gains this quarter, helped by low interest rates and pledges by central banks from Europe to Japan to continue to crank up stimulus spending. Low rates are a boon for gold because they keep the metal more competitive against assets like bonds that pay interest.
Crude Oil bounces from a Trading Cycle low.
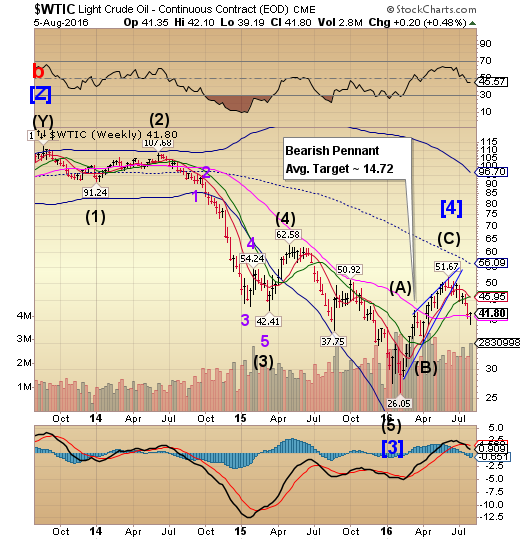
Crude bounced from an expected Trading Cycle low to challenge Long-term support at 40.96 this week. This is not the targeted low. Once the bounce is complete, it may resume its decline into late August.
(Bloomberg) Oil rose amid speculation that traders who had bet on falling prices were buying back positions.
Futures rose 2.7 percent in New York, extending a rebound from near four-month lows earlier in the week. Hedge funds upped their short position in West Texas Intermediate crude by the most ever for the week ended July 26, according to Commodity Futures Trading Commission data going back to 2006. The large short position leaves the market vulnerable to a quick rally, according to analysts.
Shanghai Composite Index lurches along above Intermediate-term support.
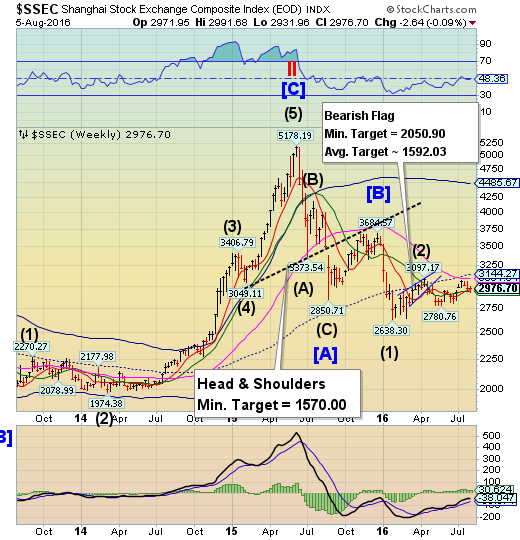
The Shanghai Index continues to lurch along above Intermediate-term support at 2935.97 before closing the week modestly higher.It is likely that the decline may continue.The Cycles Model suggests that the Shanghai Index may decline through the end of August.
(ZeroHedge) China Banking Regulator Tells Banks to Evergreen Loans of Troubled Companies
On the surface, China is talking the reform talk. But is it also walking the walk? There are many examples to demonstrate it isn’t. The most recent one is a directive from the China Banking Regulatory Commission (CBRC) to not cut off lending to troubled companies and ever greening bad loans. This first reported by The Chinese National Business Daily on Aug. 4.
“A Notice About How the Creditor Committees at Banks and Financial Institutes Should Do Their Jobs” tells banks to “act together and not ‘randomly stop giving or pulling loans.’ These institutes should either provide new loans after taking back the old ones or provide a loan extension, to ‘fully help companies to solve their problems,'” theNational Business Daily writes.
The Banking Index makes another attempt at mid-Cycle resistance.
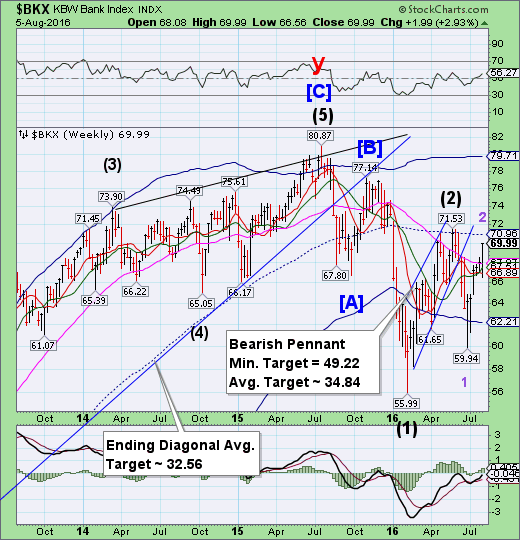
--BKX broke through Long-term resistance at 67.97 to rally toward mid-Cycle resistance at 70.96.The Cycles Model suggests that an extension of a period of strength is about to wind down.It does not appear that the Cycle Bottom support will stop the ensuing decline.
(ZeroHedge) China is desperate to solve several problems it has due to its debt to GDP ratio being north of 300 percent. It may have found a pretty unconventional one by letting companies become banks, according to a report by the Wall Street Journal.
With profits headed south, heavily indebted Chinese heavy-machinery giant Sany Heavy Industries said this week it won approval to set up a bank in the Hunan Province city of Changsha. With 3 billion yuan ($450 million) of registered capital, it will be a relatively large institution as Chinese city-based banks go. Sany plans to join forces with a pharmaceutical company and an aluminum company.
(ZeroHedge) The Fed's latest consumer credit report revealed that in the month of June, overall household credit rose a smaller than expected $12.3 billion, below the $17 billion expected, and below last month's $17.9 billion increase.
he reason for the miss in credit growth was entirely due to the unexpected slowdown in non-revolving credit, which rose by only $4.6 billion, the second lowest monthly increase since 2012 with just December 2015 posting a slower rate of increase. It is possible that the decline in new non-revolving, i.e., auto credit creation was the reason for the slowdown in auto sales over the past several months.
(ZeroHedge) In a poetic poke to the eye of the Fed's "lower for longer" interest rate policy intended to manage, in part, job creation, MetLife (NYSE:MET) just announced a massive earnings miss and job cuts which theCEO attributed to lower investment income due to, you guessed it, low interest rates. According to MetLife's 2Q 2016earnings release, the company reported operating earnings of $924 million, down 48 percent from the second quarter of 2015, and 47 percent on a constant currency basis. Operating earnings in the Americas decreased 42 percent, and 41 percent on a constant currency basis. The stock is being punished in today's trading session and is currently down roughly 9% (a mere $4BN of value destruction).
(CNBC) Banks across Europe have endured a choppy year, to say the least, and some experts say the effect on U.S. stocks is forthcoming.
Deutsche Bank (DE:DBKGn) hit an all-time low on Wednesday. Major Italian bankBanca Monte dei Paschi di Siena SpA (OTC:BMDPY) received a poor rating in a stress test earlier this week. And Unicredit (DE:CRIH), Italy's largest bank, saw its shares fall after results were relatively weak.
"It really is a disaster with these banks. I'll give you a good example: The IMF called Deutsche Bank the most dangerous bank in the world," Eddy Elfenbein, editor of the blog Crossing Wall Street, said Wednesday on CNBC's "Trading Nation." He added that turmoil across European banks "very well may" send shockwaves to international markets.
