by Pinchas Cohen
The Week That Was
Dow's Bullish Hat Trick
The Dow Jones Industrial Average didn’t just breach the 22,000 level for the first time last week, it also closed above it on Friday, finishing the week at the very highest price of the day. Each of these benchmarks on their own would demonstrate investor confidence, but all three together represent exceptional bullishness.
While Apple’s (NASDAQ:AAPL) Q3 results propelled it higher by 5-percent up, leading the Dow upward, the historically low borrowing costs currently in effect prop up otherwise inflated wages. However, the perhaps the single biggest boost for multinationals has come from the weak dollar, increasing revenues – as with Apple.
Earnings Season Wrap-Up
While the S&P 500 has been beating the 8-percent growth expectation during this current earnings season, coming in stronger at 10 percent, non-US markets have been doing even better. Earnings results in Europe and Emerging Markets reflect both decisive economic growth and lower valuations, providing more robust opportunities for multi-asset portfolios. Japan, for example, is set to see an earnings boost of 25 percent.
December Rate Hike: Rising Potential
The July employment report was solid, 209,000 jobs were created, beating the 180,000 consensus expectation; even the June number was revised higher to 231,000 from 222,000. This is the one area of the US economy which has continued to be a source of strength, relative to mediocre 2-percent economic growth.
However, the big market mystery remains: why is there a strong labor market but no inflationary pressure? This fosters investor doubts the Fed can pull off another rate hike this year.
Though the unemployment rate dipped even lower, to 4.3 percent, the most interesting and closely watched portion of the data release were the wage inflation statistics. For the first time in months, a bit of strength began to infuse the US wage growth numbers in the US. On an annual basis, we’re still only at 2.5 percent, but on a MoM basis—although it’s been a crawl—at least it's in the right direction.
In May it was 0.1 percent, in June 0.2 percent and in July 0.3 percent. Still, the solid NFP read raised bets from 46 percent to 50 percent for a December hike. However, should wage growth continue to rise, investors might be more convinced of a December rate hike.
The Week Ahead
All Times EDT
Monday
21:30: Australia - NAB Business Confidence (July): index expected to fall to 7 from 9. Market to watch: AUD crosses
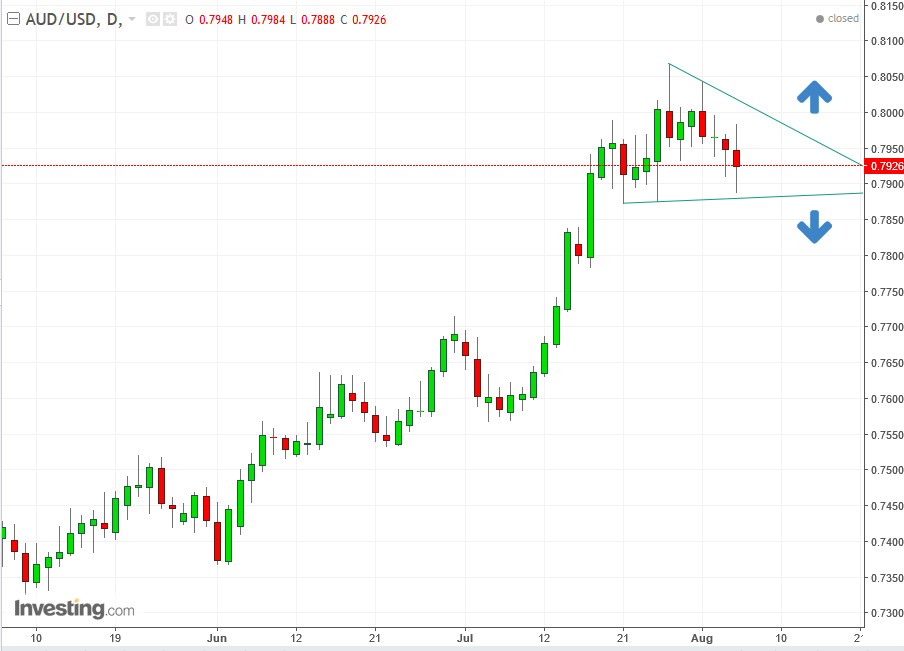
Upon reaching a 2-year high, the AUD/USD pair is consolidating in the form of a descending-channel, upon whose downside breakout would suggest a reversal, while an upside breakout may prove to be a blowout, which turns a reversal into a continuation pattern.
22:00: China - Tentative: Trade Balance (July): after strong growth last month, investors will be hoping that the recovery in exports continues. Markets to watch: Shanghai Composite, Hang Seng Index, CNY crosses
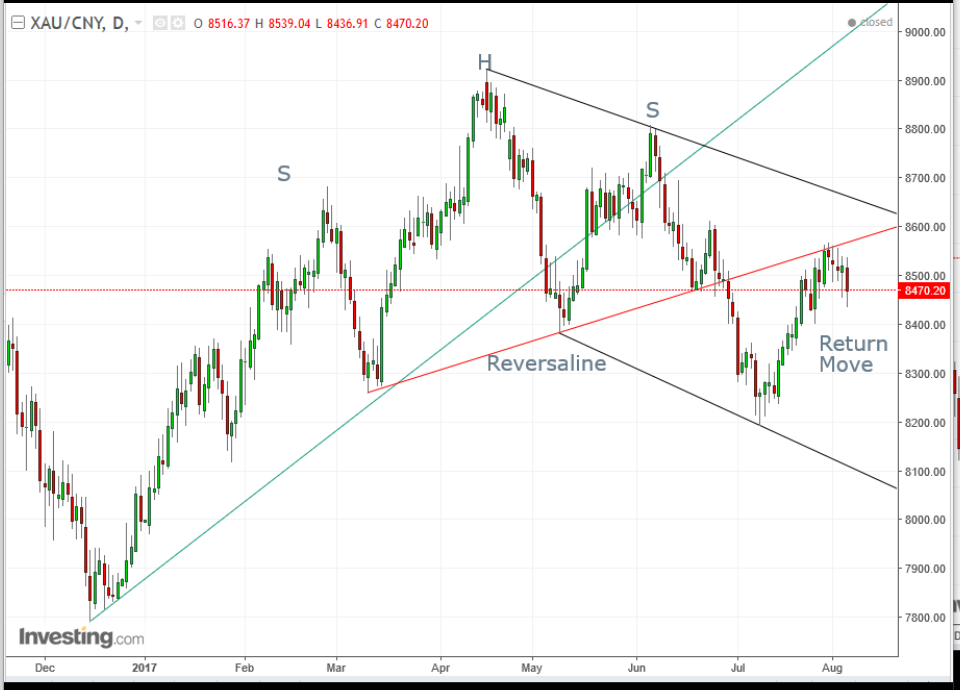
The Gold/CNY pair broke its uptrend line since December, completed a H&S when closed below the neckline on June 29 and completed a return-move, in which the neckline held. All this suggests the pair is now trading within a falling channel, between the black lines.
Tuesday
2:00: Germany - Trade Balance (June): previous figure was surplus of €22 billion. Market to watch: EUR crosses
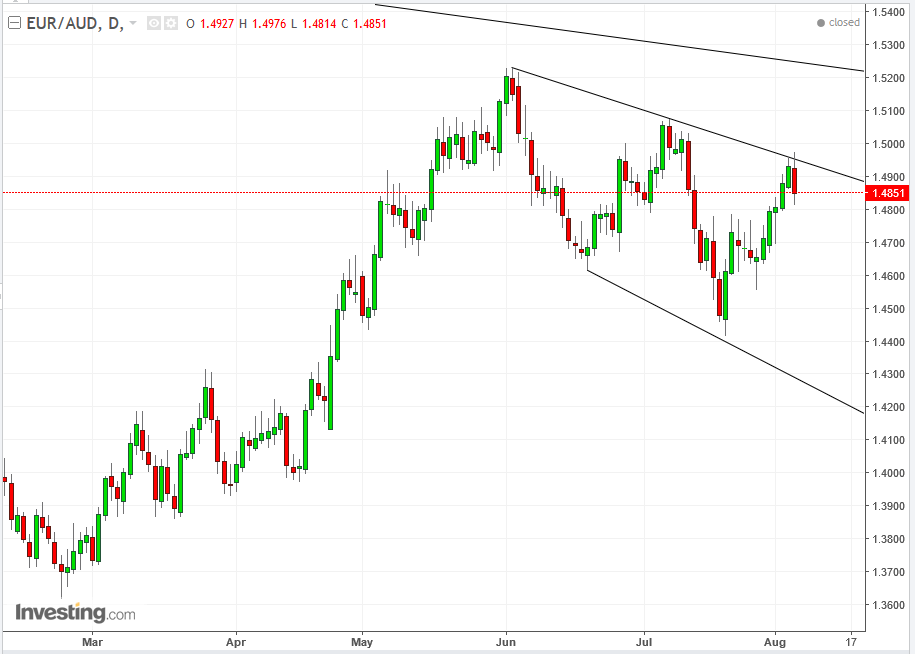
The EUR/AUD pair neared a downtrend line since August 2015 and has formed a falling channel since June. On Friday, the pair completed a Bearish Engulfing pattern, confirming the resistance of the channel top, with a target price of 1.44, to retest the July low, before it continues toward 1.4.
10:00: US - JOLTs Job Openings (Jun): 5.666 million available jobs for at least 30 days, for which there is work and for whom employers seek workers. This measures job creation, the economy’s engine. Markets to watch: USD Crosses
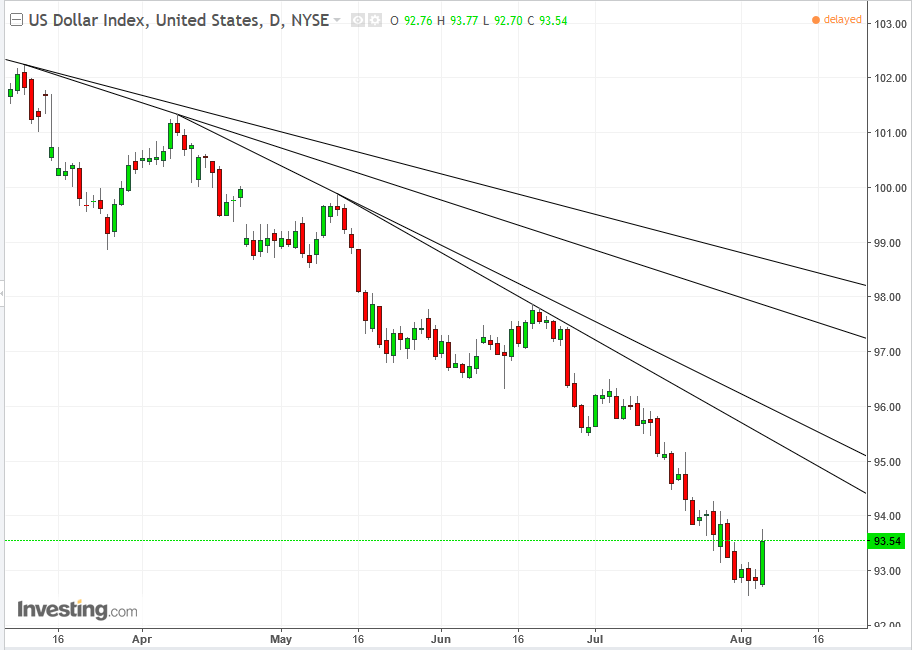
Judging by the number of steeper trend lines in the chart above, you can see just how far away from a sustainable decline the US Dollar Index has gotten. Friday's jump covered more than the 5 previous sessions, in what may be a “dead cat bounce,” a sharp rise, after a sharp fall. The closest downtrend line is at at 95.45 at the current level.
20:30: Australia: Westpac Consumer Confidence (August): previous reading 96.6. Market to watch: AUD crosses
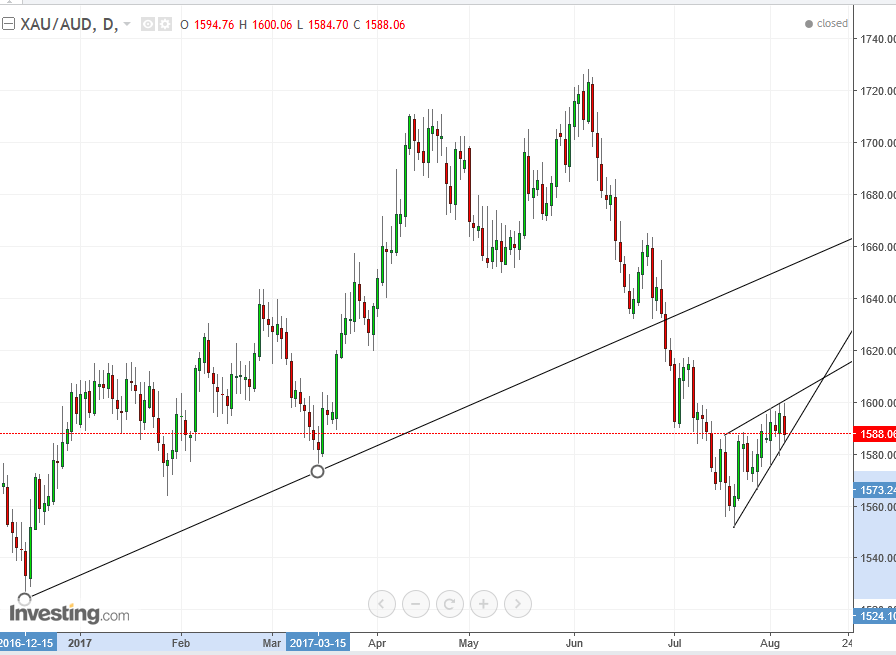
After the XAU/AUD pair fell below its December uptrend line on June 29 (compare to the XAUCNY above), it continued to fall nearly another 5 percent, when it began forming a consolidation. This is a bearish pennant, as it continues along the prevailing trend, upon a downside breakout, below 1580.00.
21:30: China - CPI, PPI (July): CPI expected to rise 0.1% MoM and 1.4% YoY, from -0.2% and 1.5% respectively. PPI forecast to rise 5.4% YoY from 5.5%. Market to watch: CNY crosses
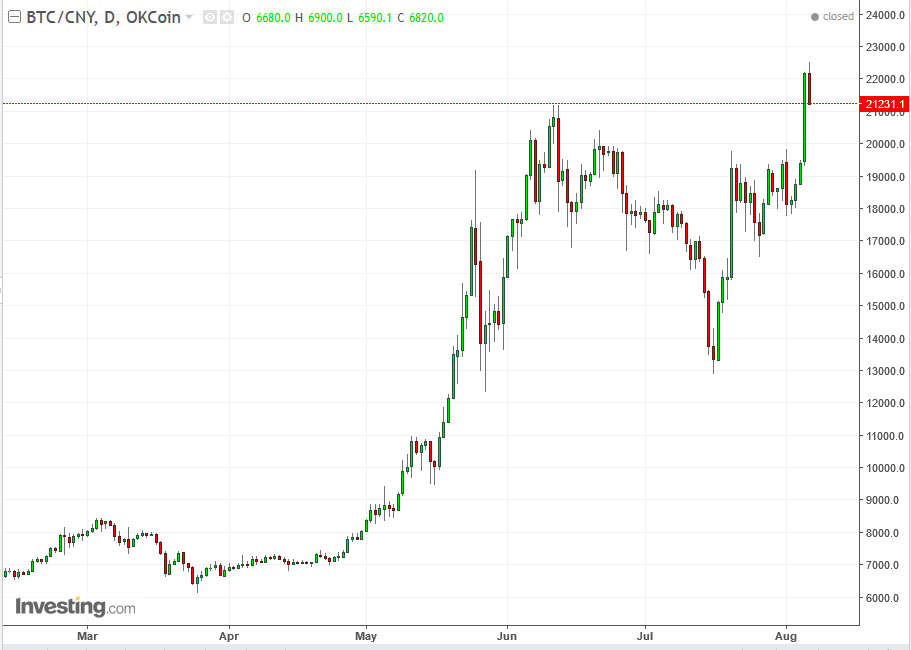
The price of Bitcoin has – once again – blown out of its bearish pattern, turning into a continuation, consolidation pattern. Should the current pattern with 12,240 support indeed hold, the price target suggestion is 29,000 per the principles of technical analysis, however fantastic that sounds.
EARNINGS
Disney (NYSE:DIS) reports Q3 2017 earnings after the close. Consensus expectations are for EPS of $1.53, vs YoY $1.62 on $14.60B in revenue.
Analysts expect Disney's profits to have fallen in the latest quarter, after its shares have been up 3 percent this year, far less than 10.7-percent gains seen in the S&P 500. It is not your parents’ favorite cartoon company, at least not anymore. Focus now is on an increasing cord-cutting, along with costs for broadcasting rights.
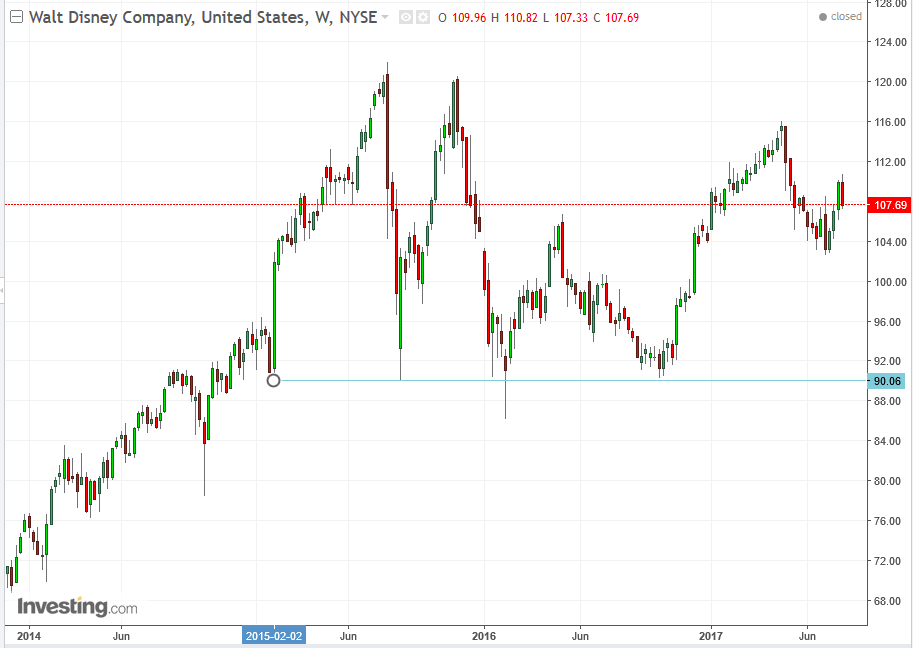
Disney's share price has been unable to overcome the $120 level since August 2015. It has just failed for the fifth time since then. This prevalence of selling suggests first a retesting of the July $103 low, and then the $90 low since 2015.
Coca-Cola Bottling Co Consolidated (NASDAQ:COKE) reports after the US close.
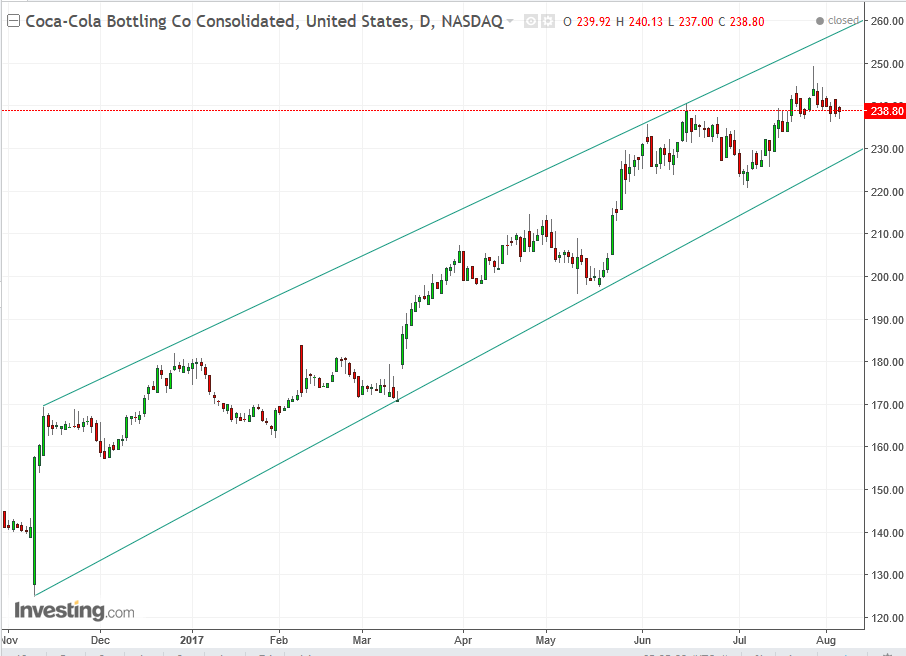
The price has been trading within an ascending channel since November 9, 2016, the day of the US election results. It had formed consolidation during June, which it has broken out of during July. On July 27, it had formed a powerfully bearish shooting star, with no lower shadow and whose upper shadow is several times bigger than its body. This shows how far down bears have pushed the bulls’ advance. The June consolidation has been providing support though, which is why it hadn’t yet declined toward the channel bottom of $230. However, a close beneath $235 would suggest just that.
Wednesday
10:30: US - EIA Crude Inventories (w/e 4 August): expected to fall by 1.5 million barrels, in line with the previous week. Markets to watch: Brent, WTI
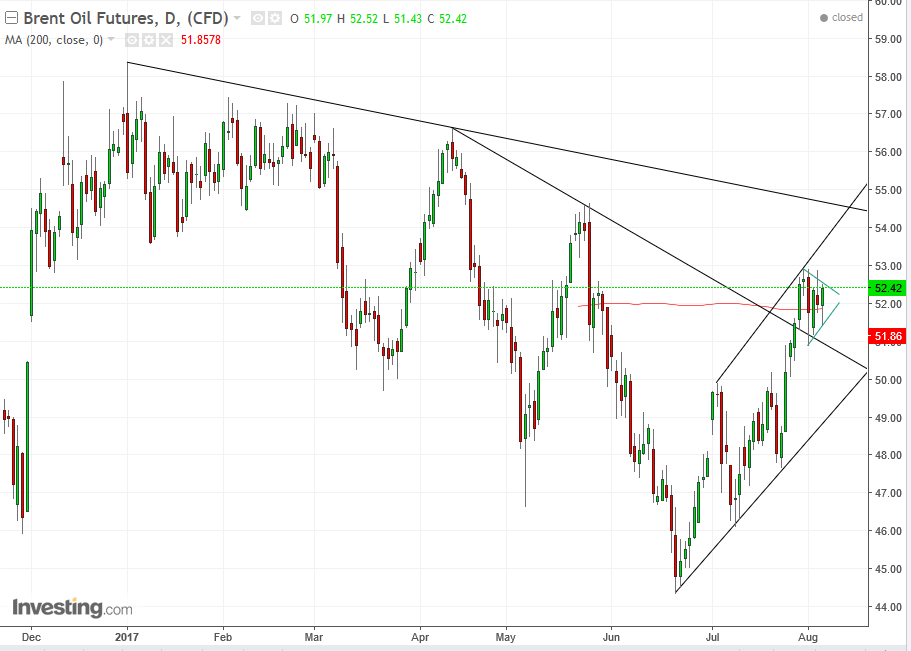
Unlike WTI—which doesn’t have a shorter-term downtrend line it has surpassed—the price of Brent’s lowering peaks since April plotted a steeper downtrend line, which was overcome on July 28. Since then the price, as with WTI, has been consolidating, in what may prove to be a continuation pennant, following the sharp 10-percent rise since July 24. The 200 dma, in the center of the pennant demonstrates the importance of this price level and pattern. The original downtrend since January 3 would be the next resistance at $54.
Thursday
4:30: UK - Manufacturing Production (MoM) (June): Forecast sees it rise to 0.0 percent from a previous reading of -.2 percent. Market to watch: GBP crosses
4:30: UK - Trade Balance (June): previous reading was a deficit of £3 billion. Market to watch: GBP crosses
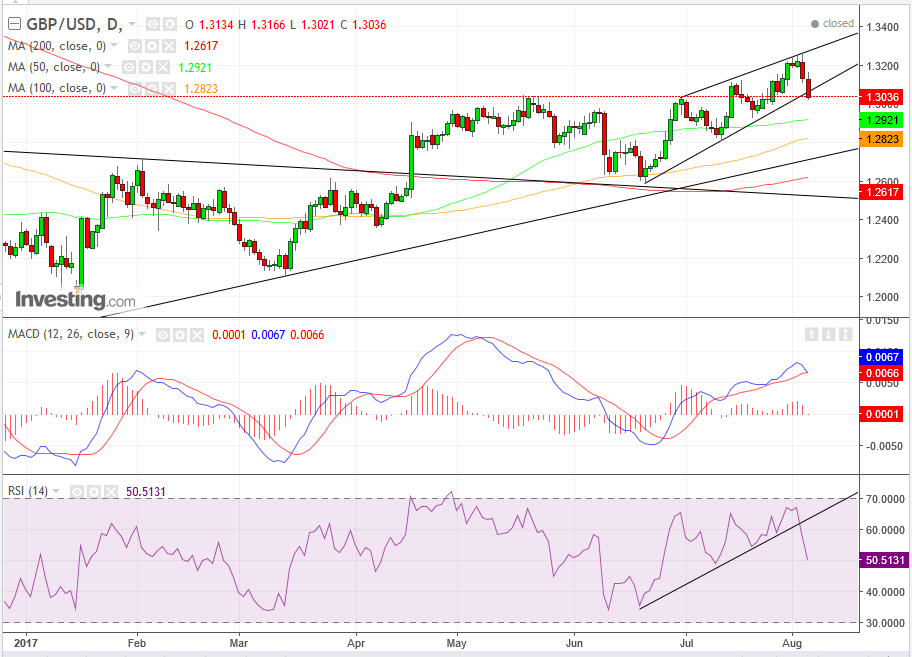
The pound has been in an uptrend since the October Asia flash crash. It has overcome its December downtrend, creating a potential bottom with a 1,400-pip reversal.
The May high of 1.3040 correction ended on June 21 with a 1.2688 low, confirming the support of the pattern. Since then the price of the pair advanced with a rising but narrowing channel, suggesting a possible bearish wedge, which it is currently testing, with a close beneath the uptrend line.
Notice the red dotted line signaling the current price level. It is right above the May high, which is acting as a support. The leading momentum RSI already provided a decisive downside break pointing the way for the price to follow. The MACD is about to cross below, as well.
Notice how while the 50 dma (green) is protecting the rising channel since June, while the 200 dma (red) is protecting the reversal pattern’s support. The 100 dma (orange) is naturally in between the two. While it has to close beneath the May high price, the close beneath the potential wedge, already executed by the RSI suggests a correction.
8:30: US - Initial Jobless Claims (w/e 5 Aug), PPI (July): 241k expected, against a reading of 240k last month and a flat 0.1 percent expected for the PPI. Market to watch: US dollar crosses
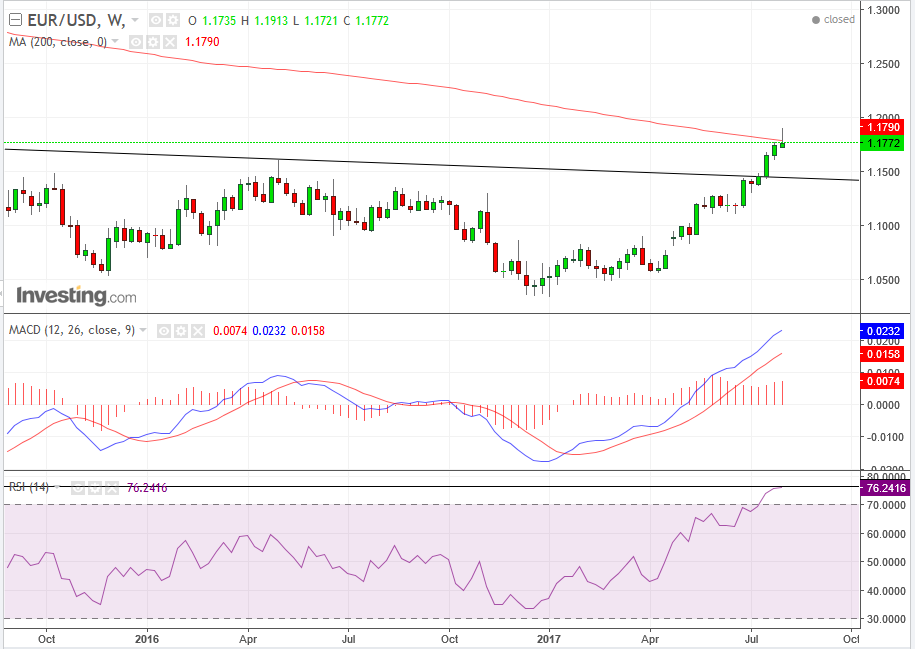
The EUR/USD has overcome its 2.5-year pattern, but was held at bay by the 200 wma, which forced the price into a bearish shooting star, with both the MACD and RSI in multi-year oversold levels. For the MACD, that's been since July 2011, and for the RSI since November 2007. A correction in the form of a return-move to the range line, toward 1.1400. is appropriate, with a strong 1.1500 round psychological support on the way.
10:00 PM: China - Retail Sales (July): forecast to rise 10.5% YoY from 11% a month earlier. Markets to watch: Shanghai Index, Hang Seng Index, CNY crosses
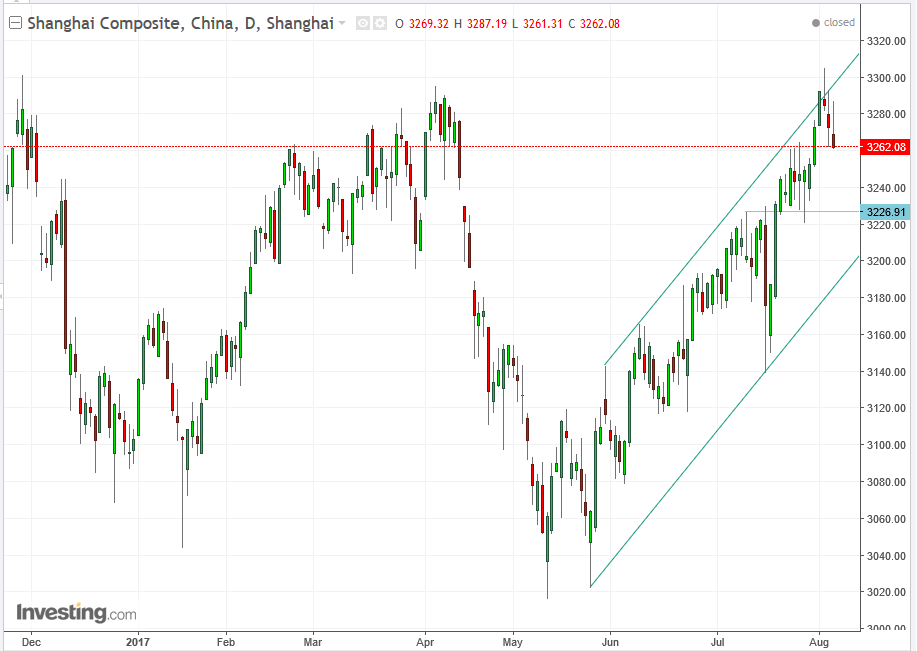
The price surpassed the November 2016-April 2017 peaks, but was forced into closing below the April close, forming a bearish shooting star on Wednesday. It also turned out to be the top of the rising channel, in itself a resistance. Sure enough, the index continued to decline in the following two days. A support awaits the composite at 3227, which was confirmed between July 20 and 28, after overcoming the June 22 – July 19 consolidation.
EARNINGS
Macy’s (NYSE:M) reports Q2 2017 earnings before the market open. Consensus is expecting EPS of $0.44 on $5.49B in revenues.
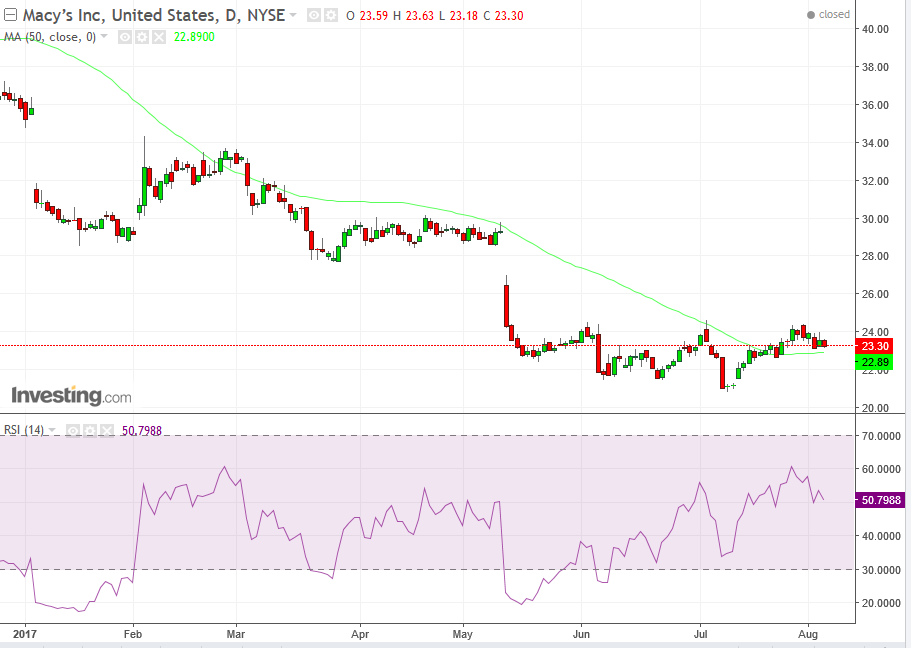
Since mid-May the price has been acting as if it’s forming a rounding bottom. The RSI provides such a positive divergence, rising, while the price has yet failed to do so. The price has managed to overcome the 50 dma, which is a step in the right direction, and a possible first step to an advance.
Friday
5:00: Eurozone - Industrial Production (June): expected to rise 3.6% YoY. Market to watch: EUR crosses
