
Risk appetite was boosted again yesterday, perhaps on new signs that the coronavirus spreading may be levelling off. As for today, market participants may once again turn their attention to the U.S. initial jobless claims. Apart from the claims, we also get Canada’s employment data for March, while the OPEC+ group is expected to have a video conference meeting to discuss oil production.
RISK APPETITE IMPROVES, US INITIAL JOBLESS CLAIMS BACK UNDER THE RADAR
The dollar traded lower or unchanged against the other G10 currencies on Wednesday and during the Asian morning Thursday. It lost ground versus AUD, NZD, GBP and NOK in that order, while it was found virtually unchanged against EUR, CAD, CHF, JPY and SEK.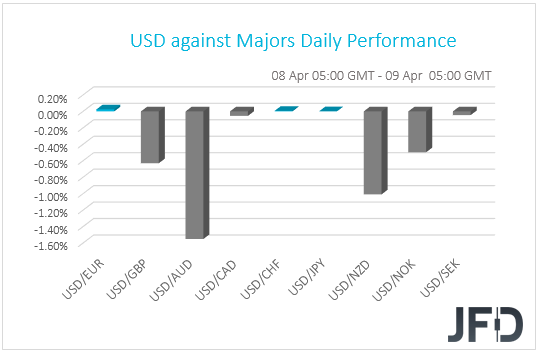
The strengthening of the risk-linked currencies Aussie and Kiwi, combined with the relative weakness of the safe havens US dollar, yen and franc, suggests that investors’ appetite was boosted again. Indeed, although most major EU indices traded slightly in the red, the US ones gained on average around 3%, with the positive sentiment rolling into the Asian session today. Despite Japan’s Nikkei falling 0.18%, China’s Shanghai Composite, Hong Kong’s Hang Seng and South Korea’s KOSPI are up 0.46%, 0.72% and 1.41% respectively.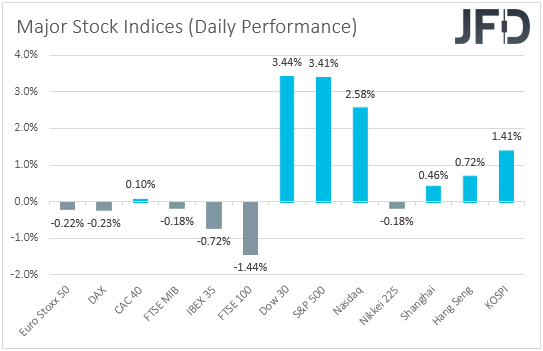
Risk appetite may have been subdued during the European session as Eurozone finance ministers struggled to agree on a coordinated rescue package, with their chairman, Mario Centeno, suspending talks until today. That said, things have changed during the US trading, perhaps due to new signs that the coronavirus spreading may be leveling off.
Although new infected cases accelerated somewhat, deaths slowed decently. At this point it is worth mentioning that in the US, both cases and deaths have slowed somewhat, with President Trump saying that they might be getting to the top of the “curve”. US indices may have also received an additional boost from the health insurance sector, which gained ground after the Democratic Presidential candidate Bernie Sanders exited the race for the Oval Office. Sanders was a supporter of a Medicare for All policy, which would have ended private health insurance.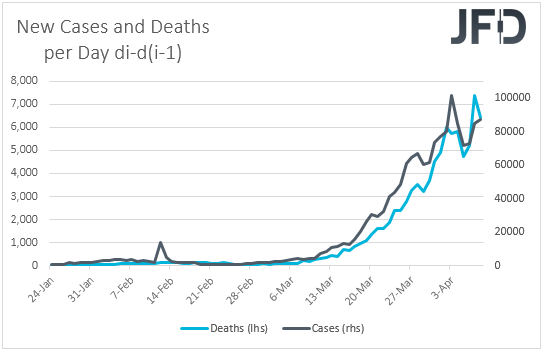
As for today, market participants may lock their gaze once again to the US initial jobless claims. Last week, initial claims more than doubled the previous record of 3.3mn, hitting a new one at 6.65mn.
Now the forecast points to another 5.25mn claims, but bearing in mind that the virus situation in the US had been worsening day by day last week, we wouldn’t be surprised if we get a new record.
This would confirm that the damages in the US job market are worse than previously anticipated and may trigger another round of risk aversion. The preliminary UoM consumer sentiment index for April may also attract special attention, as it may reveal how much consumers’ morale has been impacted. Expectations are for a slide from 89.1 to 75.0, which will be the lowest since April 2013, and may add more fuel to investors’ flight to safety.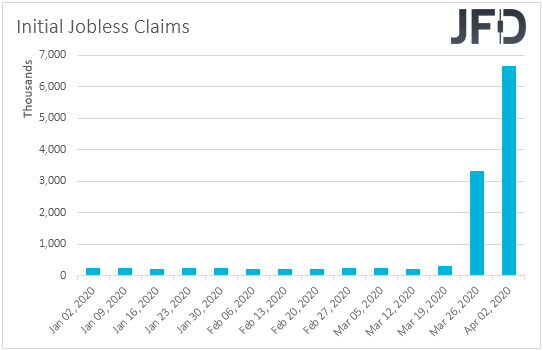
As for our overall view with regards to the virus saga, it hasn’t changed. We repeat that even if equities recover some more on signs that the fast spreading is eventually leveling off, we will stay reluctant to trust a long-lasting recovery.
We maintain the view that it is too early to call for a peak and that just a day with accelerating cases and deaths may be enough for market panic to return. As we noted yesterday, we believe that it is too early to call off the lockdowns, as such actions carry the risk for the virus to start spreading at an even faster pace.
LOONIE AWAITS CANADA JOBS DATA AND OPEC+ DECISION
Although the other commodity-linked currencies were found higher against their US counterpart, the Loonie traded virtually unchanged, perhaps as its traders stayed on guard for Canada’s jobs data and the outcome of the OPEC+ video conference meeting, both to be released and announced today.
With regards to the employment report, expectations are for the unemployment rate to have surged to 7.0% in March from 5.6%, while the net change in employment is forecast to show that the economy has lost 350k jobs after gaining 30.3k. This would be the worst print in Canada’s history, at least since we can find data from, and may raise speculation for more stimulus by the Bank of Canada.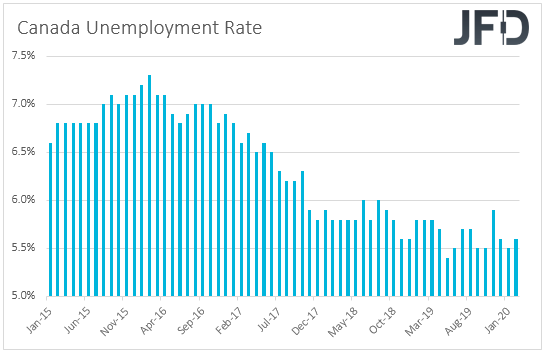
On March 27th, the Bank decided to slash interest rates to 0.25% and to launch a QE program in order to safeguard its economy from the effects of the coronavirus’s spreading. The Governing Council highlighted its readiness to take further action to support the economy and the financial system, but similarly with the RBA, they noted that the policy rate is now to its effective lower bound, which means that they are not willing to cut interest rates further.
Maybe they will decide to expand their QE program if the spreading of the virus threatens even more the outlook of the Canadian economy.
Having said all that though, even if the Canadian dollar slides on potentially disappointing employment data, its broader direction may depend primarily on movements in oil prices, as Canada is among the world’s biggest oil producing and exporting nations.
Last week, both Brent and WTI skyrocketed on speculation that Saudi Arabia and Russia may eventually agree on new production cuts to stabilize the energy market and thus, it remains to be seen whether this will be the case today and if so, whether the new cuts will be enough to offset the tumble in global demand due to the pandemic outbreak.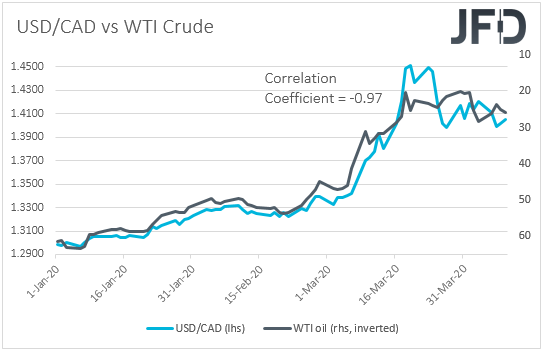
USD/CAD – TECHNICAL OUTLOOK
Overall, USD/CAD is stuck inside a descending triangle pattern. According to technical analysis rules, such patterns tend to be bearish, however, in order to examine lower areas, a break of the 1.3945 zone would be needed. For now, we will stay cautiously bearish and wait for a confirmation break.
As mentioned above, a drop below the 1.3945 hurdle, which is the lower side of the descending triangle, would confirm a forthcoming lower low. More bears may join in, especially if the pair slides below the 200 EMA on the 4-hour chart. Such a move could send USD/CAD to the 1.3787 obstacle, a break of which might set the stage for a test of the 1.3681 level, marked by the low of March 11th.
Alternatively, if the upper side of the descending triangle breaks and the rate travels above the 1.4143 barrier, marked near the high of April 7th, this could change the short-term outlook to a more positive one. We will then examine a potential test of the 1.4261 hurdle, a break of which could send USD/CAD to the 1.4349 level, marked by the high March 31st.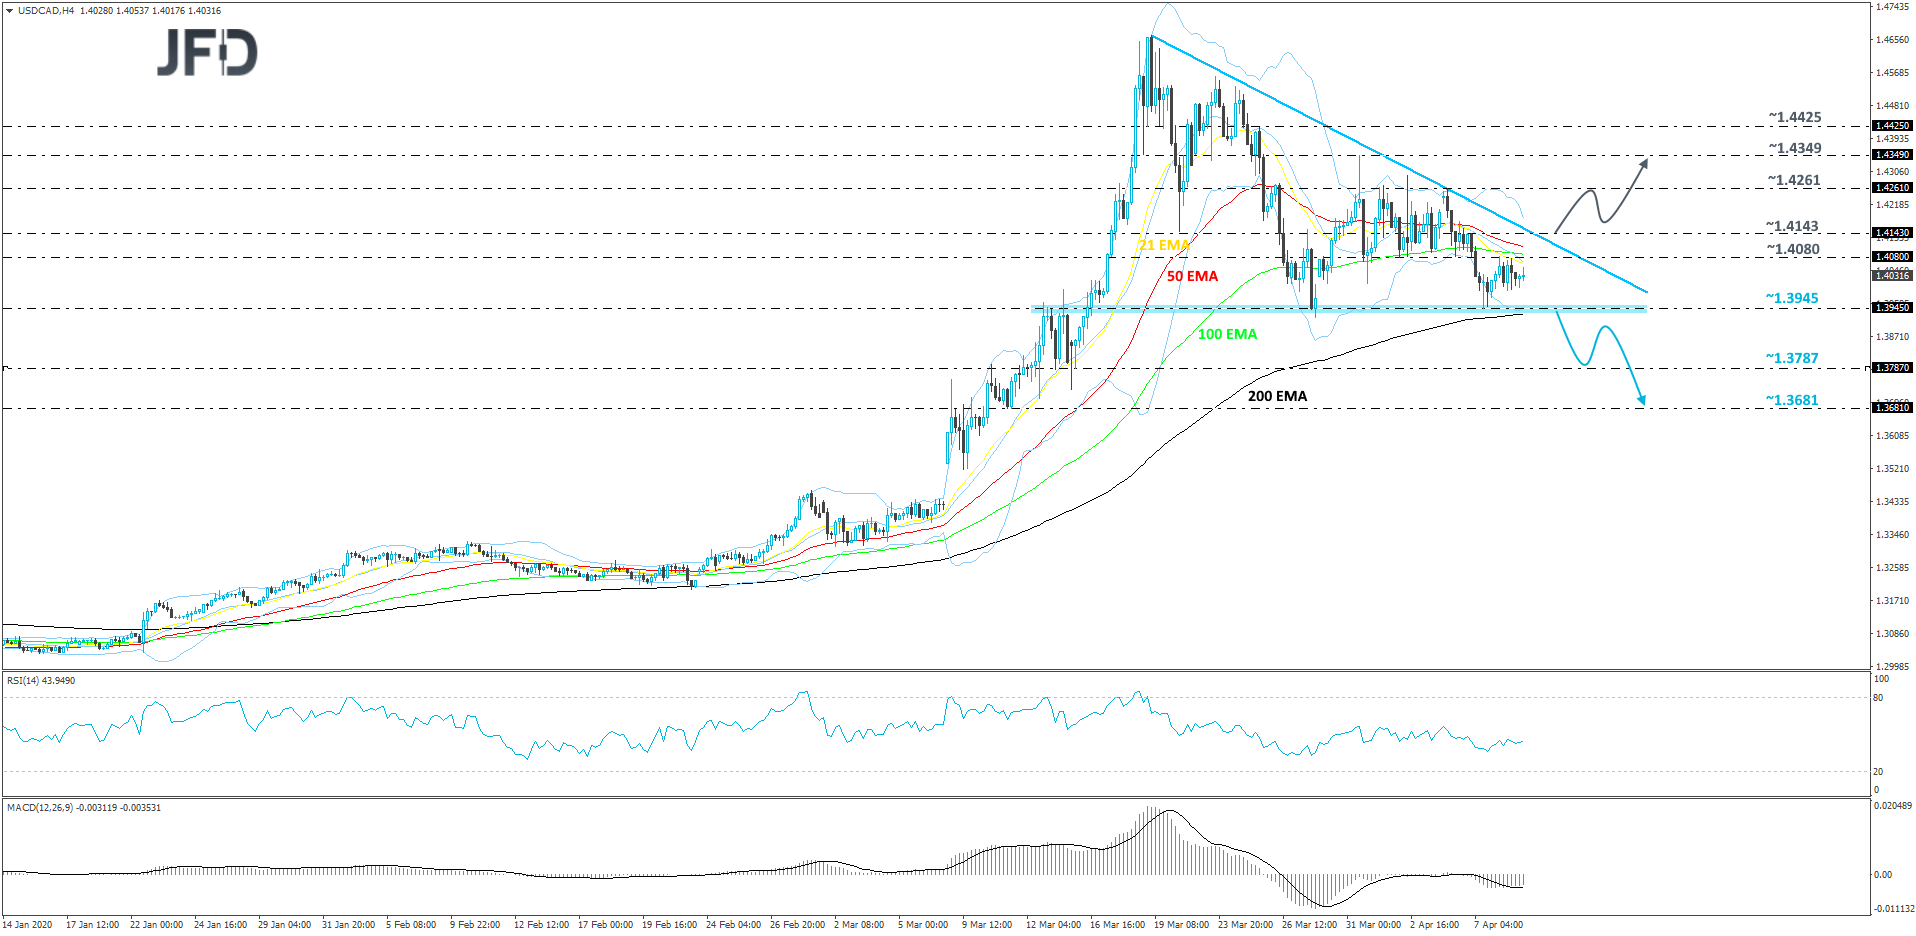
BRENT OIL – TECHNICAL OUTLOOK
After hitting an 18-year low in March, near the 22.55 hurdle, Brent oil rebounded and managed to recover a small part of its losses made from the beginning of this year. However, from the beginning of this week, we are seeing some sideways activity in the commodity, roughly between the 30.00 and 33.00 levels. For now, we wait for a clear break through one of those sides, in order to examine a further short-term directional move. Hence our neutral approach at the moment.
If the black liquid pops above the 33.00 barrier, this may interest a few extra buyers, who could join in and help Brent oil to move a bit higher. The commodity could then drift to the 200 EMA on the 4-hour chart, or might even test the 36.43 area, marked by the high of March 13th. The price may stall around there for a while, however, if the buyers are still interested the “black gold”, that could lead to a further uprise. The next potential resistance barrier to consider might be near the 39.94 level, which is the high of March 11th.
Alternatively, if Brent oil drops below the lower side of the aforementioned range, at 30.00, this might spook the bulls from the field temporarily and allow more bears to join in. That’s when we will target the 26.30 obstacle, a break of which may clear the path to the 22.55 level. That level marks the lowest point of March.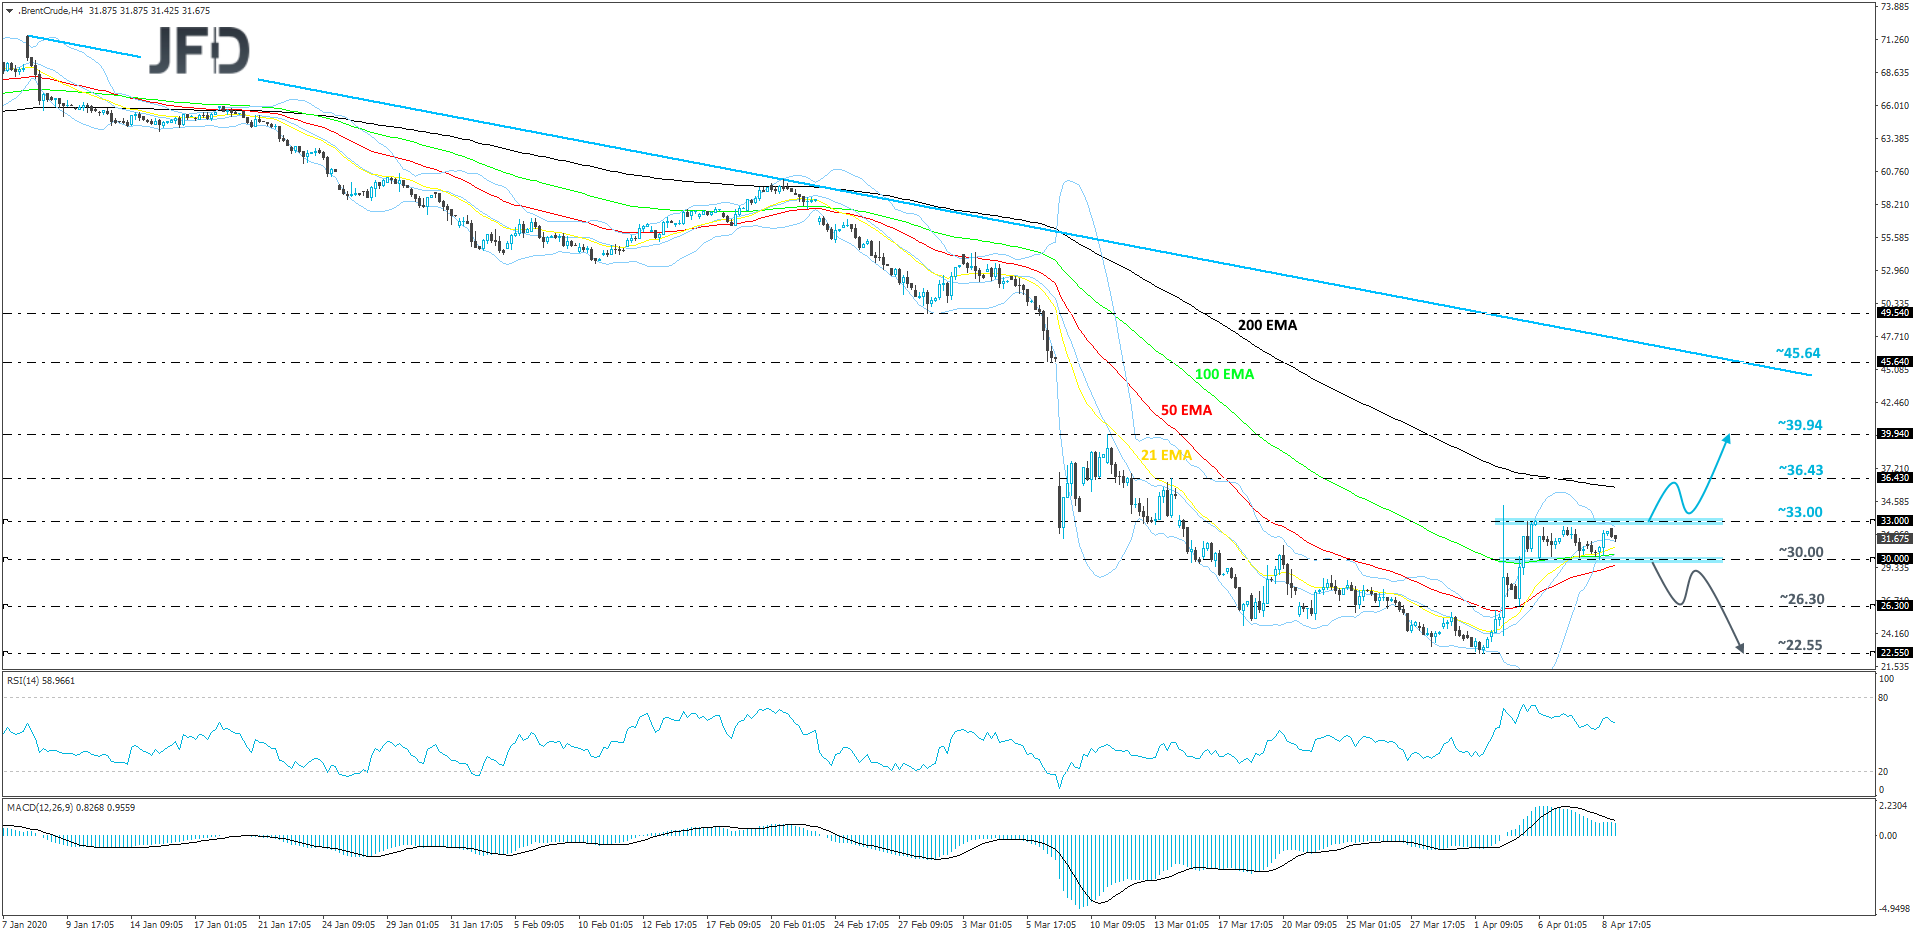
AS FOR THE REST OF TODAY’S EVENTS
In the UK, we have the monthly GDP, the industrial and manufacturing production, and the trade balance, all for the month of February. No forecast is available for the GDP rate, while both industrial and manufacturing productions are expected to have grown 0.2% mom from -0.1% and +0.2% respectively. The nation’s trade deficit is expected to have widened to GBP 6.00bn from GBP 3.72bn.
In any case, we believe that pound traders will prefer to pay more attention to data referring to the month of March, during which the coronavirus probably left more marks on the UK economy.
The ECB meeting minutes and the US PPIs for March are due to be released as well, but bearing in mind that the ECB has already proceeded with more measures after its latest ordinary meeting, and that investors may prefer to focus on the initial jobless claims with regards to the US data, we expect both of these releases to pass largely unnoticed.
As for tonight, during the Asian session Friday, we get China’s CPI and PPI for March. The CPI is expected to have slowed to +4.9% yoy from +5.2%, while the PPI rate is anticipated to have entered negative waters. Specifically, it is expected to have slid to -0.1% yoy from +0.8% in February.
- English (UK)
- English (India)
- English (Canada)
- English (Australia)
- English (South Africa)
- English (Philippines)
- English (Nigeria)
- Deutsch
- Español (España)
- Español (México)
- Français
- Italiano
- Nederlands
- Português (Portugal)
- Polski
- Português (Brasil)
- Русский
- Türkçe
- العربية
- Ελληνικά
- Svenska
- Suomi
- עברית
- 日本語
- 한국어
- 简体中文
- 繁體中文
- Bahasa Indonesia
- Bahasa Melayu
- ไทย
- Tiếng Việt
- हिंदी
U.S. Jobless Claims, Canada Jobs Data And OPEC+ Decision In Focus
Published 04/09/2020, 04:03 AM
Updated 07/09/2023, 06:31 AM
U.S. Jobless Claims, Canada Jobs Data And OPEC+ Decision In Focus
3rd party Ad. Not an offer or recommendation by Investing.com. See disclosure here or
remove ads
.
Latest comments
Trump Threatens “Very Substantial” Tariffs On Oil Imports
By Haley Zaremba - Apr 10, 2020, 5:00 PM CDT
Install Our App
Risk Disclosure: Trading in financial instruments and/or cryptocurrencies involves high risks including the risk of losing some, or all, of your investment amount, and may not be suitable for all investors. Prices of cryptocurrencies are extremely volatile and may be affected by external factors such as financial, regulatory or political events. Trading on margin increases the financial risks.
Before deciding to trade in financial instrument or cryptocurrencies you should be fully informed of the risks and costs associated with trading the financial markets, carefully consider your investment objectives, level of experience, and risk appetite, and seek professional advice where needed.
Fusion Media would like to remind you that the data contained in this website is not necessarily real-time nor accurate. The data and prices on the website are not necessarily provided by any market or exchange, but may be provided by market makers, and so prices may not be accurate and may differ from the actual price at any given market, meaning prices are indicative and not appropriate for trading purposes. Fusion Media and any provider of the data contained in this website will not accept liability for any loss or damage as a result of your trading, or your reliance on the information contained within this website.
It is prohibited to use, store, reproduce, display, modify, transmit or distribute the data contained in this website without the explicit prior written permission of Fusion Media and/or the data provider. All intellectual property rights are reserved by the providers and/or the exchange providing the data contained in this website.
Fusion Media may be compensated by the advertisers that appear on the website, based on your interaction with the advertisements or advertisers.
© 2007-2024 - Fusion Media Limited. All Rights Reserved.