Review and Update
Two week’s ago, I wrote an article entitled “Oversold Bounce Or Return Of The Bull,” wherein I laid out the probabilities of a short-term rally due to the oversold condition that existed at that time.
Then, this past Tuesday, I updated that analysis with “Return Of The Bull…For Now,” as the expected rally in stocks, and reversal in bonds, took shape. (Also, review that post for individual sector and major market analysis.)
With this background, we can review the markets through the close on Friday and make some assessments of risk versus reward, and ultimately positioning, heading into the coming week.
Last week, the expected market rally on Monday and Tuesday was strong enough to push the S&P 500 out of its previous corrective downtrend. That’s the good news.
The not so good news is the market failed to obtain new highs and, as noted two weeks ago, has tripped the first signal as shown below. This “warning signal” as we discussed then, keeps a potential lid on stock prices for now particularly since it was registered from such high levels. More importantly, we are closing in on a secondary “sell signal,” also from an extremely high level, which would also suggest further price weakness and would raise caution levels higher.
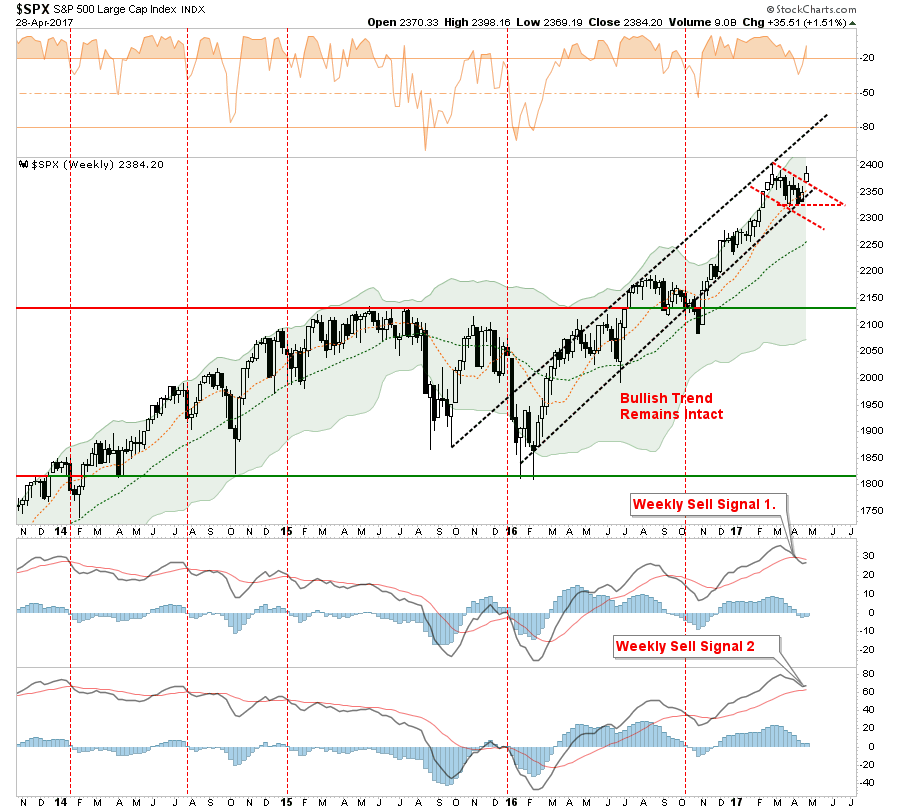
If the markets can continue to rally in the coming week, and push to new highs, then both of those signals will reverse. The problem is the reversal from high levels historically has only been short-lived before a more significant decline took place as shown in the chart below.
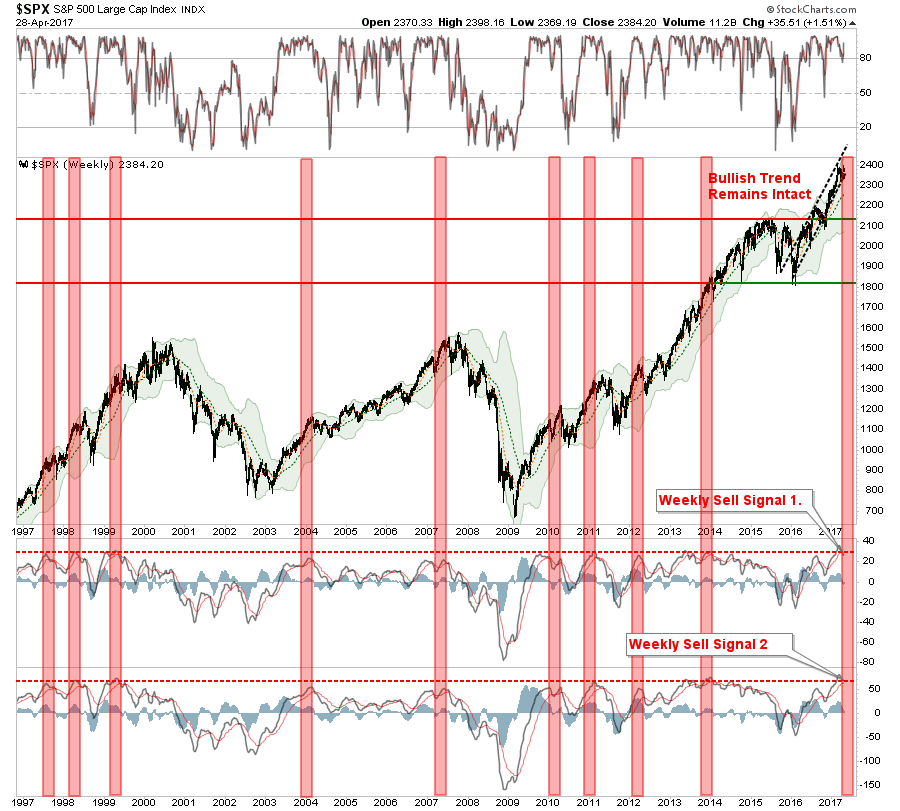
As I noted last weekend:
“With portfolios already hedged, as we added a lot of bond and interest rate sensitive holdings back in January, there is no action to take currently. This is why, for now, it is only an ‘alert’ that something more important is developing.”
The daily chart below shows that much of the oversold condition that existed two weeks ago has now been resolved. While not overbought as of yet, notice previous two red blocks were associated with short-term topping processes, there is currently not a tremendous amount of “fuel” left for a continued advance.
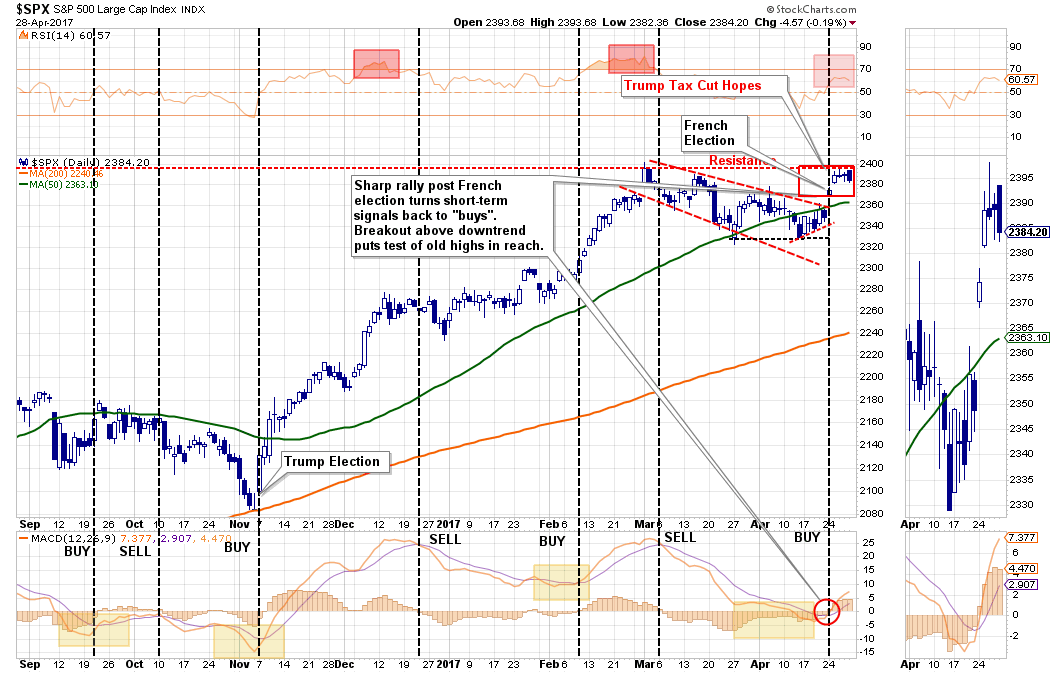
With the market on a short-term “buy signal,” deference should be given to the probability of a further market advance heading into May. With earnings season in full swing, there is a very likely probability that stocks can sustain their bullish bias for now.
However, despite the “bullish exuberance” over the past few days, it should be noted the markets remain in a broader “topping pattern” since the beginning of March with internal measures remaining very weak. The chart below shows the previous “topping patterns” over the last couple of years and currently. Previously, these topping patterns have resolved themselves by correcting. Sure, this time could certainly be different, but the deterioration in the internals should be paid attention to.
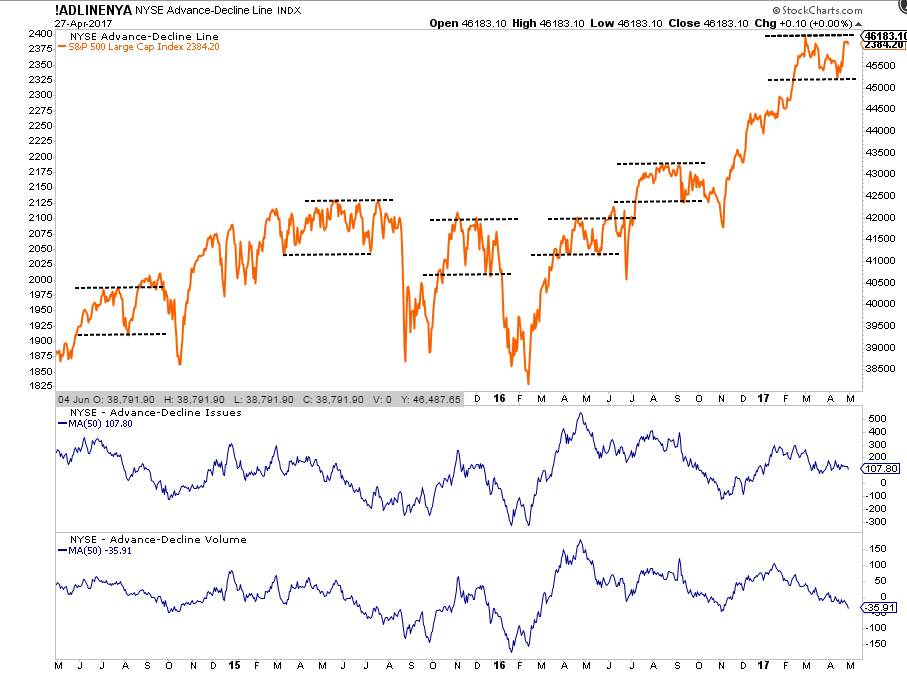
Furthermore, both the ratio and number of stocks above their respective 50 and 200 day moving averages has also remained weak.
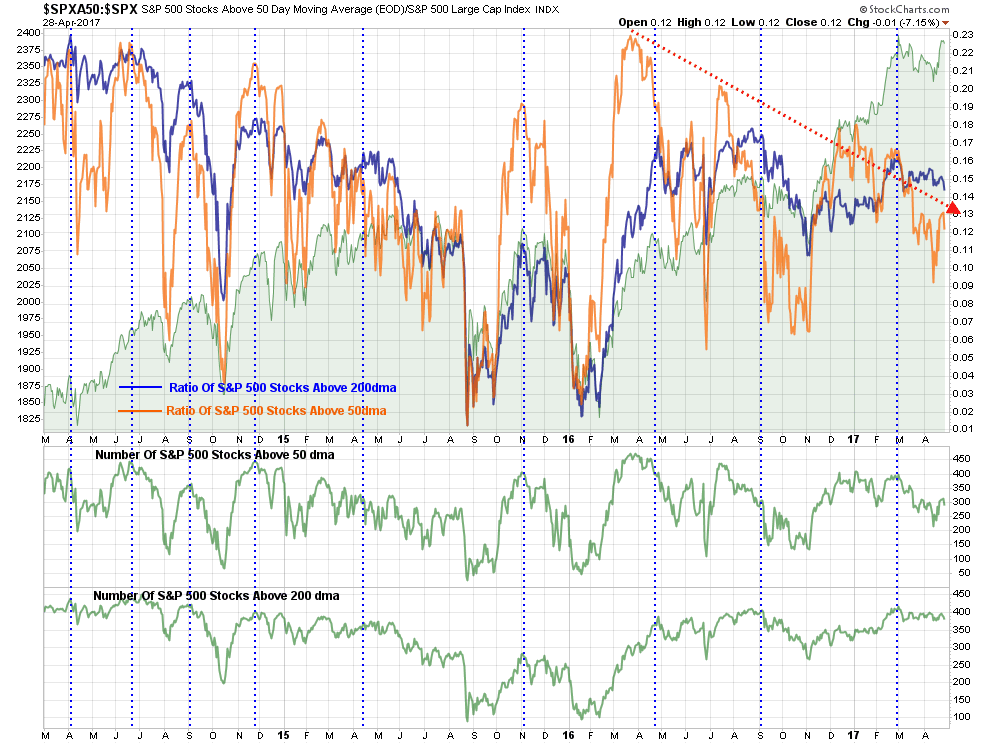
Importantly, I am not suggesting the markets are about to enter the next great “bear market phase,” but I am suggesting that upside is likely rather limited at the current time so maintaining reduced risk exposure, and higher than normal levels of cash, may be advisable in the near term.
This is particularly the case as we head into typical summer weakness as noted last week by Nautilus Research.
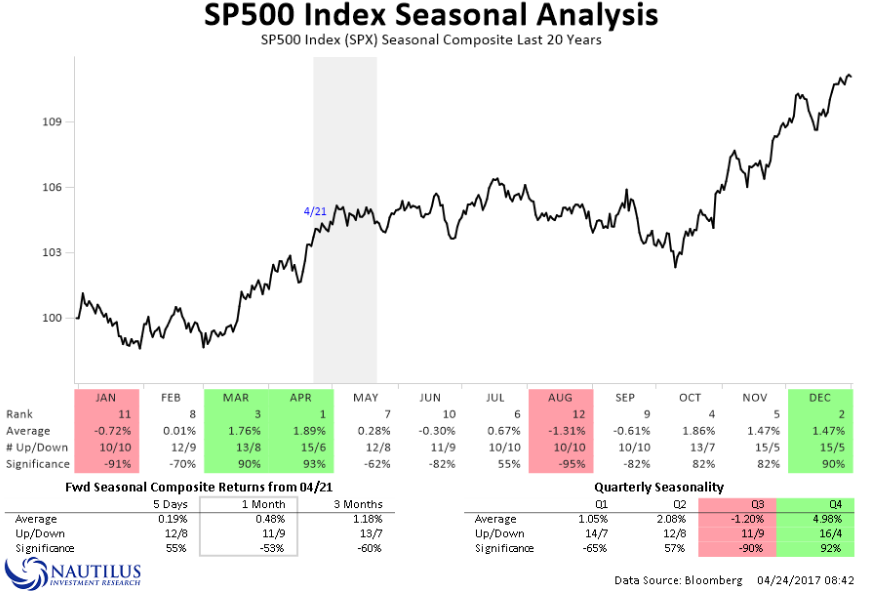
With the understanding the markets are currently on an intermediate term sell signal and returning back to an overbought condition in the short-term, the current rally should likely be used for portfolio repositioning and rebalancing. However, such a statement does NOT mean “cashing out” of the market as the bull market trend remains intact. Maintain, appropriate portfolio “risk” exposure for now, but cash raised from rebalancing should remain on the sidelines until a better risk/reward opportunity presents itself.
From last week:
PORTFOLIO ACTION GUIDELINES
“Given this is only a “warning signal” currently, any RALLY in the next week should be used to take some action within portfolios. The following list provides some basic guidelines.
- Trimming back winning positions to original portfolio weights: Investment Rule: Let Winners Run
- Sell positions that simply are not working (if the position was not working in a rising market, it likely won’t in a declining market.) Investment Rule: Cut Losers Short
- Hold the cash raised from these activities until the next buying opportunity occurs. Investment Rule: Buy Low
These actions will temporarily reduce portfolio risk and raise cash levels which either provides a “hedge” against a subsequent downturn OR cash to buy better-performing assets if conditions improve.
For now, the market remains in a bullish trend. Outside of small tweaks and close monitoring, nothing has occurred, yet, which would warrant more drastic movements within the allocation model.
Caution, nothing more, is advised for now.”
Trumponomics Hits Hard Realities
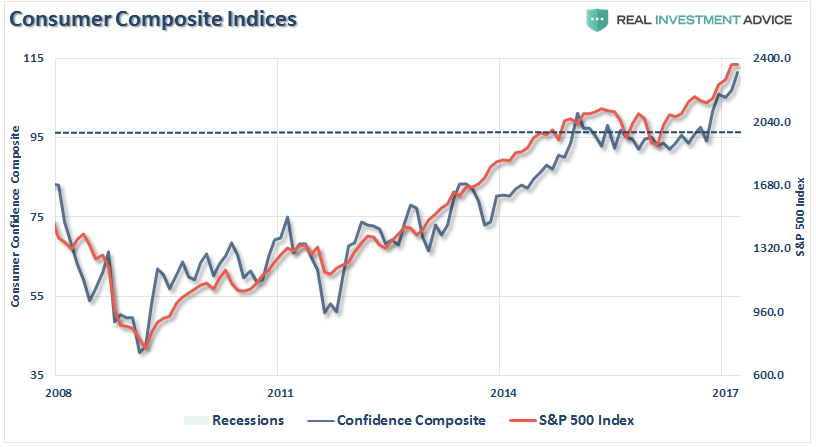
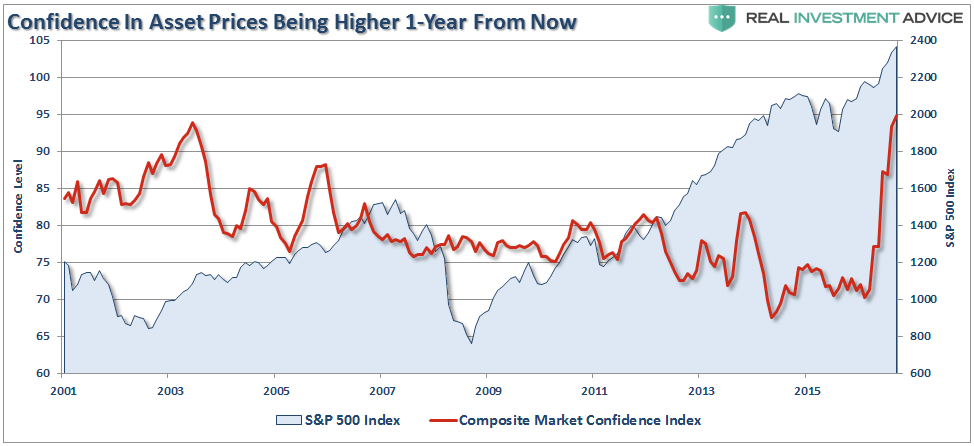
Since the election, consumer confidence has surged to historically high levels as shown in the chart below which is a composite of both Conference Board and University Of Michigan consumer confidence levels. Not surprisingly, stock prices track the trend of consumer confidence historically.
Also, not surprisingly, investor confidence has surged just as sharply since the election along with the rise in asset prices. Over the last couple of decades, the International Center for Finance at Yale University has regularly surveyed both individual and institutional investors and asked them about their views of the market. As you can see, investors have gotten extremely bullish about potential future “positive” returns from the market over the next year, whereas just one year ago not so much.
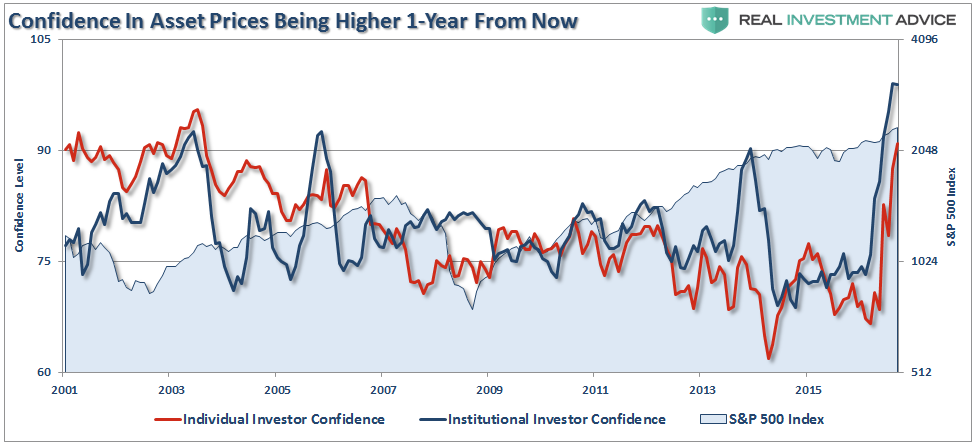
I have combined both the individual and institutional surveys into a composite index for a little better clarity.
Interestingly, despite the surge in confidence, the economy has failed to pick up traction. While the general consensus has been the “hard” economic data will surge to catch up with “booming” confidence, such is yet to be the case. Such was the message delivered Friday in the Q1-Gross Domestic Product report which showed an initial estimate of just 0.7% growth. The biggest issue with the report was the sharp slide in Personal Consumption Expenditures which comprises roughly 70% of overall economic growth which fell to just 0.23% on an annualized basis.
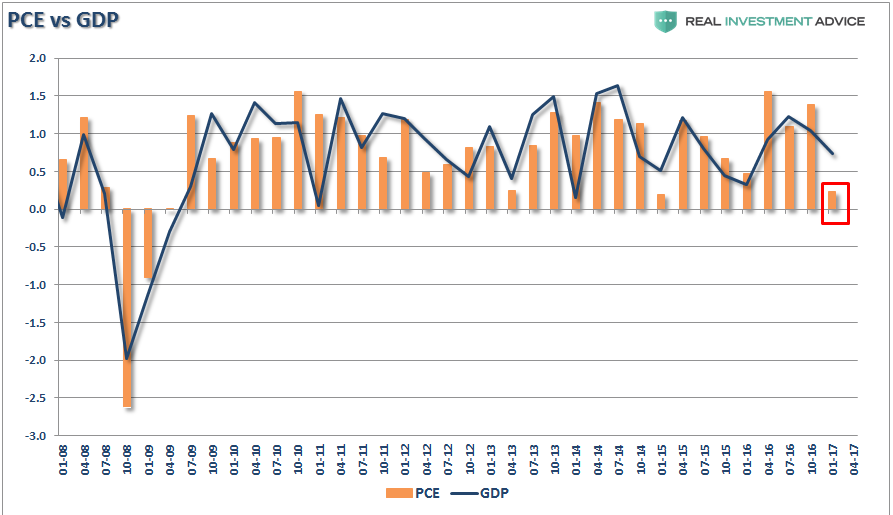
In other words, while consumers are extremely ebullient in their “hopes,” they are not acting that way.
You will notice, however, while the weakness in the Q1 PCE was apparent, it is also not an anomaly. We have seen these slides in the past which usually pick up in Q2 as the businesses begin a “restocking cycle” for the summer. The difference this time, unlike the last, is the marked rise in consumer credit delinquency rates, decline in auto sales and decreases in lending activity.
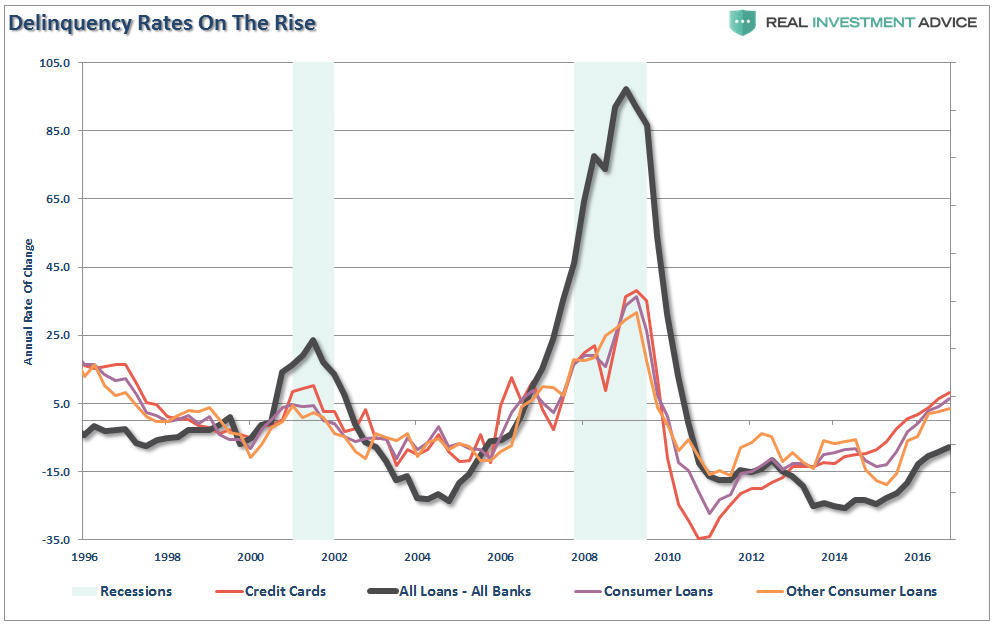
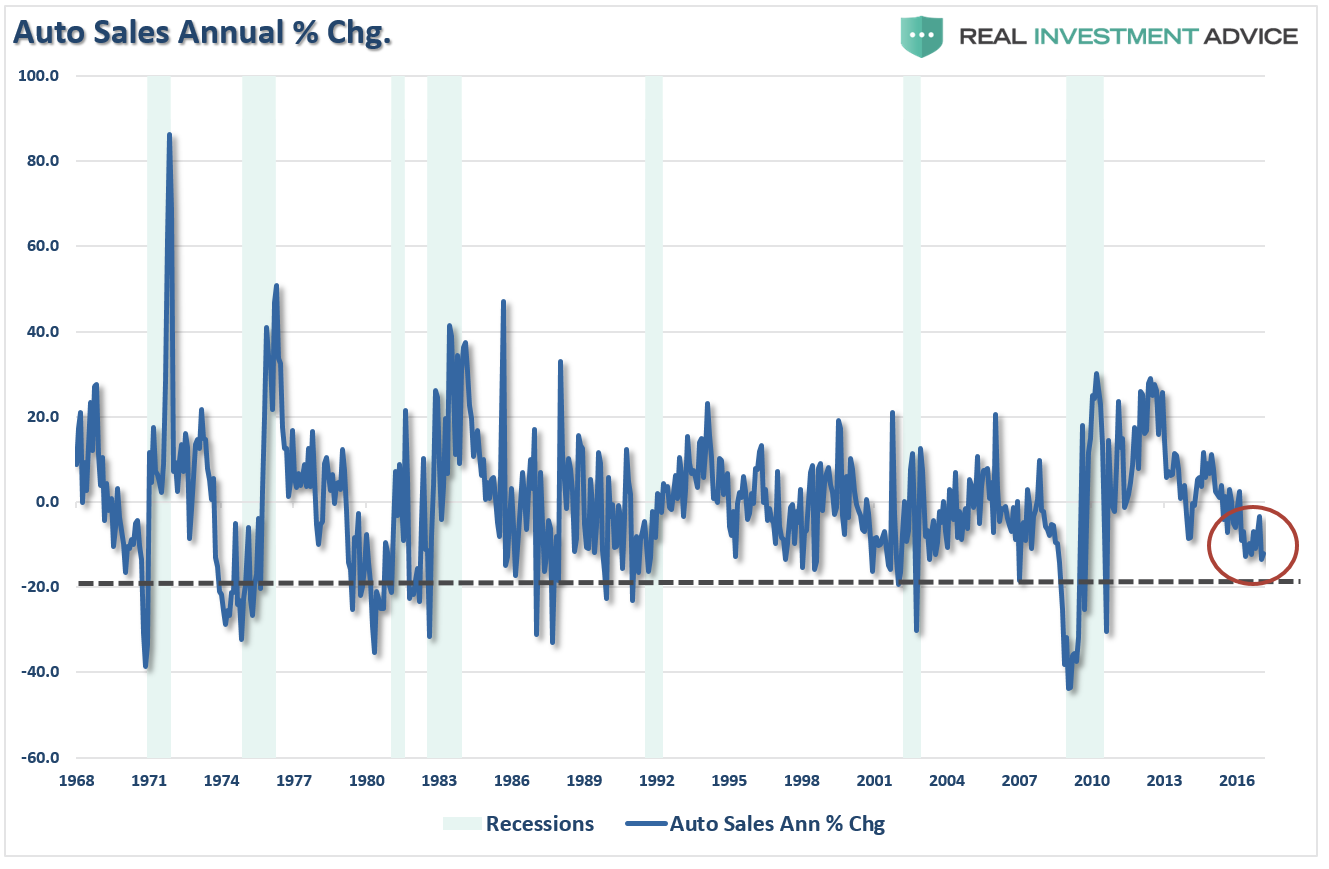
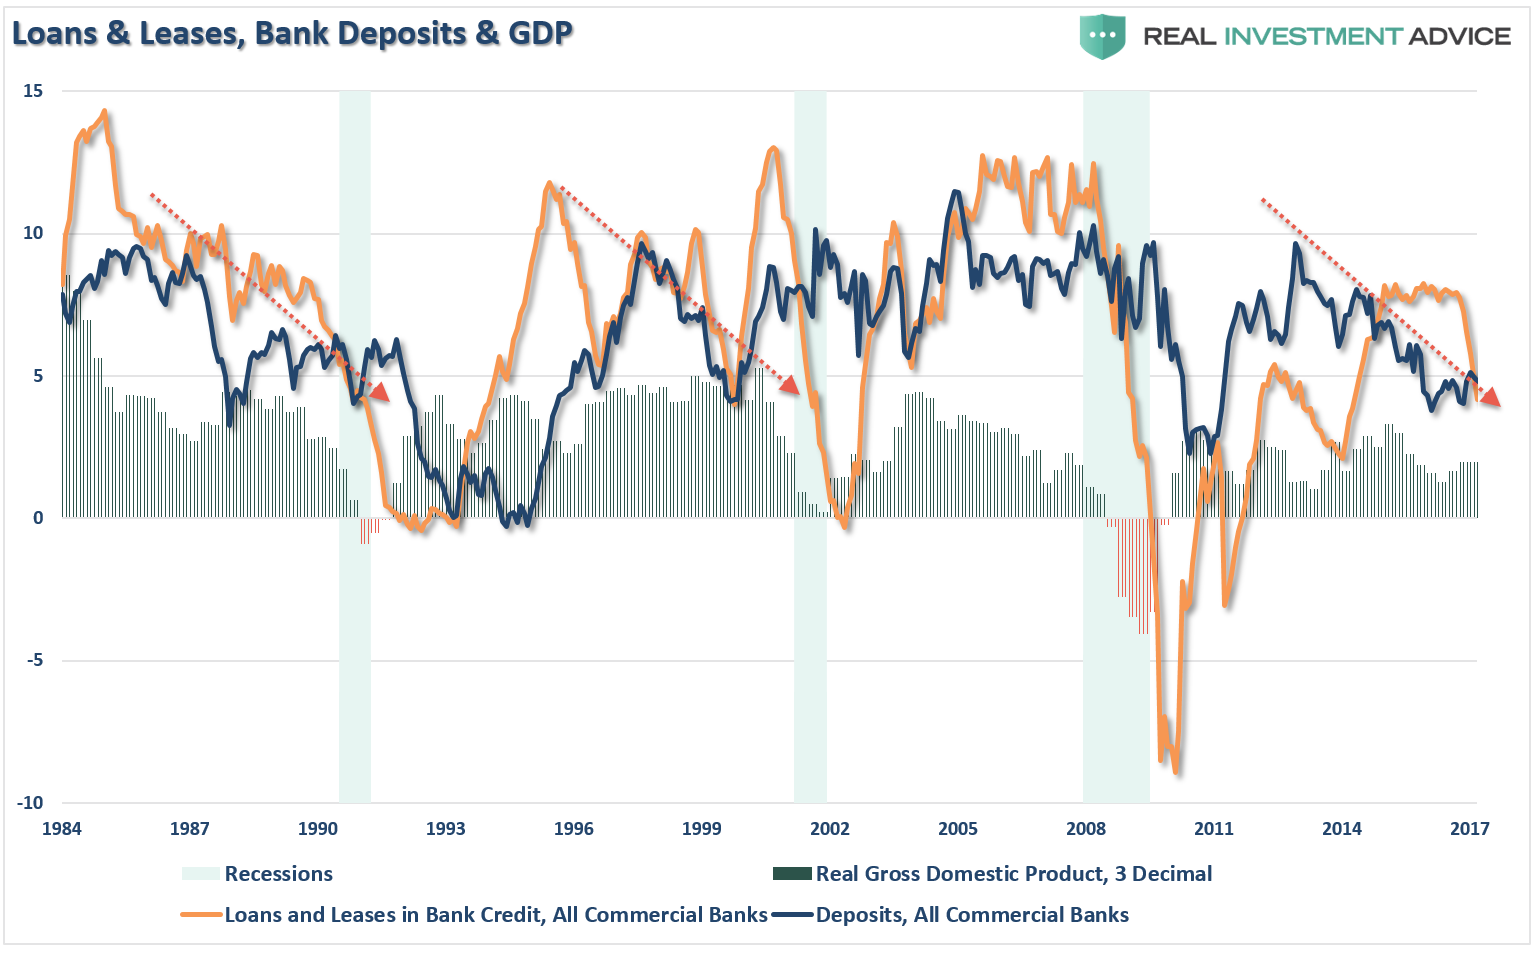
Here is the point. While there is much “hope” that “Trumponomics” will create the economic lift needed to spur further economic growth, it is critically important to remember economic cycles DO have a life span to them. While monetary and fiscal policies do impact these cycles, one must also consider the point within the current cycle when those policies are implemented.
Lastly, and most importantly, as I wrote previously is “Records Are Records For A Reason,:”
“Record levels” of anything are records for a reason. It is where the point where previous limits were reached. Therefore, when a ‘record level’ is reached, it is NOT THE BEGINNING, but rather an indication of the MATURITY of a cycle. While the media has focused on employment, record stock market levels, etc. as a sign of an ongoing economic recovery, history suggests caution.”
At the end of last year, based on the “hopes” of the new Administration policies, the Economic Cycle Research Institute’s (ECRI) Weekly Leading Index (WLI) spiked to a peak not seen since 2007.
It was a record.
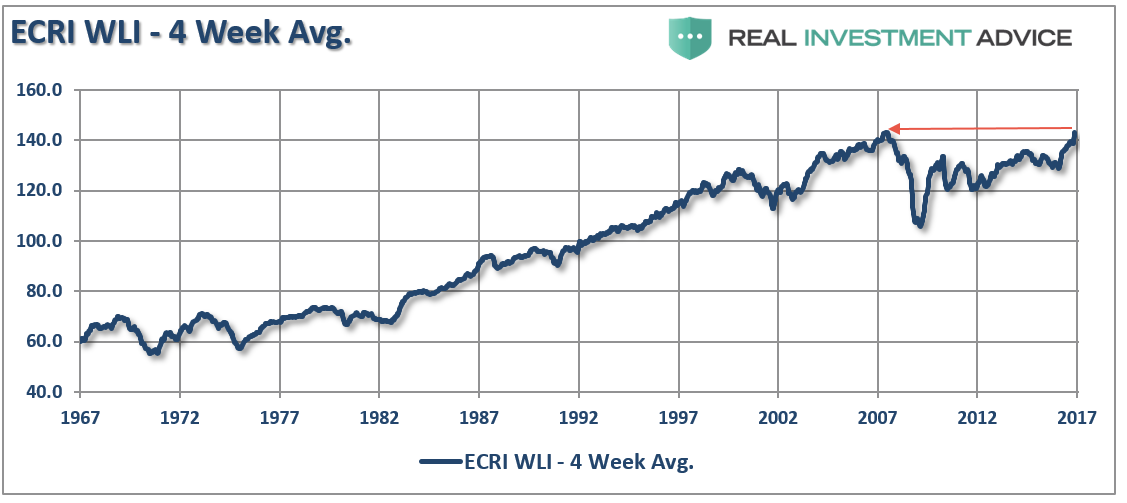
This was important because there is a historically close correlation between the ECRI WLI and GDP as shown in the chart below. I have also included the Chicago Fed National Activity Index (CFNAI) which is a very broad measure of economic activity consisting of roughly 85 subcomponents.
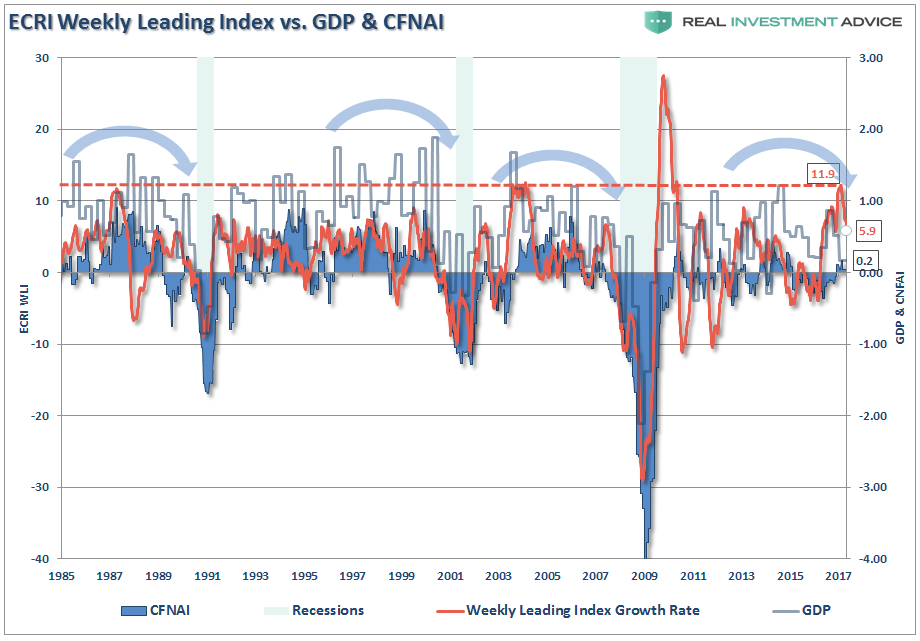
There have only been 3-other periods since 1985 where the WLI achieve levels as witnessed at the end of 2017. The difference, however, was that GDP and the CFNAI were growing at substantially stronger rates than currently seen. As I wrote at the end of December when the WLI was at 11.9:
“The significant divergence between the WLI and CFNAI measures are concerning as such divergences have tended to correct themselves over the next several months with the WLI correcting back towards the CFNAI.”
As expected then, the WLI has now fallen to just 5.9 as of the last update along with the decline in GDP and weakness in the CFNAI. Importantly, notice the overall TREND of the economic data is weaker, versus stronger, which has also been a hallmark of a “late stage” economic cycle.
The importance to investors is that recessionary spats in the economy lead to rather sharp price reversions as future growth expectations are ratcheted lower. Historically, the average “mean reverting” event has been roughly 30%.
While I am not suggesting a “recession” is about to start tomorrow, I am stating that “recessions are a fact of every economic cycle.”
For every economic recovery there is a recession and for every “bull market” there is a “bear market.”
These are the fact of life. While “timing” is always key, “ignoring” the fundamental factors has repeatedly proved dangerous to investors over time.
As I noted last week – “This Time Is Not Different.”
Hoping it will be has been costly in the past.
As investors “our goal” is to make money during the first half of the full market cycle, however, “our job” is to ensure that we keep it during the second half.
With investors now the most “exuberant” about the stock market since the turn of the century, it is worth reviewing what happened the last time that such a record was set.
Records are records for a reason.
See you next week.
Market and Sector Analysis
Data Analysis Of The Market and Sectors For Traders
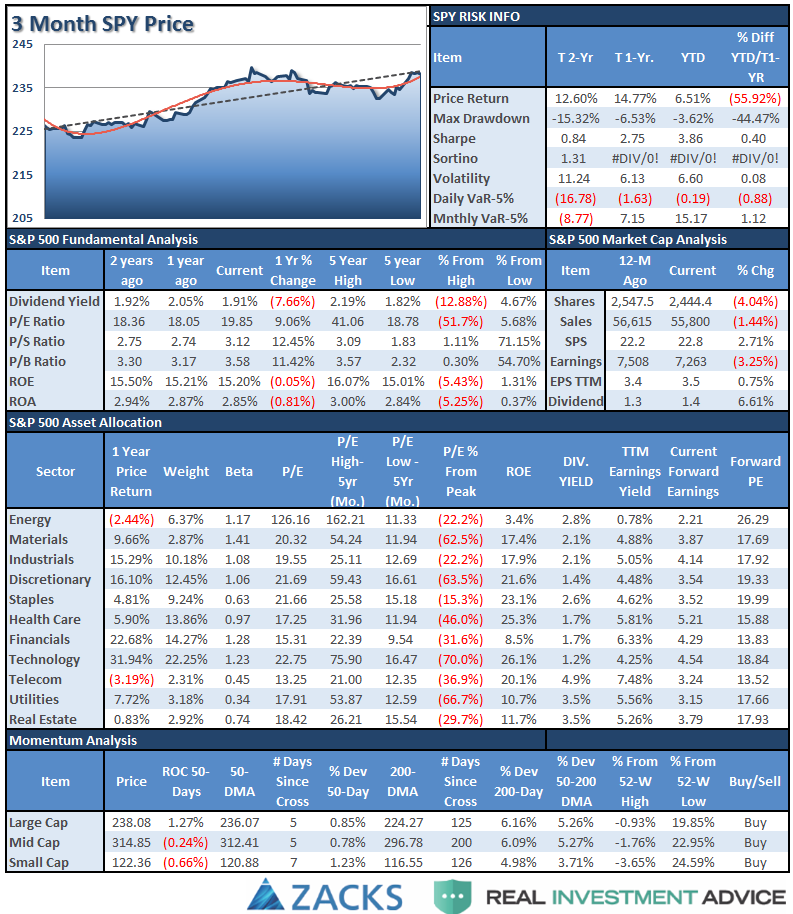
S&P 500 Tear Sheet
The “Tear Sheet” below is a “reference sheet” provide some historical context to markets, sectors, etc. and looking for deviations from historical extremes.
If you have any suggestions or additions you would like to see, send me an email.
Sector Analysis
As I stated last week:
“The markets must significantly gain traction next week if a deeper correction is to be avoided for now.”
On Monday and Tuesday, the markets rocketed higher on a massive short-covering squeeze as disaster was avoided in the French elections and rumors about the “Trump Tax Cuts” announcement swirled. In the end, it was a big “nothing burger” and the markets retraced a smidgen of their early week gains through Friday.
With that being said, the overall back drop remains BULLISH for now. I do remain somewhat cautious on allocations currently given, as discussed at the start of this missive, the “weekly sell signal” alert remains intact currently and at a high level.
However, let me reiterate, I remain long-biased in portfolios currently, but am also maintaining fairly tight stop-loss levels as well as hedges currently. Although we did lighten up on those hedges two weeks ago.
Let’s get to the sector analysis. (See last Tuesday’s Technically Speaking post for a deeper analysis on each sector and index covered here.)
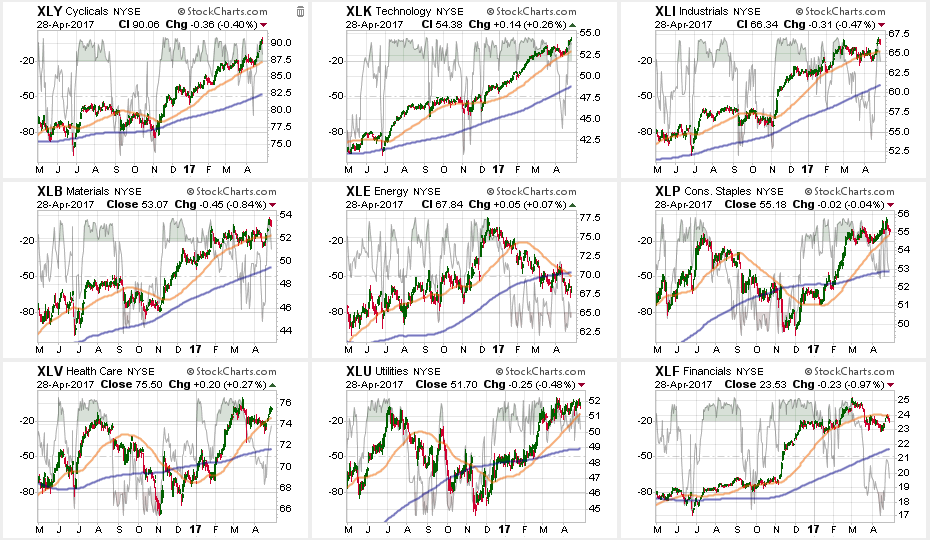
Despite the ongoing struggles with the “retail sector,” Discretionary stocks bounced off their 50-dma last week and surged higher to extreme overbought levels. Take some profits by rebalancing weights in portfolios but remain long the sector for now.
Technology, Industrials, and Materials sectors bounced last week as the “Trump Trade” swung back into action on the potential for “tax cuts.” However, this trade will likely come into trouble over the next couple of months as “anticipation” fails to turn into “reality.” Maintain model portfolio weights for now as the bullish trend remains positive, but raise stop levels.
Energy continues to struggle after breaking its 50-dma and 200-dma. While energy had a bit of a bounce, the bounce failed to hold and the sector continues to weaken along with oil prices. Energy has also triggered a major sector sell signal with the cross of the 50-dma below the 200-dma. Remain heavily underweight energy for the time being.
Financials recently broke its 50-dma and a failed rally last week at that level of resistance keeps investors underweight the sector for now.
Healthcare, Utilities, and Staples continue to maintain strength but did weaken a bit as of late. As stated, we did trim back on some of these hedges against the “Trump Trade,” but they are still performing well currently to offset weakness in the broader market.
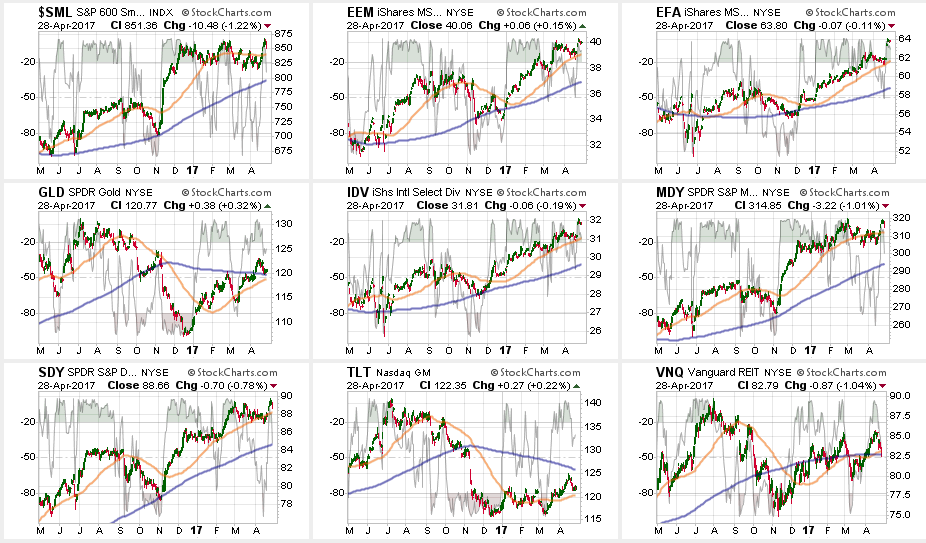
Small- and Mid-cap stocks found some “muster” last week on a short-covering rally following the French election. The question of sustainability of that strength will be answered this coming week. Continue to hold current positions (after recommending to take some profits recently) for now. A break of the multiple-bottom lows is now the “full stop.”
Emerging Markets, International, and Dividend Yielding Stocks (via IDV and SDY) also reversed recent weakness following the French election as shorts were forced to cover. Having already taken profits a few weeks ago, hold these sectors for now, but stop levels should be moved up to the recent bottoms.
Bonds and REITs – last week I recommended taking profits from these hedges as they had become extremely overbought. I stated then:
“If the broader markets can rally over the next week or two, simply due to a reflexive oversold condition, look for these sectors to pull back to provide a better entry point.”
This has been the case. Now we wait to see what happens next.
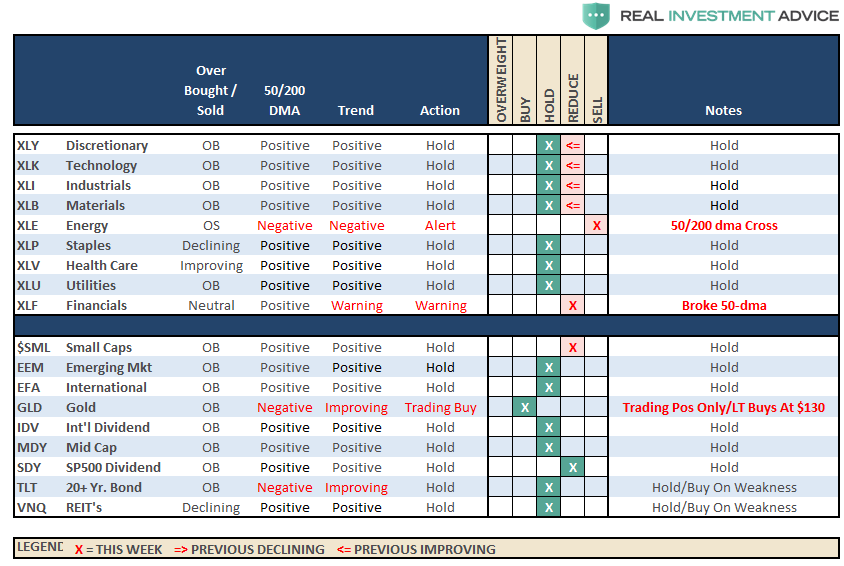
The table below shows thoughts on specific actions related to the current market environment.
(These are not recommendations or solicitations to take any action. This is for informational purposes only related to market extremes and contrarian positioning within portfolios. Use at your own risk and peril.)
Portfolio Update:
After hedging our long equity positions at the beginning of the year with deeply out-of-favor sectors of the market (Bonds, REIT’s, Staples, Utilities, Health Care and Staples) we did rebalance some of our long-term CORE equity holdings back to original portfolio weightings harvesting a bit of liquidity.
While the bullish trend is still positive, which keeps us allocated on the long side of the market, the weekly “sell signal” alert is not being dismissed.
However, the rally last week did shore up some of the short-term weakness in the market, and we are looking for a pullback to either support, or a breakout to new highs, for an opportunity to put some of the recently harvested cash back to work on the long side.
We are currently maintaining “new money” in short-term cash positions and only selectively stepping into core long-term holdings with tight stop-loss levels. We continue to maintain very tight trailing stops as the mid to longer-term dynamics of the market continue to remain very unfavorable.
