Last week, I asked a simple question:
Was Monday’s rally an oversold bounce or the return of the “bull market?
As I stated then, the short-term oversold condition of the market set the stage for a rally. I updated the analysis on Saturday discussing the two possible paths of the market this week.
As expected the market did rally last week. As I noted it would be the success or failure of the rally attempt which would dictate what happens next.
- If the market can reverse course next week, and move back above the 50-dma AND break the declining price trend from the March highs, then an attempt at all time highs is quite likely. (Probability Guess = 30%)
- However, a rally back to the 50-dma that fails will likely result in a continuation of the correction to the 200-dma as seen previously. From current levels that would suggest a roughly -5% drawdown. However, as shown below, those drawdowns under similar conditions could approach -15%. (Probability Guess = 70%)
As of Friday, the market failed at resistance closing below the 50-dma for the week. As denoted by the red dashed lines, the current price action of the market being compressed within a downtrend.
A “breakout” will likely occur next week which will fulfill one of the two potential outcomes noted above.
Chart updated through Monday’s open.
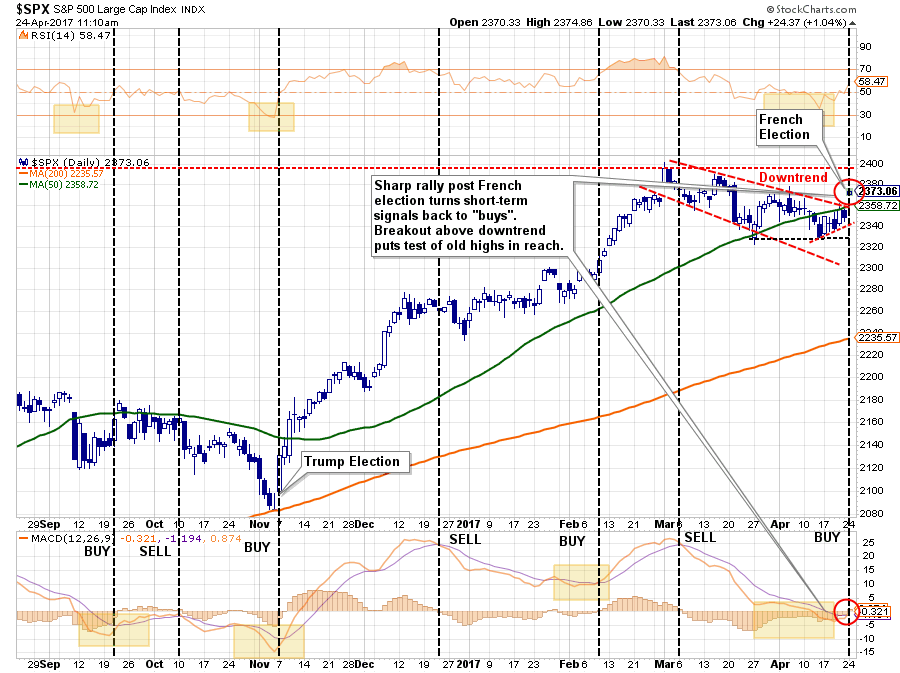
As noted the “breakout” did occur which sent the markets pushing back above both the 50-dma and the previous downtrend resistance from the March highs. The “short covering” surge following the French elections now puts a retest of old highs within reach. As noted last week, the oversold condition is the “fuel supply” for the rally.
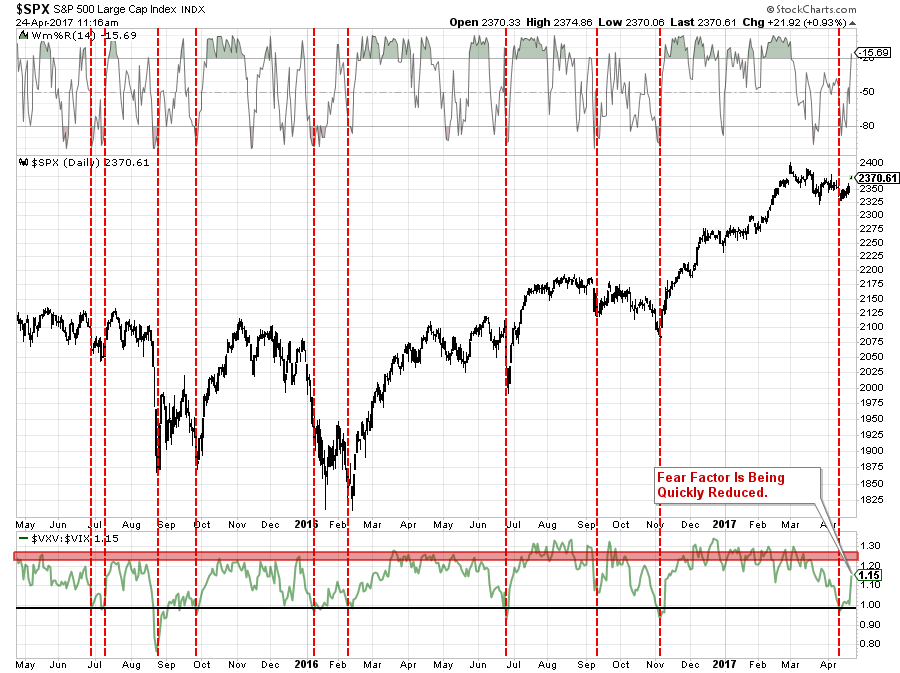
The chart below is the ratio between the 3-Month Volatility Index and the Volatility Index (VIX). As shown, when this ratio declines to 1.00, or less, it has generally coincided with short-term bottoms in the market.
Importantly, for the roughly one-percent rally on Monday, there was a significant reduction in the “fear” of the market suggesting that while we may indeed get an attempt at old highs, it may well not be much more than that. Also, the 14-period Wm%R indicator has already swung from extreme oversold to extreme overbought with Monday’s move as well. Again, the “fuel” for the rally is being quickly absorbed which suggests a rather limited advance heading into the seasonally “weak” period of the year.
On an intermediate term basis, the market is still wrestling with an overall downtrend currently as shown below. The good news is the rally on Monday has kept the secondary “sell” signal, bottom of chart, from being registered. If the secondary signal is registered it would suggest a more cautionary approach to portfolio allocations. As shown below, during previous periods where both signals were in play, vertical dashed red lines, it coincided with deeper corrections, if not immediately, in the near future.
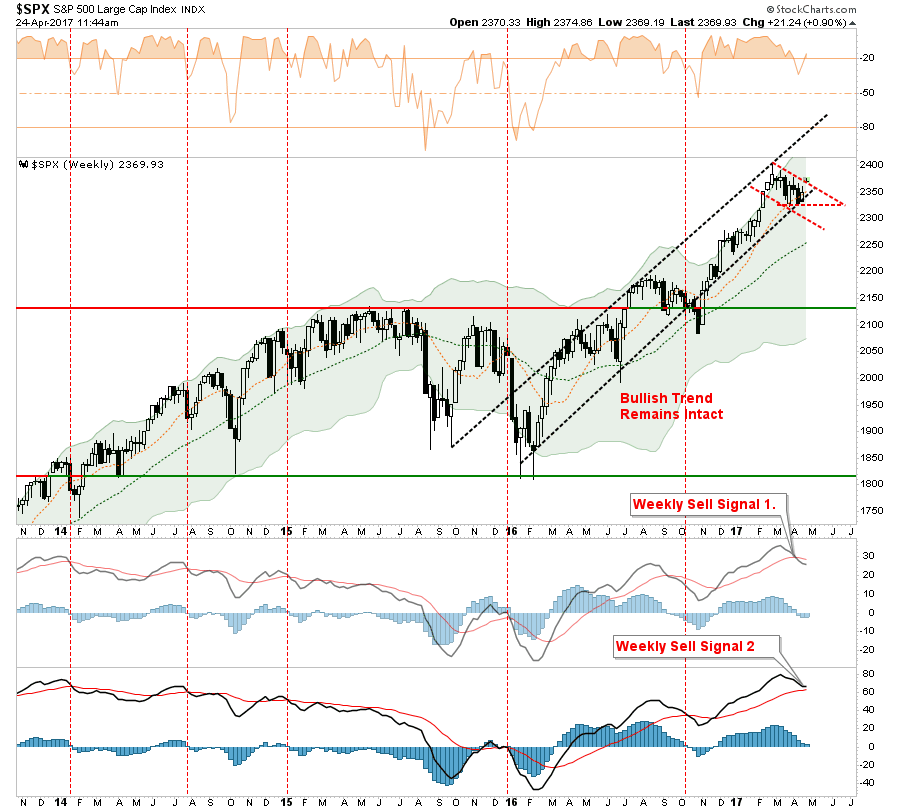
However, for now, it is clear the bullish trend on both a daily and weekly basis remains intact. This keeps portfolio allocations on the long side for now.
Sector By Sector
With that bit of analysis in place, let’s review the market environment for risks and opportunities.
ENERGY
The OPEC oil cut has likely run the majority of its course and with Permian Basin production on the rise, the pressure on oil prices from supply/demand imbalances remains an issue.
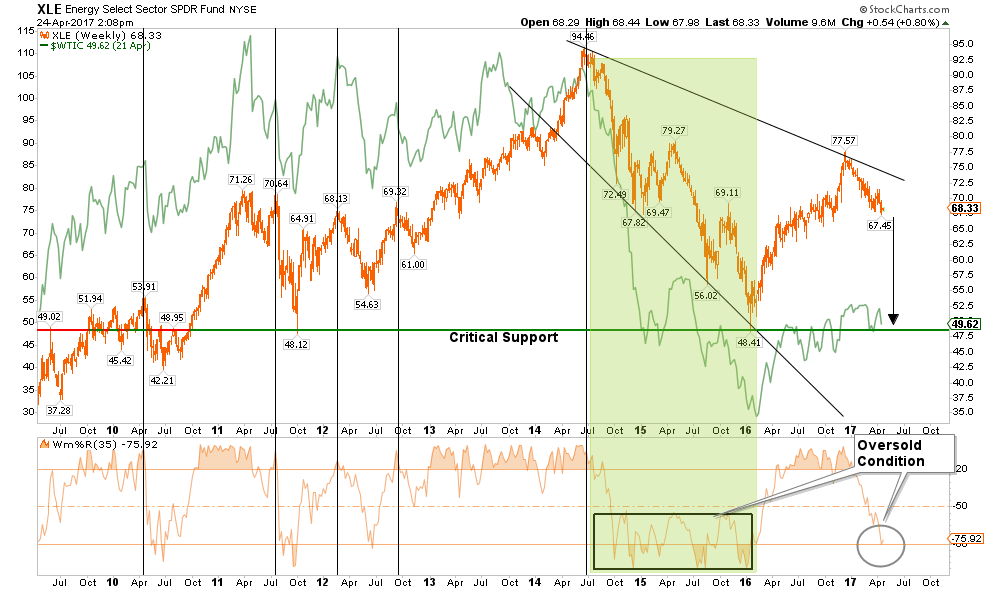
However, the recent test of $48/bbl support provides a support level currently, but a break of that level will likely see oil sliding back to the low 40’s. While energy-related earnings have helped the overall S&P 500 earnings rebound over the last quarter, it is likely transient and forward earnings estimates will likely have to be ratcheted down rather sharply for the rest of the year.
Currently, the energy sector remains in a negative trend and suggests a further decline in oil prices will likely lead the sector substantially lower. Importantly, while the sector is oversold enough for a bounce in the short-term, it is not unprecedented for the sector to remain oversold during a continued decline as the highlighted green area shows.
HEALTH CARE
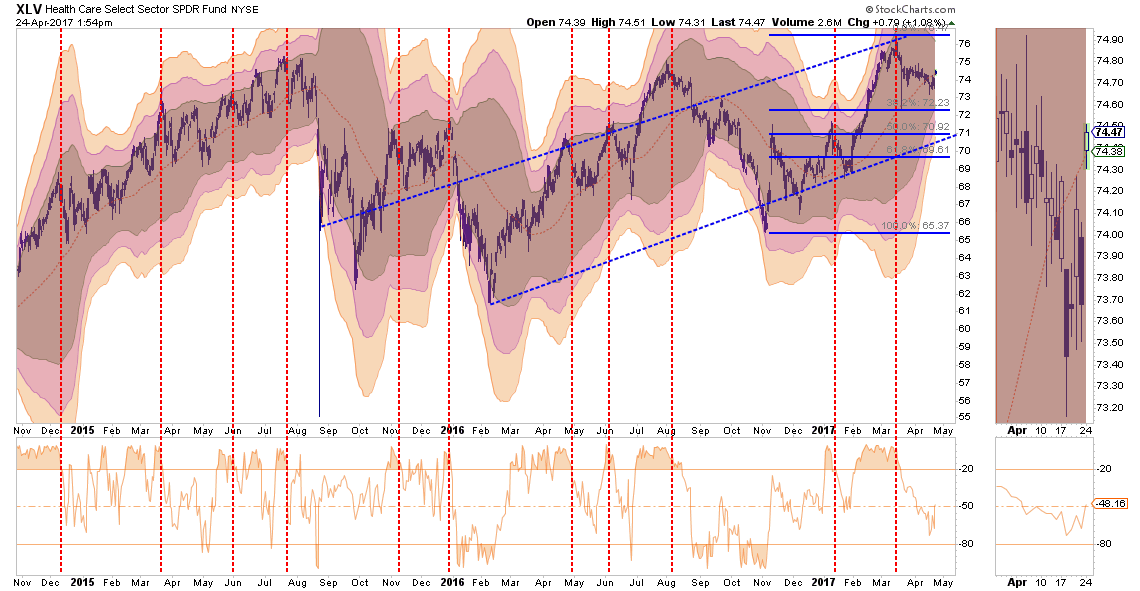
The outperformance of the Health Care sector has slowed in recent weeks particularly as the risks related to the Affordable Care Act replacement continues to rise.
Current holdings should be reduced to market-weight for now with a stop-loss at $73. A correction to $71-72 would provide an entry point while maintaining a stop at $69.
FINANCIALS
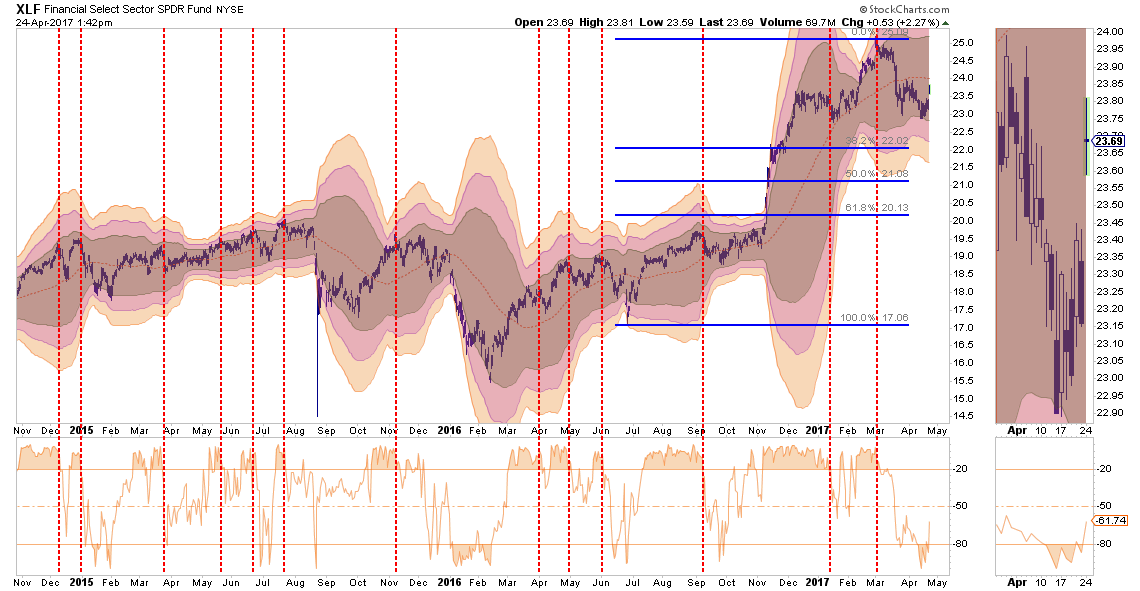
As the “Trump Trade” has faltered in recent weeks, Financials have weakened. However, the recent test of support at$23 provides a tradeable entry point with a stop at that level. The sector is currently oversold on a short-term basis, and the upside is limited to $25/share at the moment.
Risk is rising in the sector as loan delinquencies are increasing and loan demand is falling. Caution is advised.
INDUSTRIALS
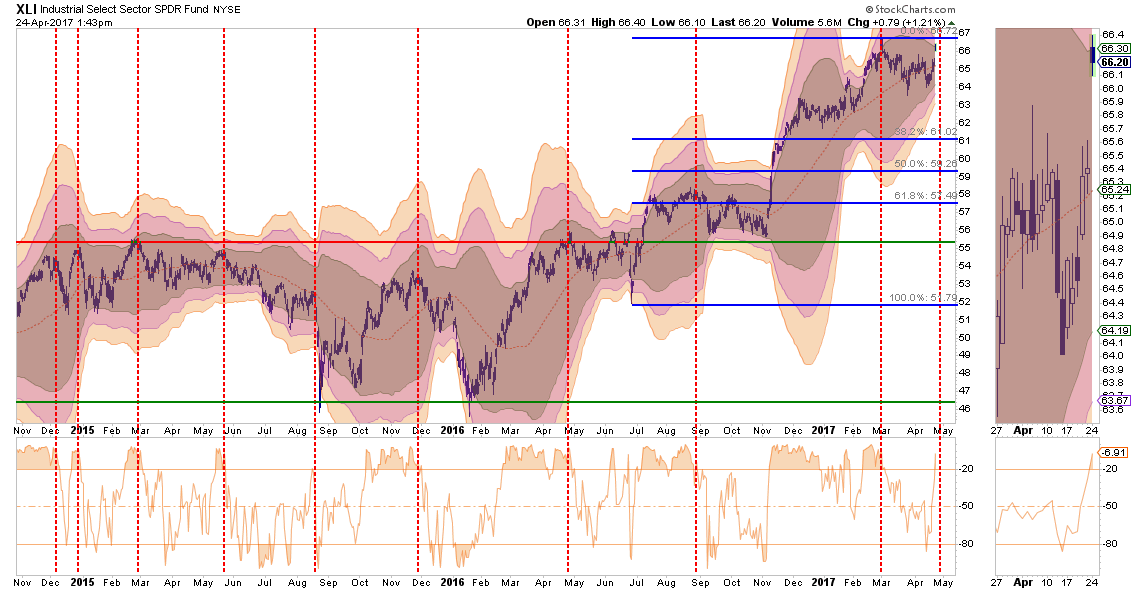
Industrials, like Financials, has seen relative performance lagging as of late as concerns over the viability of the “Make America Great Again” infrastructure plan has come into question. Importantly, this sector is directly affected by the broader economic cycle which continues to remain weak so the risk of disappointment is very high if “hope” doesn’t become reality soon.
The sector is currently overbought with little upside currently. Stops on existing holdings should be placed at $64 and reduced back to portfolio weight for now.
MATERIALS
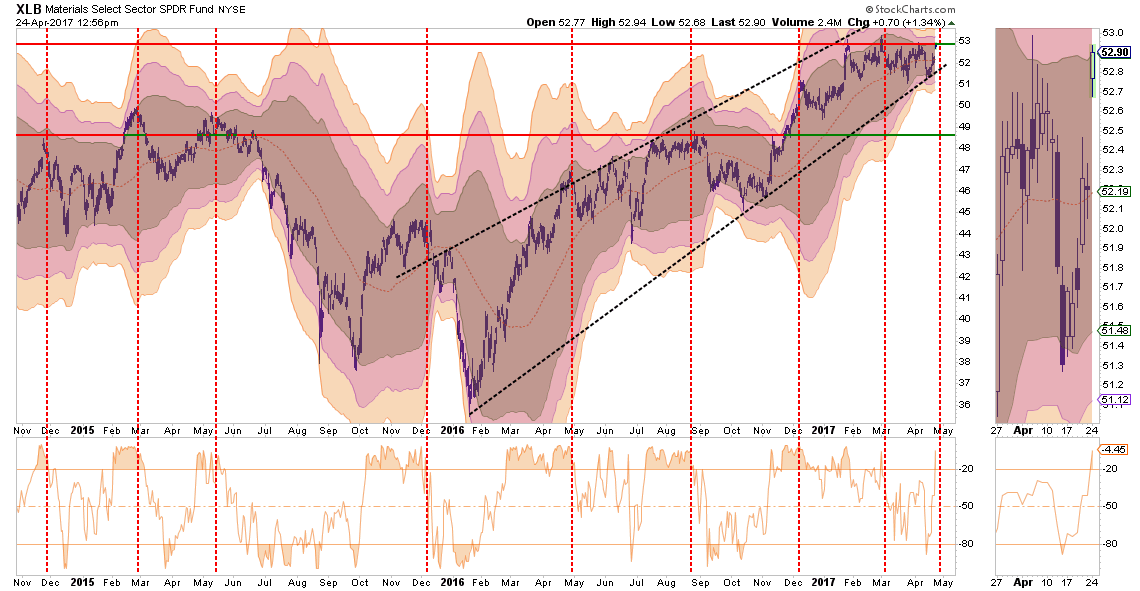
As with Industrials, the same message holds for Basic Materials, which are also a beneficiary of the dividend / “Make America Great Again” chase. This sector should also be reduced back to portfolio weight for now with stops set at the lower support lines $51.00.
UTILITIES
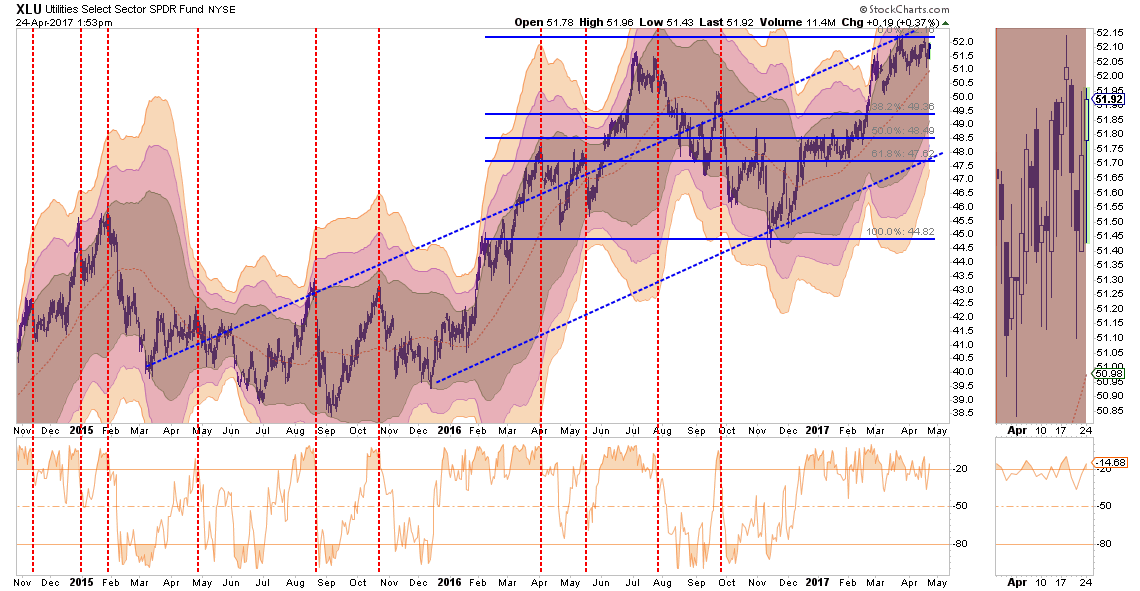
Back in January, I discussed the “rotation” trade into Utilities and Staples. That performance shift has played out nicely and the sector is now extremely overbought.
Currently, on a risk/reward basis, stops should be placed at $50 on existing positions. Look for a correction to $48.50-$49.50 for potentially adding new positions.
STAPLES
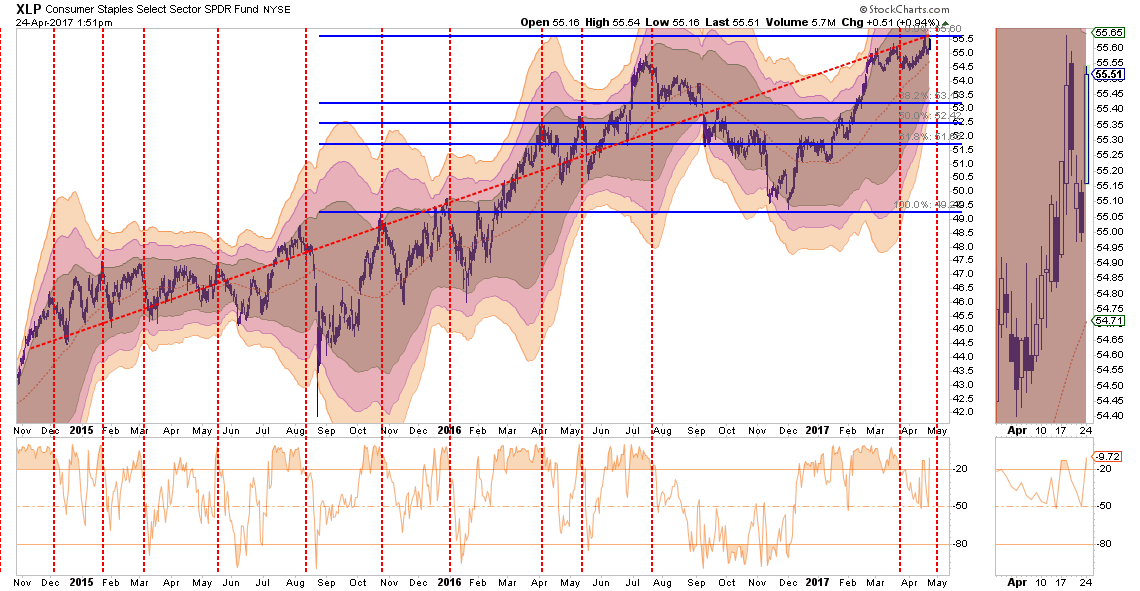
Staples, have recovered as of late and are now back to extreme overbought, along with every other sector of the market. As with Utilities, set stops on existing positions at $54.50 while rebalancing current holdings back to portfolio weights.
Look for a correction to $52 to $53 before adding exposure to the sector.
DISCRETIONARY
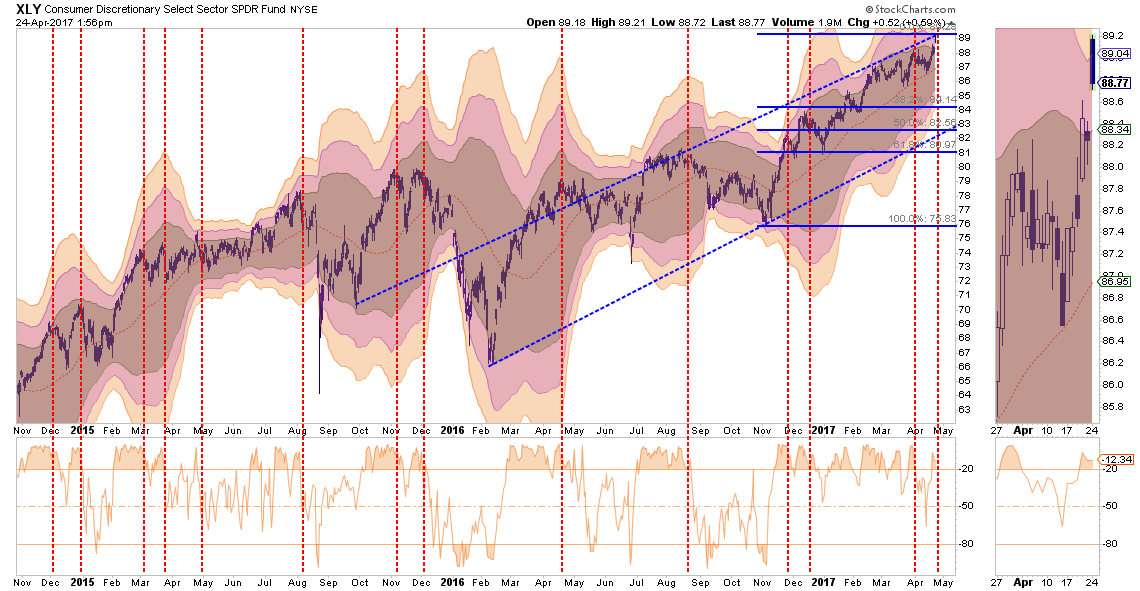
Discretionary has been running up in hopes the pick-up in consumer confidence will translate into more sales. There is little evidence of that occurring currently as retail stores are rapidly losing sales and fighting the “retail apocalypse.”. However, with discretionary stocks at highs, profits should be harvested.
Trim portfolio weightings should back to portfolio weight with stops set at $86. With many signs the consumer is weakening, caution is advised and stops should be closely monitored and honored.
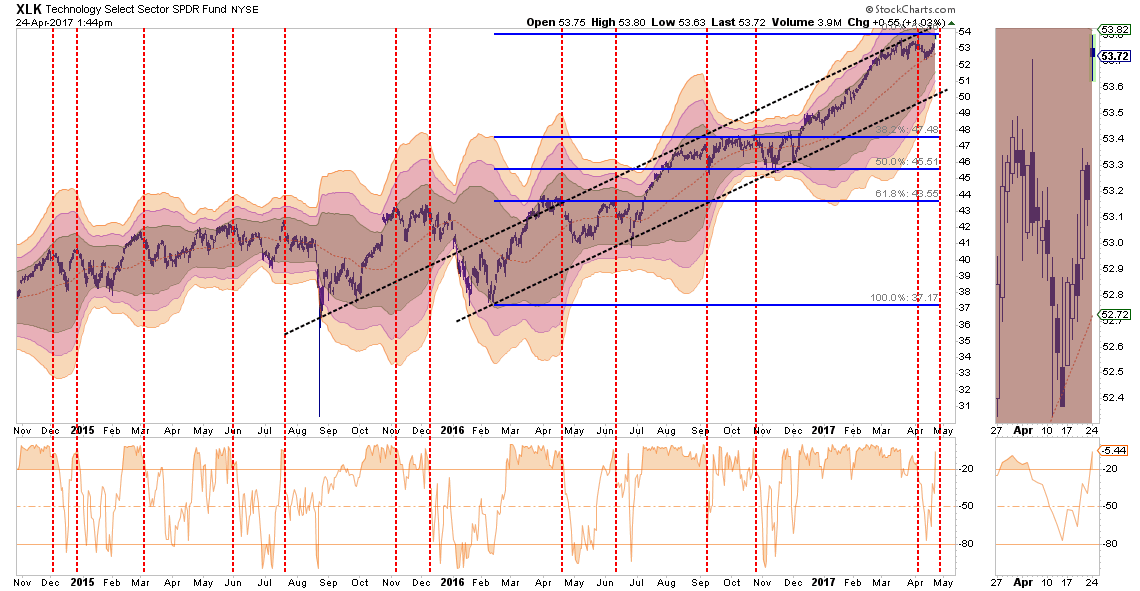
TECHNOLOGY
The Technology sector has been the “obfuscatory” sector over the past couple of months. Due to the large weightings of Apple (NASDAQ:AAPL), Google (NASDAQ:GOOGL), Facebook (NASDAQ:FB), and Amazon (NASDAQ:AMZN), the sector kept the S&P 500 index from turning in a worse performance than should have been expected prior to the election and are now elevating it post election.
The so-called FANG stocks (FB, AMZN/AAPL, NFLX, GOOG) continue to push higher, and due to their large weightings in the index, push the index up as well.
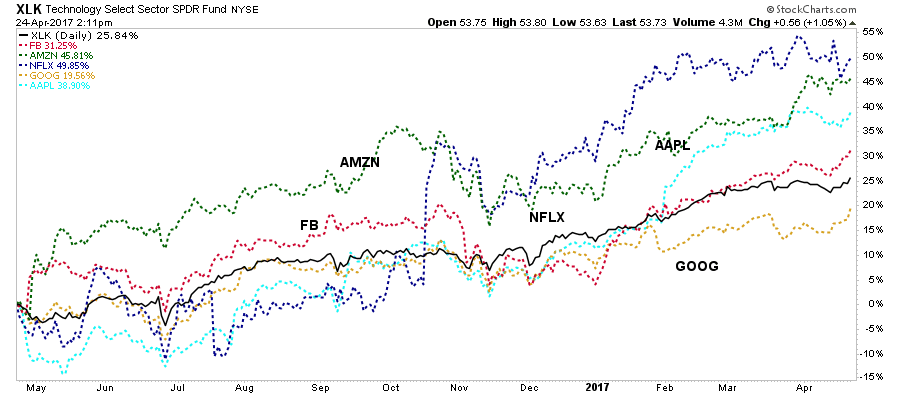
The sector is extremely overbought and stops should be moved up to $52 where the bullish trendline currently intersects with the previous corrective bottom. Weighting should be revised back to portfolio weight.
EMERGING MARKETS
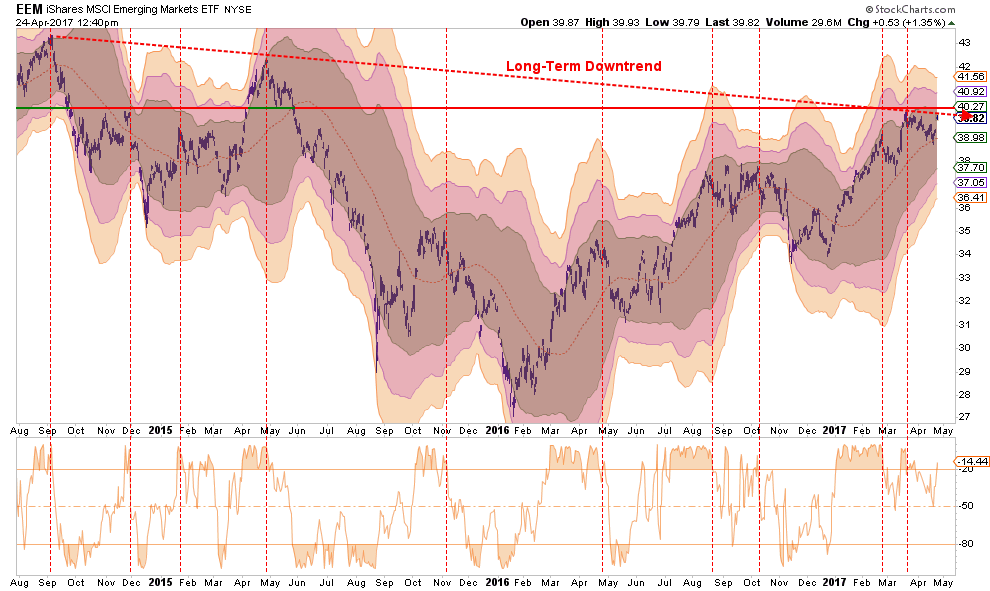
Emerging markets have had a very strong performance and have now run into the top of a long-term downtrend live. The strengthening of the US Dollar will weigh on the sector and will only get worse the longer it lasts. With the sector overbought, the majority of the gains in the sector have likely been achieved. Profits should be harvested and the sector under-weighted in portfolios. Long-term underperformance of the sector relative to domestic stocks continues to keep emerging markets unfavored in allocation models for now.
INTERNATIONAL MARKETS
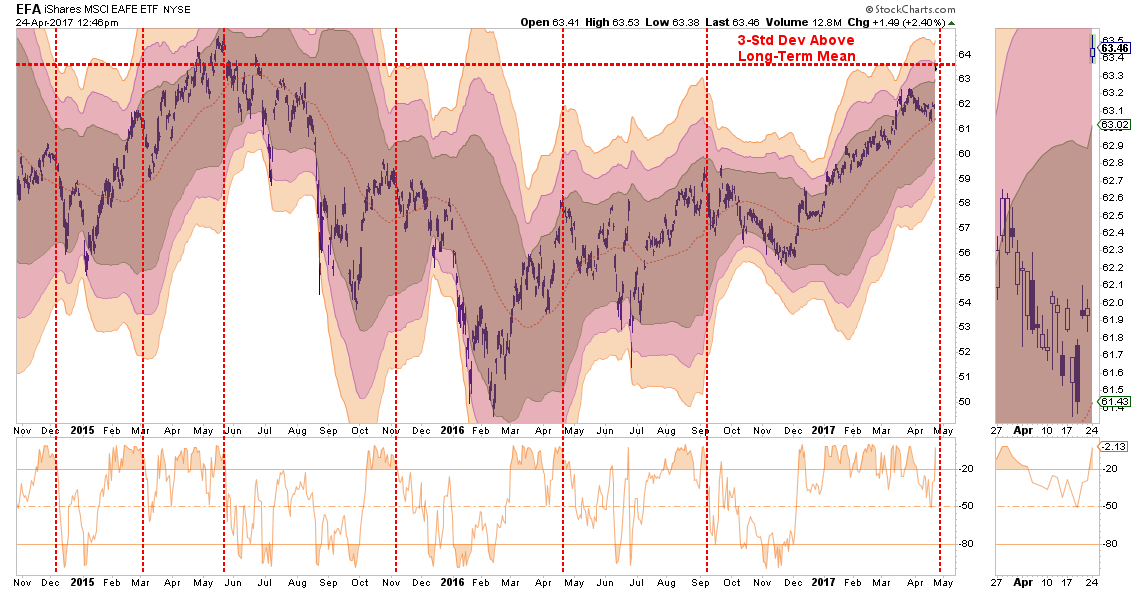
As with Emerging Markets, International sectors also remain extremely overbought and unfavored in models due to the long-term underperformance. With the international sector now trading 3-standard deviations above the long-term mean, take profits and rebalance to portfolio weightings for now.
DOMESTIC MARKETS
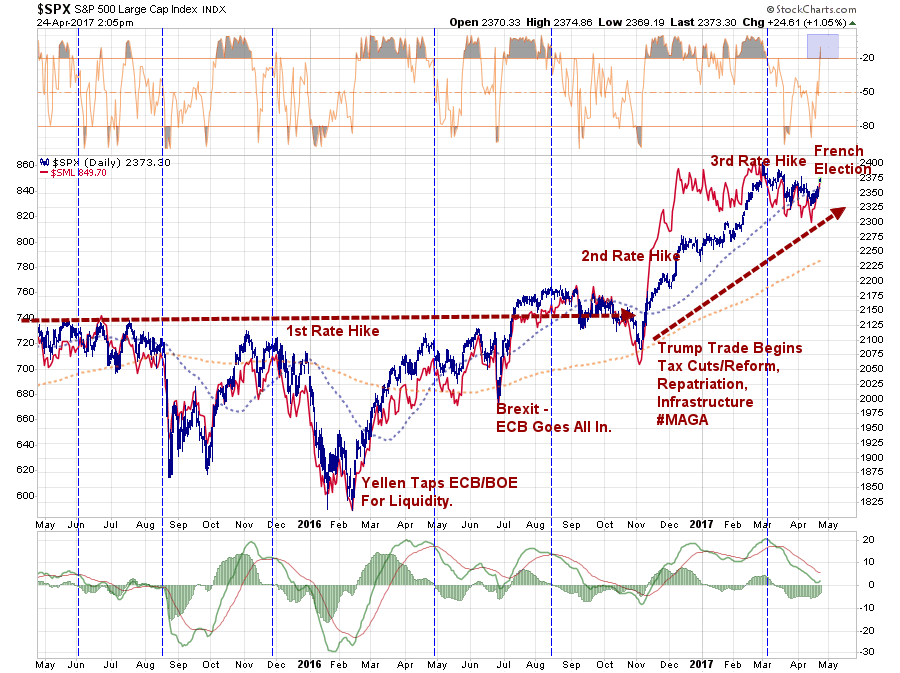
As stated above, the S&P 500 is extremely overbought, extended and exuberant. However, with a “sell signal” currently in place, there is a reason for some near-term caution. The French Election sparked a massive short-covering rally, the big question now will be the ability for follow through. The market will need to break out to new highs to end the current consolidation process.
Caution is advised for now.
SMALL CAP
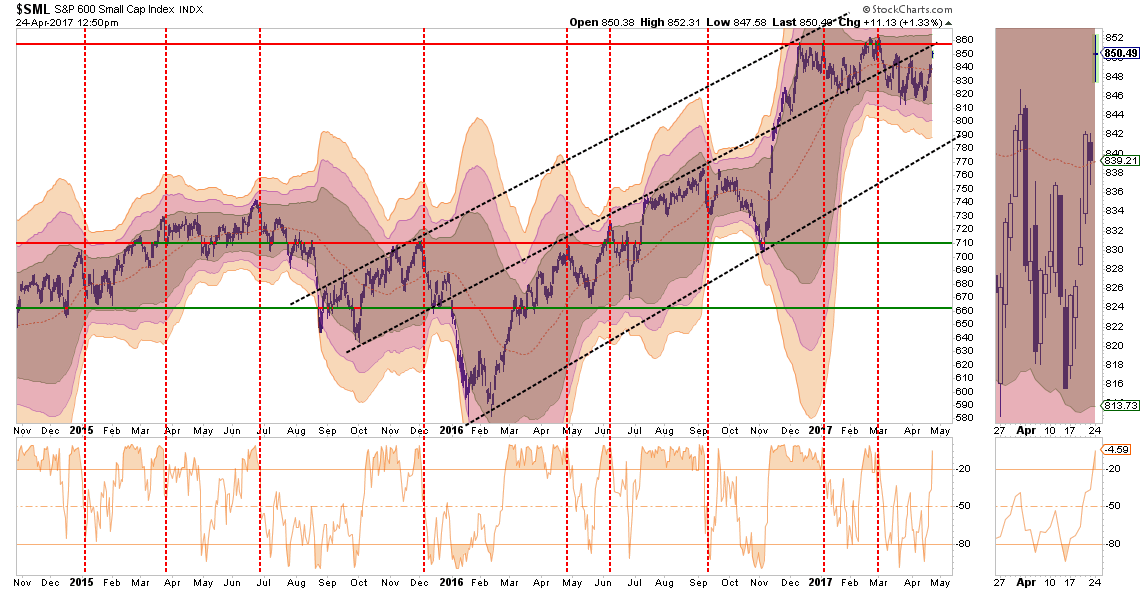
Small cap stocks went from underperforming the broader market to exploding following the Trump election. However, as of late, that performance has stalled and the sector has lagged the broader S&P 500 index.
Importantly, small capitalization stocks are THE most susceptible to weakening economic underpinnings which are being reflected in the indices rapidly declining earnings outlook. This deterioration should not be dismissed as it tends to be a “canary in the coal mine.”
Currently, small caps are back to an overbought condition which suggests the current advance may be somewhat limited. Stops should be placed at $820, a break of which would suggest a much deeper reversion is in process. Reduce exposure back to portfolio weight for now.
MID-CAP
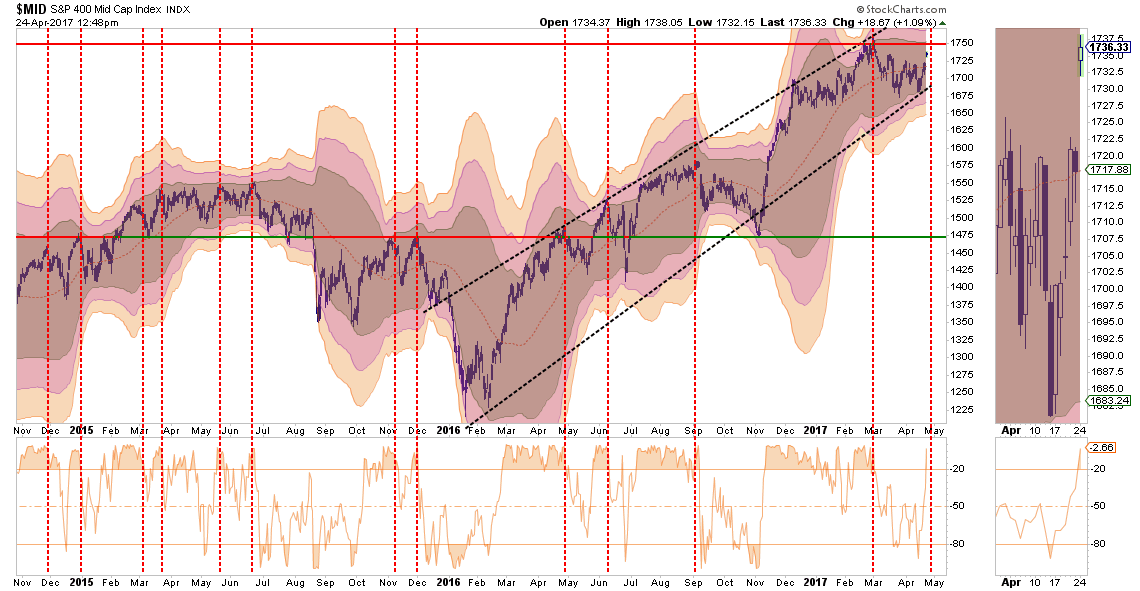
As with small cap stocks above, mid-capitalization companies had a rush of exuberance following the election as well. However, Mid-caps are currently overbought and remain below resistance. With the risk/reward setup currently unfavorable, reduce exposure back to portfolio weight for now and carry a stop at $1675.
REIT’s
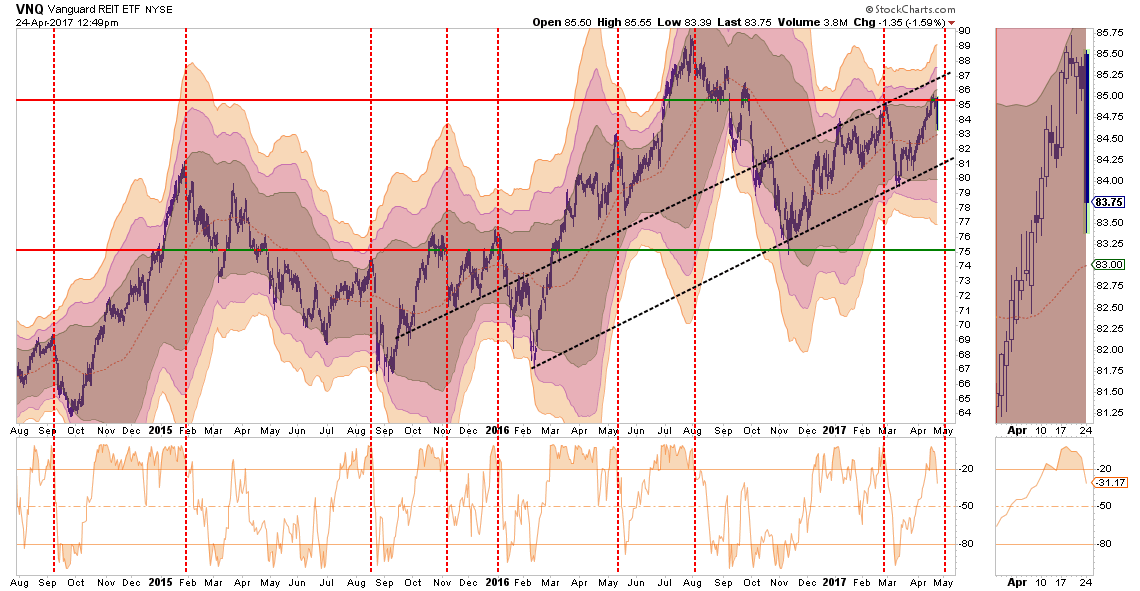
REIT’s have performed well despite the Fed’s ongoing rate hiking campaign. With rates now very overbought, as discussed below, take profits in REIT’s short-term and look for a pullback to trend-line support around $81 to add new positions. A stop should be placed at $80.
TLT – BONDS
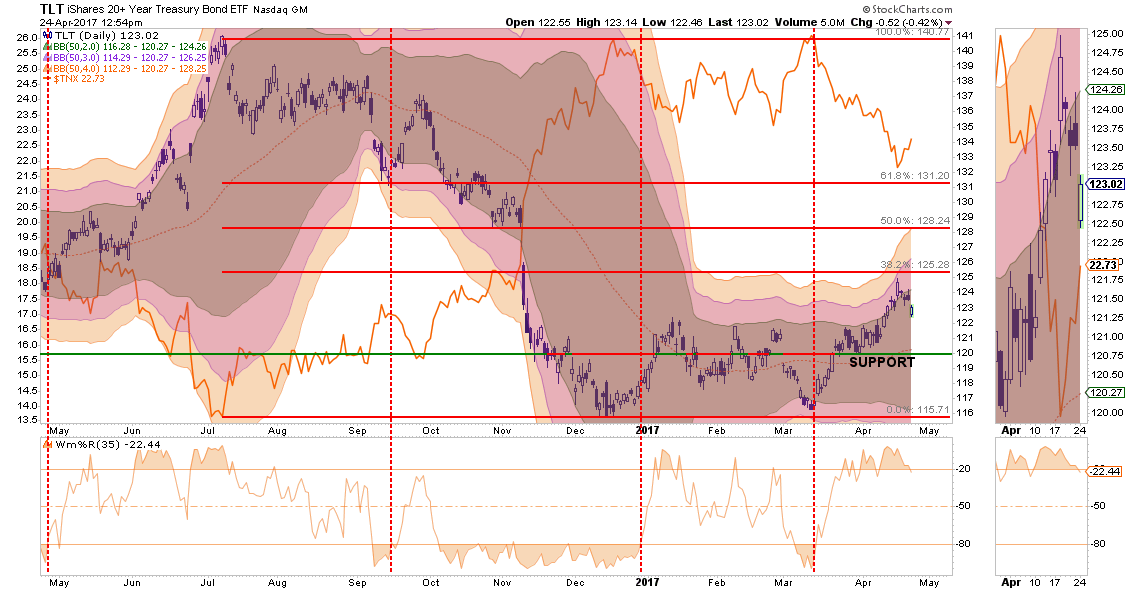
As expected a couple of months ago, rates fell as the economic underpinnings failed to come to fruition. However, with rates now oversold, bonds are now overbought. Look for a pullback to support on the index to $120 to add bond holdings back into portfolios. There is no reasonable stop currently for bond trading positions so caution is advised.
As we wrap up the month of April, we now begin the march into the seasonally weaker period of the year. Therefore, there is a higher probability the current rally could fail given the ongoing debates in Washington over the debt ceiling, tax cut and infrastructure spending plans.
As noted by Nautilus Research, the markets tend to get choppy over the next couple of months.
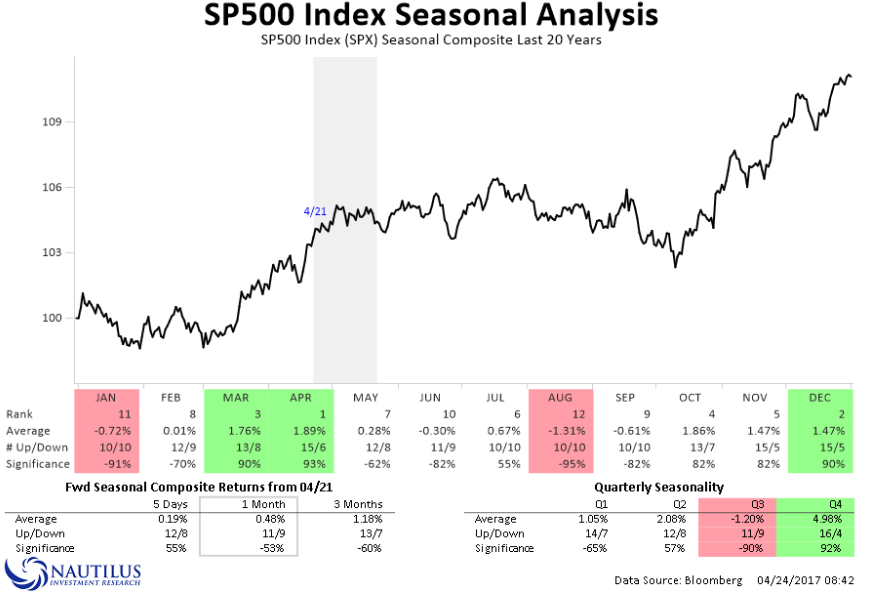
With the understanding, we are currently on intermediate term sell-signal and overbought, the current short-term rally should likely be used for portfolio repositioning and rebalancing. However, such a statement does NOT mean “cashing out” of the market as the bull market trend remains intact. Maintain, appropriate portfolio “risk” exposure for now, but cash raised from rebalancing should remain on the sidelines until a better risk/reward opportunity presents itself.
Caution remains advised.
